3447
Spinal cord neurodegeneration rostral and caudal to a degenerative cervical myelopathy (DCM): a quantitative MRI study1Spinal Cord Injury Center, University Hospital Balgrist, University of Zurich, Zurich, Switzerland, Zuerich, Switzerland, 2University of Toronto Spine Program and Toronto Western Hospital, Toronto, Ontario, Canada, Toronto, ON, Canada, 3NMR Research Unit, Queen Square MS Centre, Department of Neuroinflammation, UCL Queen Square Institute of Neurology, Faculty of Brain Sciences, University College London (UCL), London, United Kingdom, 4Department of Brain and Behavioural Sciences, University of Pavia, Pavia, Italy, Pavia, Italy, 5Brain Connectivity Center Research Department, IRCCS Mondino Foundation, Pavia, Italy, 6Queen Square MS Centre, UCL Queen Square Institute of Neurology, Faculty of Brain Sciences, London, United Kingdom, London, United Kingdom, 7Functional Neuroimaging Unit, CRIUGM, University of Montreal, Montreal, QC, Canada, Montreal, QC, Canada, 8Department of Neurophysics, Max Planck Institute for Human Cognitive and Brain Sciences, Leipzig, Germany, 9Wellcome Trust Centre for Neuroimaging, UCL Institute of Neurology, London, United Kingdom
Synopsis
Evidence suggests that degenerative cervical myelopathy (DCM) induces neurodegeneration along the entire spinal cord, i.e. rostral and caudal to the compression level. To investigate macro- and microstructural changes along the spinal cord, we applied high-resolution T2*- and diffusion-weighted MRI at both cervical and lumbar cord levels in mild to moderate DCM patients and healthy controls. This study shows that tissue-specific spinal cord neurodegeneration is evident rostral and caudal to the compression site in DCM with mild or moderate symptoms and that the extent of cervical and lumbar cord atrophy is similar.
Introduction
Degenerative cervical myelopathy (DCM) is the most common form of non-traumatic spinal cord injury. Following cervical focal damage, anterograde and retrograde degeneration of white matter tracts is initiated1,2, which can lead to remote atrophy in both rostral and caudal directions. Most studies have focused on neurodegeneration at or rostral to the lesion level3–5, whereas neurodegeneration caudal to the lesion level6,7, i.e. in the lumbar cord, is understudied. Therefore, this study aimed to investigate the following hypothesis: (i) remote neurodegenerative changes caudal to the cervical compression site occur in the lumbar cord already at the early clinical stages of the disease, (ii) those remote changes are proportional to the neurodegenerative changes in the cervical cord rostral to the compression site, and (iii) that the remote neurodegenerative changes in the lumbar cord are associated with the clinical impairment of the lower limbs.Materials and methods
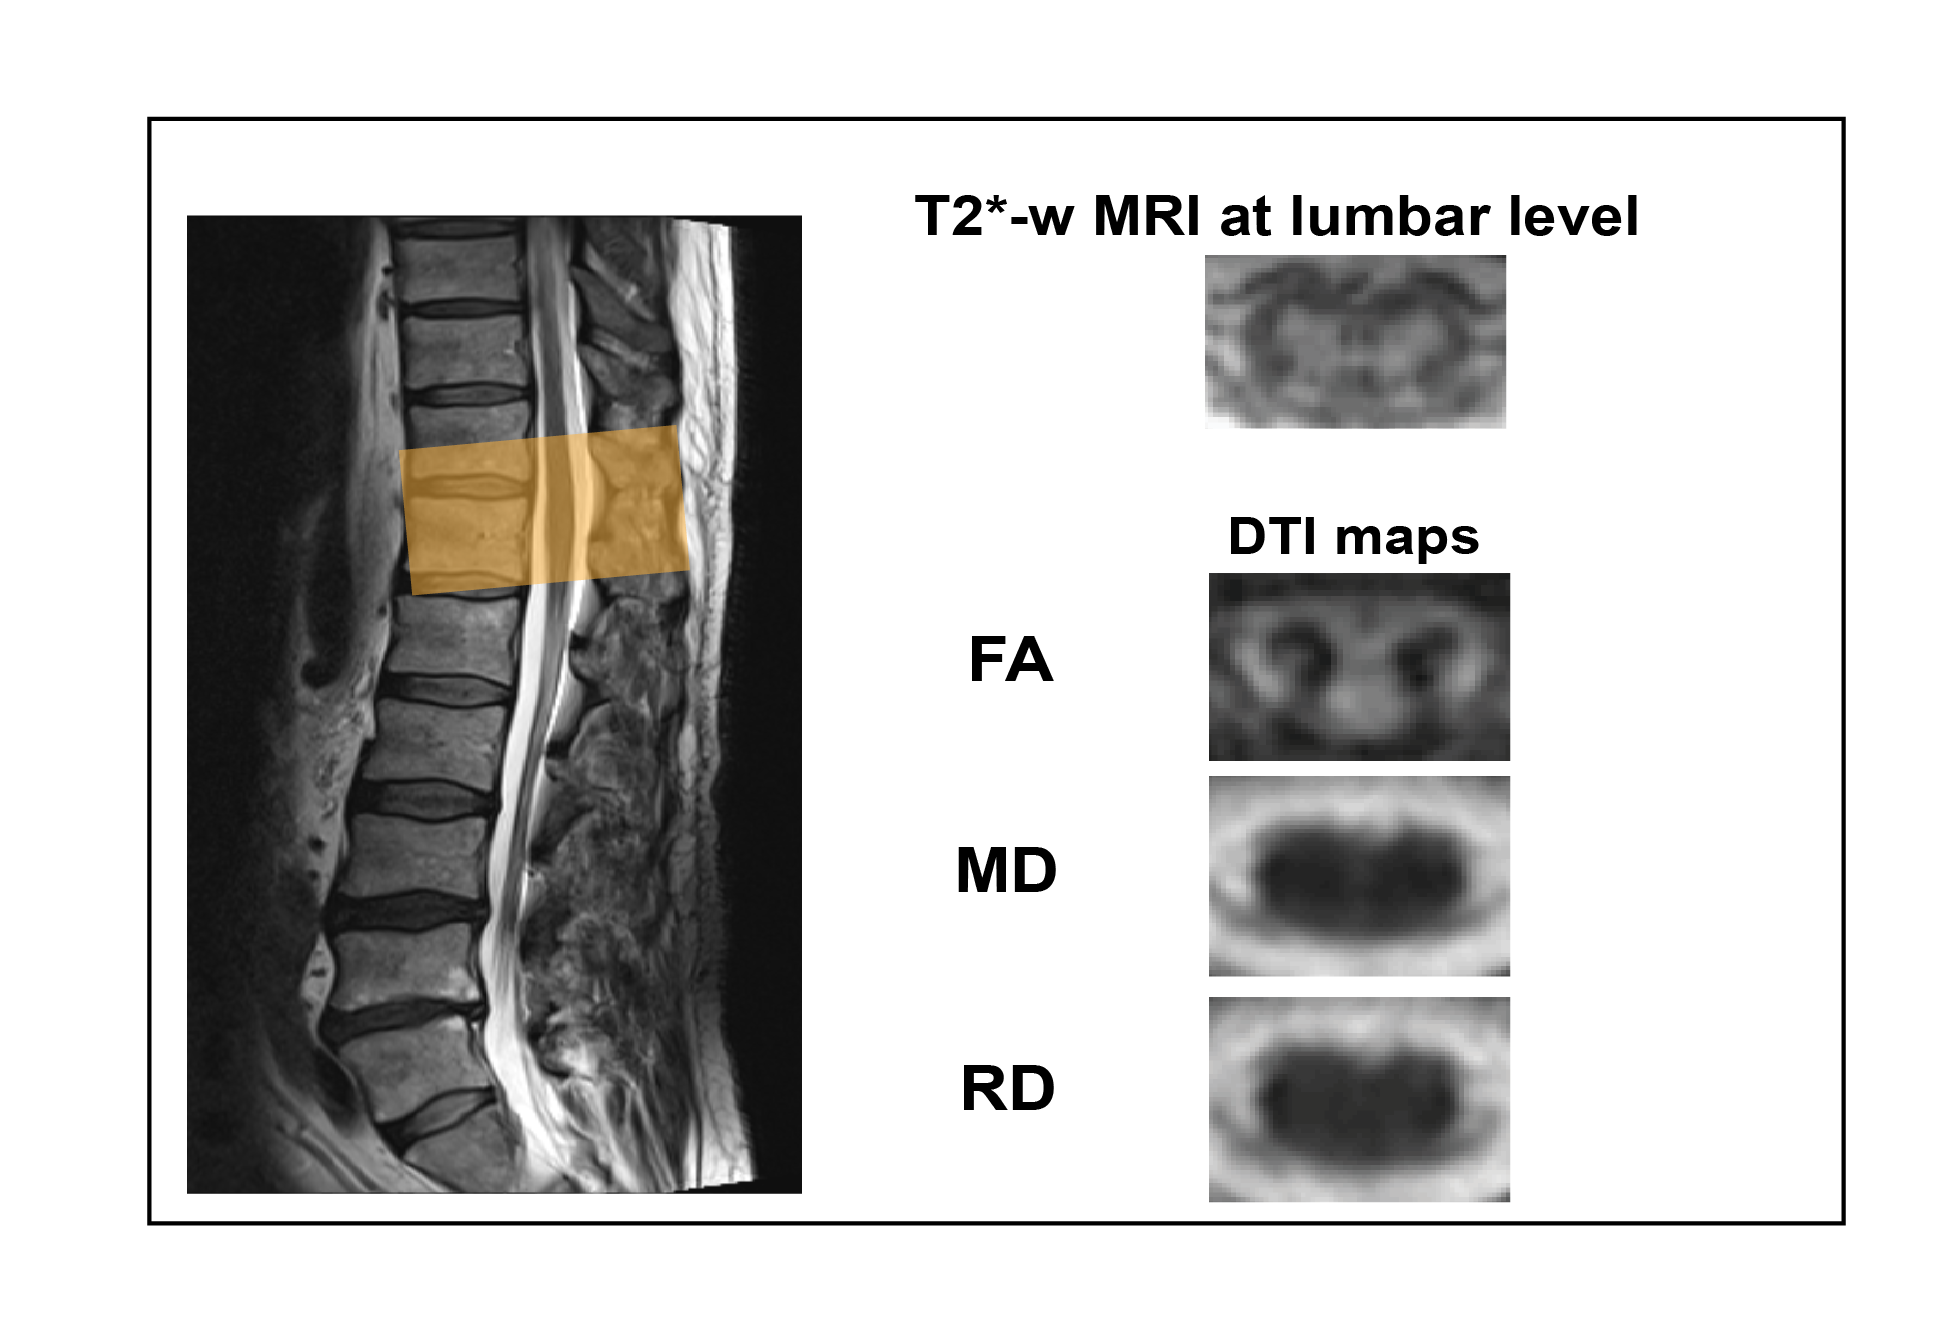
Twenty-five mild (n=21, modified Japanese Orthopaedic Association8 (mJOA)≥15) to moderate (n=4, mJOA 12-14) DCM patients (mean age (±std)=54.9±10.8 years, 8 females) prior to operation and 24 healthy controls (mean age (±std)=41.6±15.4 years, 4 female) were recruited. At cervical (C2-C3) and lumbar cord (T11-L1) level, the MRI protocol consisted of T2*-weighted 3D multi-echo (MEDIC) and diffusion-weighted imaging (DWI) sequences based on reduced-field of view (FOV) single-shot spin-echo echo planar imaging (Fig. 1). DWI was performed with cardiac-gating resulting in 60 DWI images (b = 500 sec/mm2) and six b0-weighted images. The T2*-weighted and DWI sequence parameters are reported in table 1. At cervical and lumbar level the average of four repetitions of T2*-weighted images was created using SPM129. Next the averaged images were segmented using the semi-automatic 3D active surface cord segmentation method as implemented in the JIM 7.0 software10. Grey matter was segmented manually on the same images and white matter segmentation was done by subtracting grey matter from the spinal cord mask. Cross-sectional spinal cord area (SCA), grey matter area (GMA), and white matter area (WMA) were extracted from these segmentations. DWI data processing was carried out with Matlab-based ACID toolbox11. DWI images were slice-wise linearly registered with 3 degrees of freedom translation along the frequency- and phase-encoding direction, scaling along the phase-encoding direction to correct for intra-participant motion and Eddy-current artefacts. A diffusion tensor (DT) model was fitted to the data by applying a robust tensor fitting algorithm that accounts for outlier volumes due to motion and physiologic artefacts12 and resulted in DT-derived maps (FA, MD, AD and RD). DTI maps were registered to the corresponding T2*-weighed image applying a nonlinear transformation (BSplineSyn algorithm13) implemented in the Spinal Cord Toolbox14. The total spinal cord (SC), grey (GM) and white matter (WM) masks generated on the T2*-weighted structural image by semi-automatic segmenting total spinal cord area and manually segmenting grey matter area using Jim. Next, the masks were applied to the DT maps. Mean FA, MD, and RD values were extracted from SC, GM, and WM binary masks.Due to motion artefacts, some subjects had to be excluded from cervical and lumbar level analysis. Patients underwent clinical assessments including the International Standards for Neurological Classification of Spinal Cord Injury15 protocol for motor, light-touch and pinprick scores, as well as mJOA8. Group comparisons were performed using two-sample t-test. Regression analysis was conducted adjusting for age and sex. The level of significance was set at p< 0.05. The lumbar cord volumetric changes were previously reported16 and in this study DWI has been applied to lumbar cord next to the cervical cord macro-microstructral MRI.Results
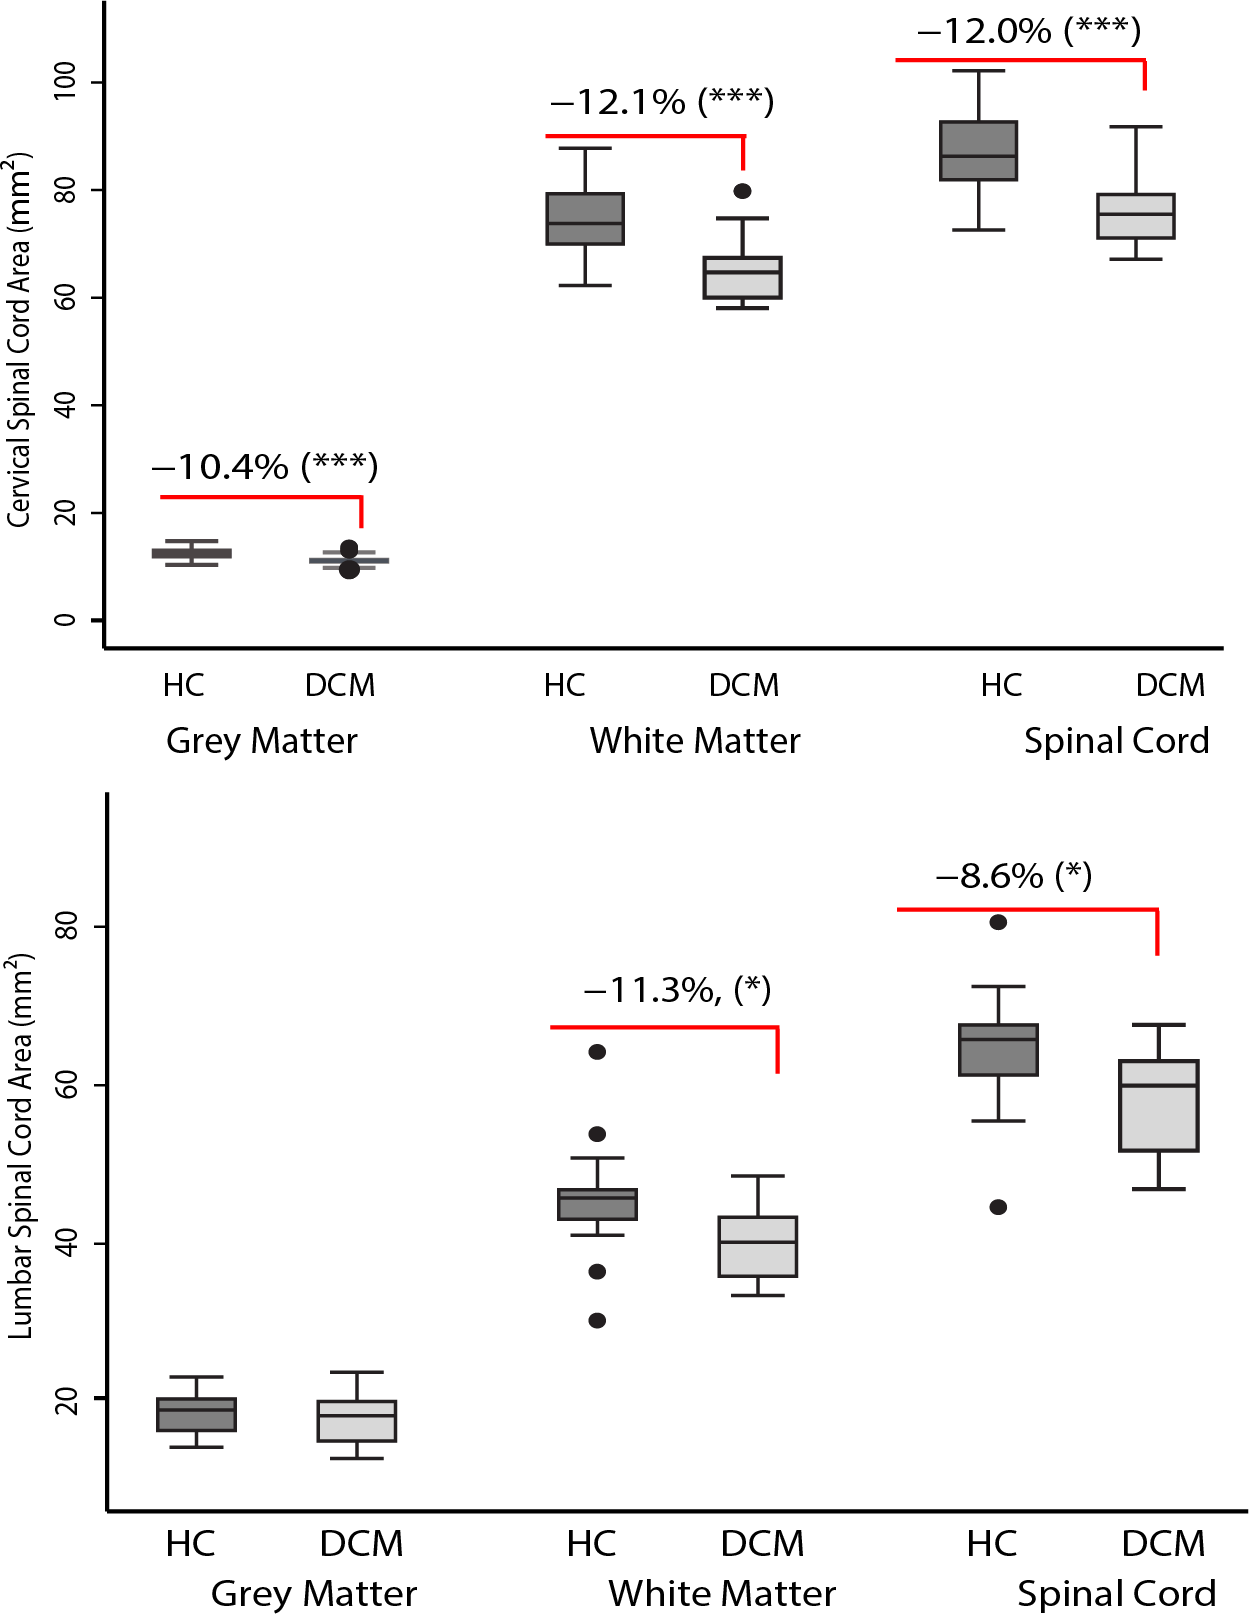
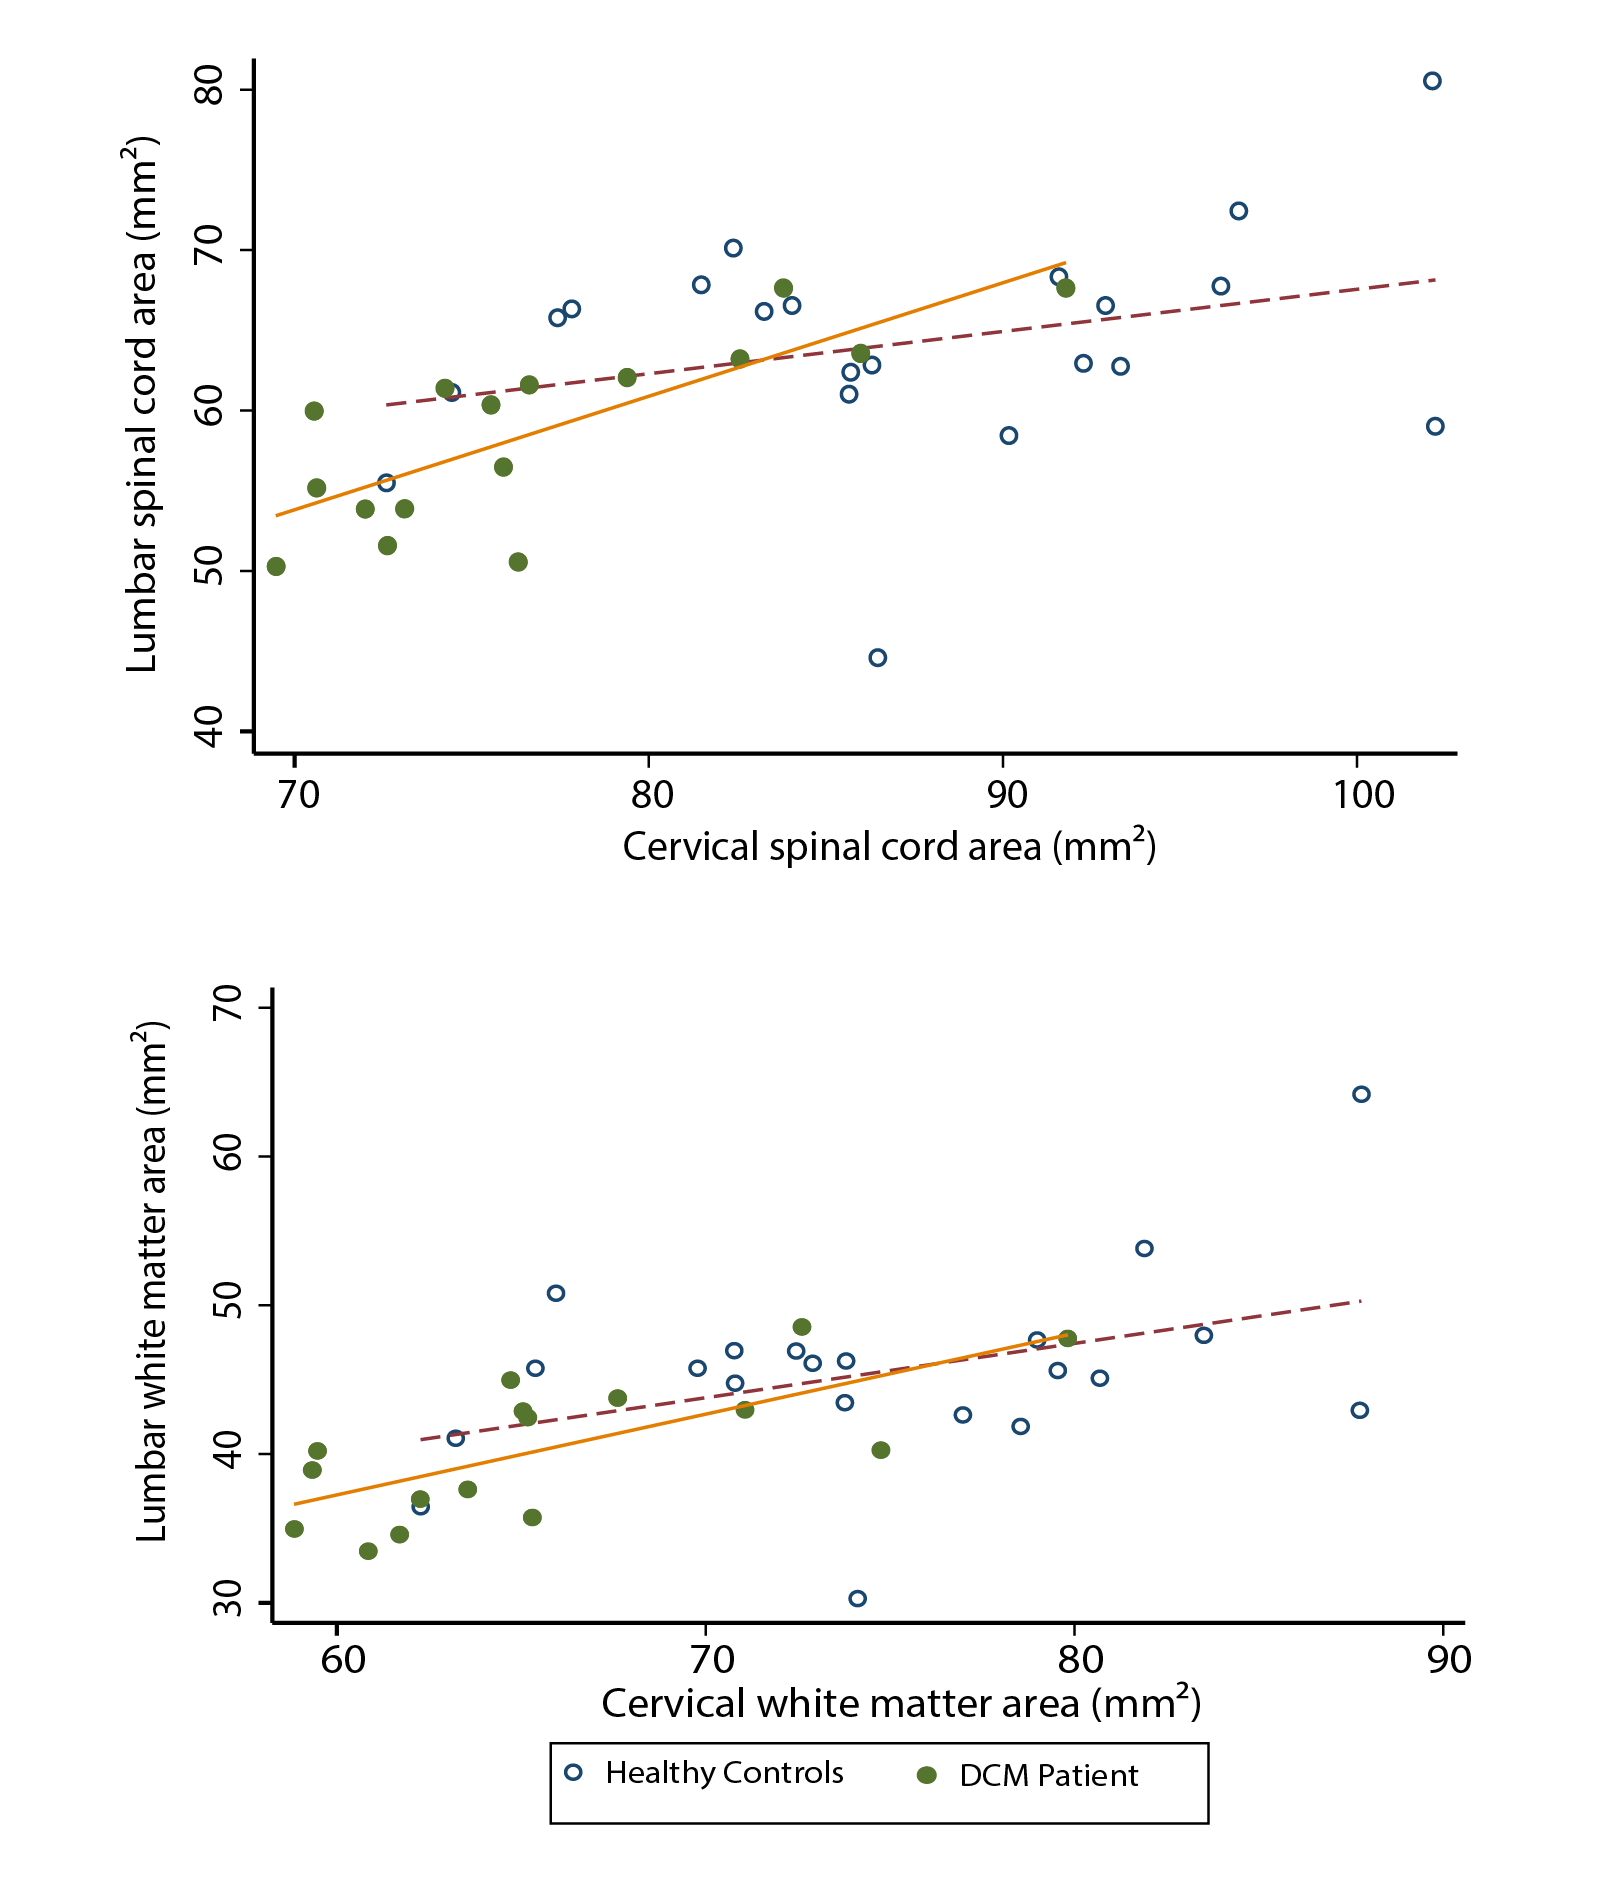
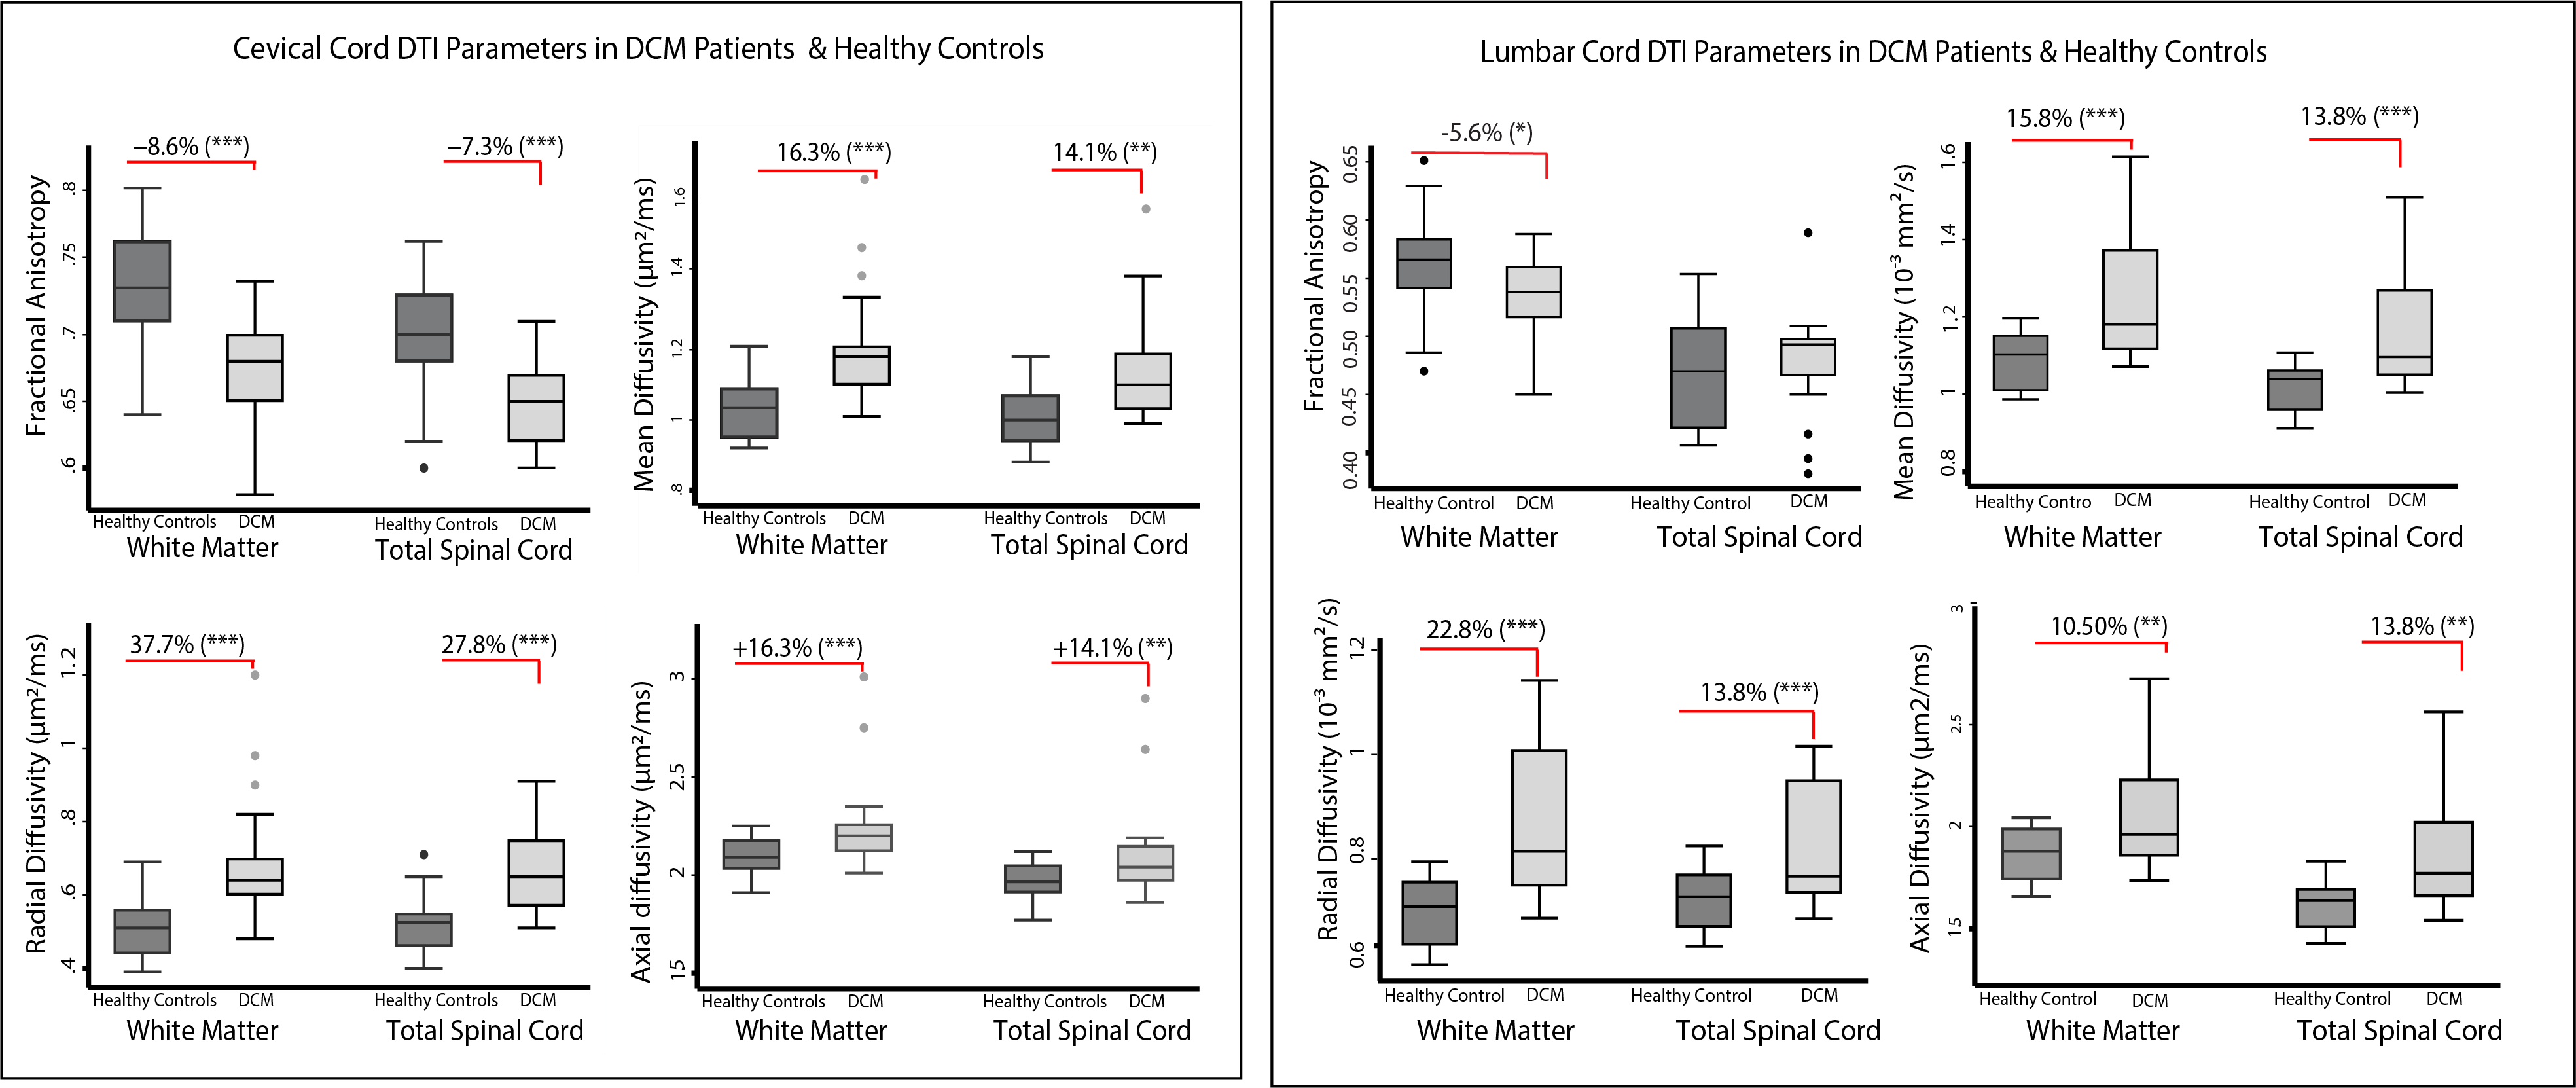
In both cervical and lumbar cord, SC and WM areas were significantly reduced in DCM patients compared to healthy controls (SCA cervical: p<0.0001, Δ: -12.0%; WMA cervical: p<0.0001, Δ: -12.1%; SCA lumbar: p<0.003, Δ: -9.7%; WMA lumbar: p=0.002, Δ: -12.1%) (Fig. 2). SCA and WMA in cervical and lumbar cords were correlated with each other in DCM patients (SCA: p<0.0001, r=0.78; WMA: p=0.002, r=0.70), but not in healthy controls (SCA: p=0.168, r= 0.31; WMA: p=0.06, r=0.42) (Fig. 3). DT metrics of DCM patients in SCA and WM were altered in a very similar fashion in cervical and lumbar cords, in both total spinal cord and white matter. FA was reduced, MD, AD and RD were increased in DCM patients compared to healthy controls. All results are detailed in table 1 and figure 4. Of note our results in cervical cord confirmed previous reports in DCM patients 4,5,11. Lumbar WM atrophy was associated with sensory scores in the lower limbs of DCM patients independent of cervical WM (light touch: p<.001, r=0.92; pinprick: p=0.001, r=0.86).Discussion and Conclusion
This study shows that tissue-specific spinal cord neurodegeneration is evident rostral and caudal to the compression site in DCM patients with mild or moderate symptoms and happens to a similar extent in cervical and lumbar cord. Those results indicate common pathophysiological pathways in neurodegenerative changes rostral and caudal to the compression level, which is illustrated by the association found between the extent of cervical and lumbar cord macrostructural changes. The association found between lumbar WM atrophy and sensory impairment suggests a potential role of remote lumbar neurodegenerative changes in clinical impairment in DCM patients.Acknowledgements
This study is funded by ERA-NET NEURON (hMRIofSCI no: 32NE30_173678), the European Union's Horizon 2020 research and innovation program under the grant agreement No 681094, and the Swiss State Secretariat for Education, Research and Innovation (SERI) under contract number 15.0137, grants from Wings for life charity (INSPIRED) (No WFL-CH-007/14) & (No WFL-CH-19/20), grants from International Foundation for Research (IRP-158) and Eccellenza fellowship/181362 by SNSF. This study is funded by Wellcome Trust, grant 091593/Z/10/Z.
ISRT, Wings for Life and the Craig H. Neilsen Foundation for the INSPIRED study. CGWK receives funding from the UK MS Society (#77), Wings for Life (#169111), Horizon2020 (CDS-QUAMRI, #634541), BRC (#BRC704/CAP/CGW)
References
1 Liu H, MacMillian EL, Jutzeler CR, et al. Assessing structure and function of myelin in cervical spondylotic myelopathy. Neurology 2017; 89: 602–10.
2 Ito T, Oyanagi K, Takahashi H, Takahashi HE, Ikuta F. Cervical spondylotic myelopathy: Clinicopathologic study on the progression pattern and thin myelinated fibers of the lesions of seven patients examined during complete autopsy. Spine (Phila Pa 1976) 1996; 21: 827–33.
3 Grabher P, Mohammadi S, David G, Freund P. Neurodegeneration in the Spinal Ventral Horn Prior to Motor Impairment in Cervical Spondylotic Myelopathy. J Neurotrauma 2017; 34: 2329–34.
4 Martin A, Leener B De, Cohen-Adad J, et al. Monitoring for Myelopathic Progression with Multiparametric Quantitative MRI. In: Toft M, ed. 2017 CSRS Annual Meeting. Public Library of Science, 2017: e0195733.
5 Grabher P, Mohammadi S, Trachsler A, et al. Voxel-based analysis of grey and white matter degeneration in cervical spondylotic myelopathy. Sci Rep 2016;
6: 24636.6 Chen X, Kong C, Feng S, et al. Magnetic resonance diffusion tensor imaging of cervical spinal cord and lumbosacral enlargement in patients with cervical spondylotic myelopathy. J Magn Reson Imaging 2016; 43: 1484–91.
7 Cui L, Kong C, Chen X, Liu Y, Zhang Y, Guan Y. Changes in diffusion tensor imaging indices of the lumbosacral enlargement correlate with cervical spinal cord changes and clinical assessment in patients with cervical spondylotic myelopathy. Clin Neurol Neurosurg 2019; 186: 105282.
8 Tetreault L, Kopjar B, Nouri A, et al. The modified Japanese Orthopaedic Association scale: establishing criteria for mild, moderate and severe impairment in patients with degenerative cervical myelopathy. Eur Spine J 2017; 26: 78–84.
9 Ashburner J, Ridgway GR. Symmetric diffeomorphic modeling of longitudinal structural MRI. Front Neurosci 2013; 6: 197.
10 Horsfield MA, Sala S, Neema M, et al. Rapid semi-automatic segmentation of the spinal cord from magnetic resonance images: Application in multiple sclerosis. Neuroimage 2010; 50: 446–55.
11 Seif M, David G, Huber E, Vallotton K, Curt A, Freund P. Cervical cord neurodegeneration in traumatic and non-traumatic spinal cord injury. J Neurotrauma 2019; : neu.2019.6694.
12 David G, Freund P, Mohammadi S. The efficiency of retrospective artifact correction methods in improving the statistical power of between-group differences in spinal cord DTI. Neuroimage 2017; 158: 296–307.
13 Tustison NJ, Avants BB. Explicit B-spline regularization in diffeomorphic image registration. Front Neuroinform 2013. DOI:10.3389/fninf.2013.00039.
14 De Leener B, Lévy S, Dupont SM, et al. SCT: Spinal Cord Toolbox, an open-source software for processing spinal cord MRI data. Neuroimage 2017; 145: 24–43.
15 Kirshblum SC, Burns SP, Biering-Sorensen F, et al. International standards for neurological classification of spinal cord injury (Revised 2011). J. Spinal Cord Med. 2011; 34: 535–46.16 ISMRM20 Power Pitch: Spinal Cord, Head and Neck. .
Figures
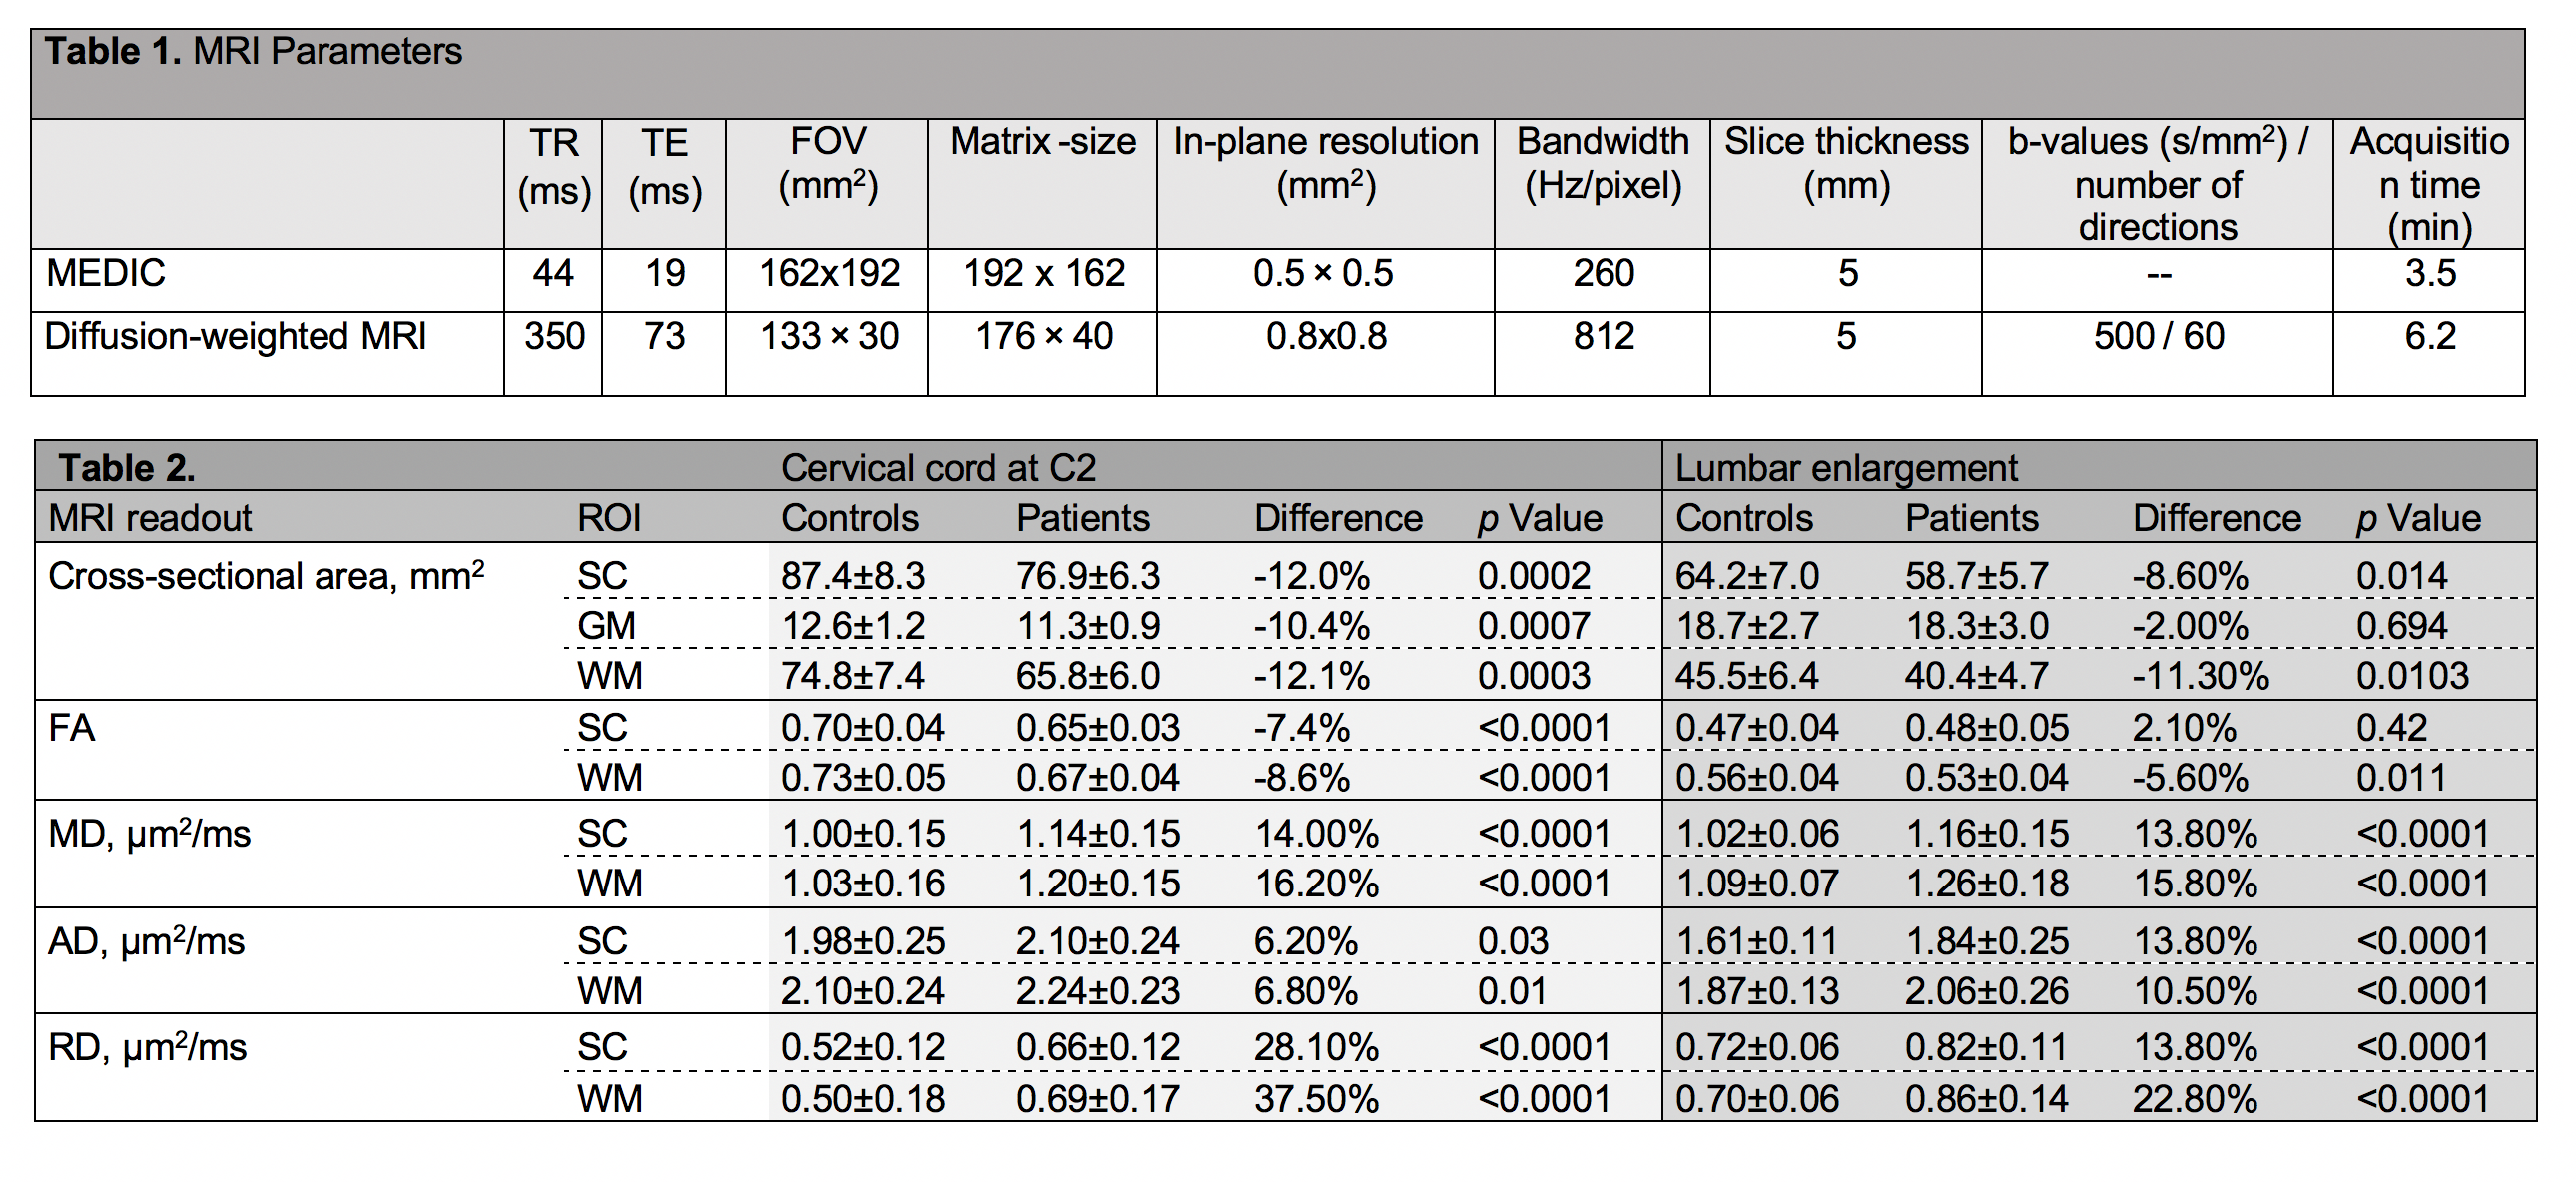
Table 1. MRI T2*-weighted (MEDIC) sequence and diffusion-weighted sequence parameters.
Table 2. Tissue-specific cross-sectional areas and diffusion tensor imaging scalar values in the cervical cord at C2-3 level and in the lumbar enlargement in patients with degenerative cervical myelopathy and healthy controls. FA: fractional anisotropy, MD: mean diffusivity, AD, axial diffusivity, RD: radial diffusivity.