3445
Characterizing 1-Year Development of Cervical Cord Atrophy Across Different MS Phenotypes: A Voxel-Wise, Multicenter Analysis
Paola Valsasina1, Maria A. Rocca1,2,3, Claudio Gobbi4,5, Chiara Zecca4,5, Alex Rovira6, Xavier Montalban7, Hugh Kearney8, Olga Ciccarelli8, Lucy Matthews9, Jacqueline Palace9, Antonio Gallo10, Alvino Bisecco10, Achim Gass11, Philipp Eisele11, and Massimo Filippi1,2,3,12,13
1Neuroimaging Research Unit, Division of Neuroscience, IRCCS San Raffaele Scientific Institute, Milan, Italy, 2Neurology Unit, IRCCS San Raffaele Scientific Institute, Milan, Italy, 3Vita-Salute San Raffaele University, Milan, Italy, 4Multiple Sclerosis Center, Department of Neurology, Neurocenter of Southern Switzerland, Civic Hospital, Lugano, Switzerland, 5Faculty of Biomedical Sciences, Università della Svizzera Italiana, Lugano, Switzerland, 6Section of Neuroradiology, Department of Radiology, Hospital Universitari Vall d’Hebron, Barcelona, Spain, 7Department of Neurology/Neuroimmunology, Multiple Sclerosis Center of Catalonia, Hospital Universitari Vall d’Hebron, Barcelona, Spain, 8NMR Research Unit, Queen Square MS Centre, Department of Neuroinflammation, UCL Institute of Neurology, London, United Kingdom, 9Nuffield Department of Clinical Neurosciences, University of Oxford, Oxford, United Kingdom, 10Department of Advanced Medical and Surgical Sciences, and 3T MRI Center, University of Campania “Luigi Vanvitelli”, Naples, Italy, 11Department of Neurology, Universitätsmedizin Mannheim, University of Heidelberg, Mannheim, Germany, 12Neurorehabilitation Unit, IRCCS San Raffaele Scientific Institute, Milan, Italy, 13Neurophysiology Service, IRCCS San Raffaele Scientific Institute, Milan, Italy
1Neuroimaging Research Unit, Division of Neuroscience, IRCCS San Raffaele Scientific Institute, Milan, Italy, 2Neurology Unit, IRCCS San Raffaele Scientific Institute, Milan, Italy, 3Vita-Salute San Raffaele University, Milan, Italy, 4Multiple Sclerosis Center, Department of Neurology, Neurocenter of Southern Switzerland, Civic Hospital, Lugano, Switzerland, 5Faculty of Biomedical Sciences, Università della Svizzera Italiana, Lugano, Switzerland, 6Section of Neuroradiology, Department of Radiology, Hospital Universitari Vall d’Hebron, Barcelona, Spain, 7Department of Neurology/Neuroimmunology, Multiple Sclerosis Center of Catalonia, Hospital Universitari Vall d’Hebron, Barcelona, Spain, 8NMR Research Unit, Queen Square MS Centre, Department of Neuroinflammation, UCL Institute of Neurology, London, United Kingdom, 9Nuffield Department of Clinical Neurosciences, University of Oxford, Oxford, United Kingdom, 10Department of Advanced Medical and Surgical Sciences, and 3T MRI Center, University of Campania “Luigi Vanvitelli”, Naples, Italy, 11Department of Neurology, Universitätsmedizin Mannheim, University of Heidelberg, Mannheim, Germany, 12Neurorehabilitation Unit, IRCCS San Raffaele Scientific Institute, Milan, Italy, 13Neurophysiology Service, IRCCS San Raffaele Scientific Institute, Milan, Italy
Synopsis
Here, we used a longitudinal, voxel-wise analysis to characterize baseline cervical cord tissue loss and its progression over 1-year follow-up in a cohort of patients with multiple sclerosis (MS) acquired at 7 European sites. Results indicated that baseline cord atrophy was severe in MS patients vs controls, with a prevalent involvement of posterior/lateral regions of the upper cord, a differential effect across phenotypes and a strong correlation with disability. Cord atrophy significantly increased over time in all MS patients, was more widespread in relapsing-remitting MS than in other phenotypes and contributed to explain clinical disability at 1-year follow-up.
Introduction
In multiple sclerosis (MS), the cervical spinal cord is affected by demyelination and neuro-axonal injury, leading to irreversible tissue loss [1]. Previous studies assessing the regional distribution of cervical cord atrophy showed a differential involvement of cord levels across MS phenotypes [2, 3]. However, voxel-wise atrophy progression over time in MS has not been investigated yet. Aim of this study was to evaluate, using voxel-wise analysis, distribution and changes over time of cervical cord atrophy in MS from a dataset acquired at 7 European sites.Methods
Baseline and 1-year 3D T1-weighted cervical cord scans and clinical evaluation were obtained from 54 healthy controls (HC) and 110 MS patients (13 clinically isolated syndrome [CIS], 75 relapsing-remitting [RR] and 22 progressive [P]MS). The cervical spinal cord was segmented from baseline and 1-year 3D T1-weighted scans using a semi-automatic method based on active surfaces [4]. Then, an optimized, longitudinal pipeline was used to co-register baseline and 1-year follow-up cord scans to a common template. Voxel-wise differences of cervical cord atrophy, their longitudinal changes and correlations with clinical variables were assessed using sex-, age-, center-, and cord volume-corrected SPM12 factorial models.Results
MS patients exhibited significant (p<0.05, family-wise error [FWE] corrected) baseline cervical cord atrophy vs HC in C1/C2 anterior, posterior/lateral, and C4-C6 posterior cord regions (Figure 1). While CIS patients showed cord tissue expansion vs HC at posterior C4, RRMS presented significant cord atrophy vs CIS in posterior/lateral C2-C4 regions, and PMS showed widespread cord atrophy vs RRMS patients at C4-C5 and C7 (Figure 1). During the follow-up, a significant progression (p<0.05, FWE) of cord atrophy was detected in MS at posterior/lateral C2 and C4-C6 (Figure 2). Such progression was driven by RRMS, while CIS did not show cord atrophy changes over time, and PMS patients showed clusters of tissue loss at posterior C2 and C6 (Figure 2). Baseline clinical disability was related (r ranging from -0.54 to -0.56, p<0.05, FWE) with baseline cord atrophy at posterior/lateral C2-C4. In addition, baseline atrophy in lateral C3-C4 regions was able to predict EDSS score at 1-year follow-up (r ranging from -0.80 to -0.86, p<0.05, FWE).Discussion
This study applies a new technique to give a comprehensive description of cervical cord atrophy at a voxel-wise level, both cross-sectionally and over 1-year follow-up, in patients with MS. Such an analysis allowed us obtaining a detailed characterization of the effects of cord atrophy on phenotype and clinical disability. Results indicated that RRMS patients were those showing more widespread cord atrophy progression over time, even if PMS were not spared by cord tissue loss at 1-year follow-up. The strong correlation of baseline cord atrophy with concomitant and 1-year EDSS scores confirms the importance of this measure in explaining the accumulation of irreversible disability, at least at relatively short-term follow-up.Conclusions
Voxel-wise analysis of cervical atrophy detected a differential involvement of cord levels and characterized 1-year evolution of tissue loss across MS phenotypes. Cord atrophy was clinically relevant and contributed to explain disability at follow-up.Acknowledgements
No acknowledgement found.References
[1] Gass A, Rocca MA, Agosta F, Ciccarelli O, Chard D, Valsasina P, Brooks J, Bischof A, Eisele P, Kappos L, Barkhof F, Filippi M. MRI monitoring of pathological changes in the spinal cord in patients with multiple sclerosis. Lancet Neurol 2015;14:443-454. [2] Rocca MA, Valsasina P, Damjanovic D, Horsfield MA, Mesaros S, Stosic-Opincal T, Drulovic J, Filippi M. Voxel-wise mapping of cervical cord damage in multiple sclerosis patients with different clinical phenotypes. J Neurol Neurosurg Psychiatry 2013;84;35-41. [3] Rocca MA, Valsasina P, Meani A, Gobbi C, Zecca C, Rovira A, Montalban X, Kearney H, Ciccarelli O, Matthews L, Palace J, Gallo A, Bisecco A, Gass A, Eisele P, Lukas C, Bellenberg B, Barkhof F, Vrenken H, Preziosa P, Comi G, Filippi M. Clinically relevant cranio-caudal patterns of cervical cord atrophy evolution in MS. Neurology 2019;93:e1852-e1866. [4] Horsfield MA, Sala S, Neema M, Absinta M, Bakshi A, Sormani MP, Rocca MA, Bakshi R, Filippi M. Rapid semi-automatic segmentation of the spinal cord from magnetic resonance images: application in multiple sclerosis. NeuroImage 2010;50:446-455.Figures
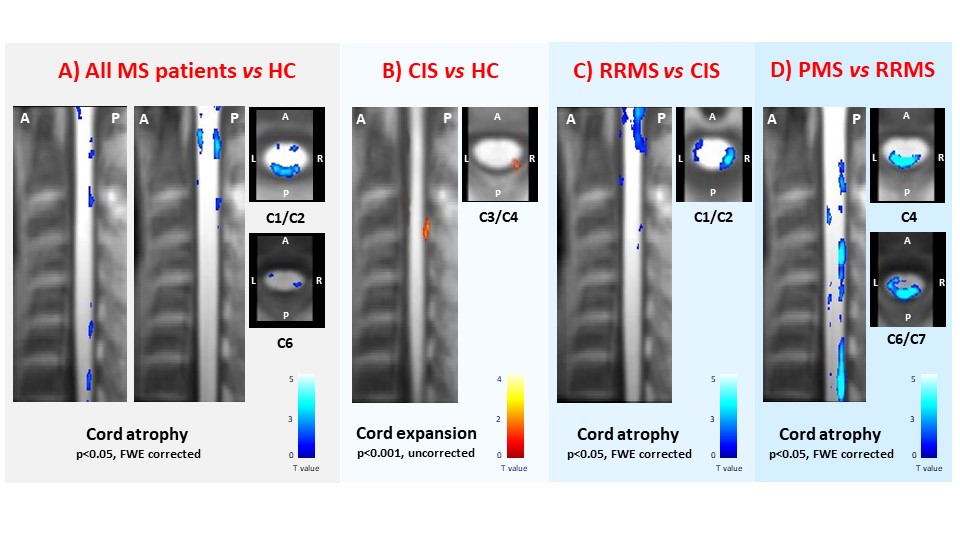
Figure 1. Sagittal and axial views at
various cervical cord levels showing clusters of significant cord atrophy
differences (color-coded for t-values, p<0.001 for display purposes) in: A)
multiple sclerosis (MS) patients, considered as a whole, vs healthy controls (HC); B) clinically isolated syndrome (CIS)
patients vs HC; C)
relapsing-remitting (RR) MS vs CIS
patients; and D) progressive (P) MS vs
RRMS patients. Abbreviations: L=left; R=right; A=anterior; P=posterior.
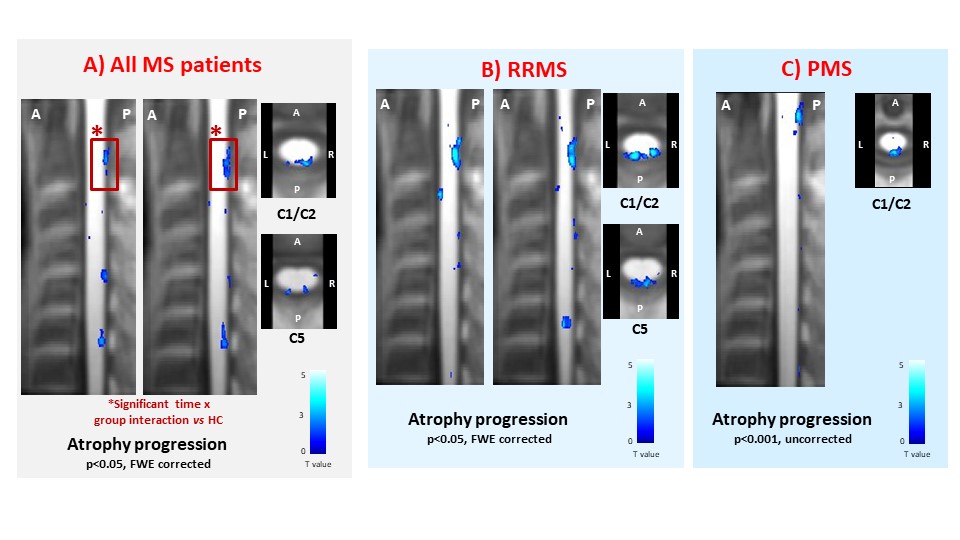
Figure 2. Sagittal and axial views at
various cervical cord levels showing clusters of significant cord atrophy progression
at 1-year follow-up (color-coded for t-values, p<0.001 for display purposes)
in: A) multiple sclerosis (MS) patients, considered as a whole; B)
relapsing-remitting (RR) MS patients; and C) progressive (P) MS patients. Red
boxes indicate clusters of cord atrophy progression significant at the time x group interaction vs HC. Abbreviations: L=left; R=right; A=anterior; P=posterior.