3443
3D-MP2RAGE T1 mapping to characterize regional cervical spinal cord impairments in ALS and MS patients.1Aix-Marseille Univ, CNRS, CRMBM, Marseille, France, 2APHM, Hôpital Universitaire Timone, CEMEREM, Marseille, France, 3APHM, Hôpital Universitaire Timone, Neurology Department, Marseille, France, 4Departement of Research and Innovation, Olea Medical, La Ciotat, France, 5. APHM, Hôpital Universitaire Timone, Neurology Department, Marseille, France, 6APHM, Hôpital Universitaire Timone, Reference Center for Neuromuscular Disorders and ALS, Marseille, France
Synopsis
The MP2RAGE sequence has never been applied for T1 quantification in the context of neurodegenerative spinal cord pathologies. In this study, the technique demonstrated good discrimination between WM and GM in healthy controls, better detection of cervical lesions in Multiple Sclerosis patients, and increased T1 values in corticospinal tracts of both Amyotrophic Lateral Sclerosis patients and MS patients , and lateral sensory tracts of MS patients. Very robust and compatible with clinical scan time, the MP2RAGE may be a technique of choice for longitudinal studies.
INTRODUCTION
The 3D-MP2RAGE sequence has recently demonstrated an ability for improved cervical cord lesion detection in multiple sclerosis (MS)1-2, however, it has never been applied for T1 quantification in the context of neurodegenerative spinal cord pathologies. In this study, the interest of the technique was evaluated in terms of cord atrophy measurements, regional structural changes and potential specificity with regards to the pathology (MS and ALS impairments).MATERIAL AND METHOD
Subjects: 30 MS patients (27RR/ 3SP, mean age=35±11yo.), 15 ALS patients (mean age=57±13), and aged-matched healthy controls (HC) (nHC_MS=23 for the MS cohort and nHC_ALS=10 for the ALS) participated to the study. Clinical scoring included the Expanded Disability Status Scale (EDSS) for the MS patients, and ALS Functional Rating Scale (ALSFRS) and disease progression rate (DPR=(48-ALSFRS)/ disease duration) for the ALS cohort.MR protocol: Acquisitions were performed on a 3T system at the cervical level. The 3D MP2RAGE parameters were set according to Rasoanandrianina & al.1, (spatial resolution 0.9*0.9*1 mm3; TI1/TI2/TR=650/2000/4000ms, α1/α2=4/5). A B1+ map (5-mm isotropic) was also acquired to correct for potential B1+-bias.
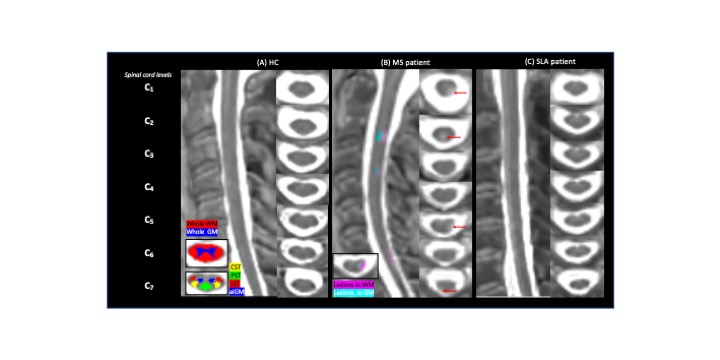
Data analysis: Data processing is summarized in Fig.1. WM ROI was eroded to avoid CSF contamination. Anterior WM was not considered for quantification due to partial volume effect. Lesion were manually segmented and clinical scoring evaluated by a clinician. Statistical analyses were performed using JMP9. P-values<0.05 were considered as statistically significant. T1 differences according to cervical levels, ROIs and age were first investigated considering the entire healthy population (n=27) using a MANOVA analysis followed by a Steel-Dwass all-pair test corrected for multiple comparisons. Then, T1 and CSA differences between ALS patients (n=15) and HC_ALS (n=10) first, and between MS patients (n=30) and HC_MS (n=23) then, were evaluated. Lesion and normal appearing (NA) WM/GM were considered separately. Correlations between T1/CSA metrics and clinical scoring were evaluated using a Spearman rank test. In the perspective of identifying preferred sites of disease expression in each patient cohort, averaged T1 maps were finally generated in the PAM50 space3 using FSL4. For the MS patients, T1 values in lesion ROIs were replaced (~lesion filling) by the mean T1 of the NA tissue at the same level, so as to give a representation of global NA T1 impairment. Lesion distribution map was generated as well.
RESULTS AND DISCUSSION
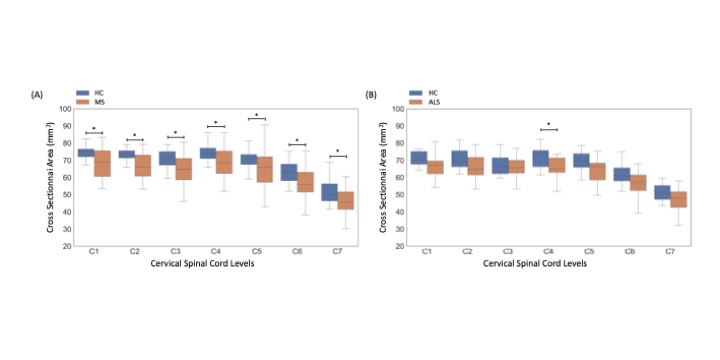
Fig.2 shows individual T1-MP2RAGE maps obtained on HC (2A), MS (2B) and ALS (2C) and the selected ROIs. T1 analysis performed on HC showed no age effects on metrics, no variation across levels and a good discrimination (p<.0001) between whole WM (902±23ms) and whole aiGM (GM= 939±21ms).When comparing metrics between MS patients and HC_MS, T1 values were systematically found higher for MS patients in both lesions (LEWM=1174±134ms /LEGM=1114±80ms; p<.00001) and NA tissues (NAWM= 969±64/NAGM=970±47ms; p=0.006). T1 differences were statistically significant in all ROIs (=0.006) and impairments were more particularly marked in NAaiGM in the upper cervical levels and in the whole WM, especially in CST/LST (p<0.0001), in line with recent literature5 demonstrating preferential lesion-induced damage in the lateral funiculi and GM in relapsing-remitting MS (93% of our MS patients). CSA in MS were statistically lower than HC for all levels (atrophy more pronounced in upper cervical spinal cord: p<.0001 compared to lower levels p<.0004) (Fig.3A), in line with the literature6-7. T1-MP2RAGE values were also highly correlated to EDSS for both NAWM (p=.0003) and NAaiGM (p=.0352).
On average, when considering T1 values in ALS patients compared to HC_ALS, no differences were observed in LST and aiGM whereas statistical differences were noticed in PST (p=.0489) and CST (p=.006), in agreement with regional impairments previously reported using DTI or MT8-10. Mean cord CSA were found lower at all levels, but without reaching significance, except in C4 (Fig.3B). Significant correlation between T1 values and ALSFRS was found only for aiGM which is consistent with the destruction of motor neurons. No correlation with DPR was observed.
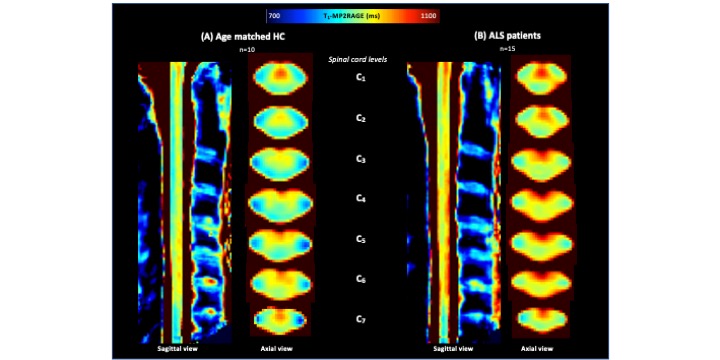
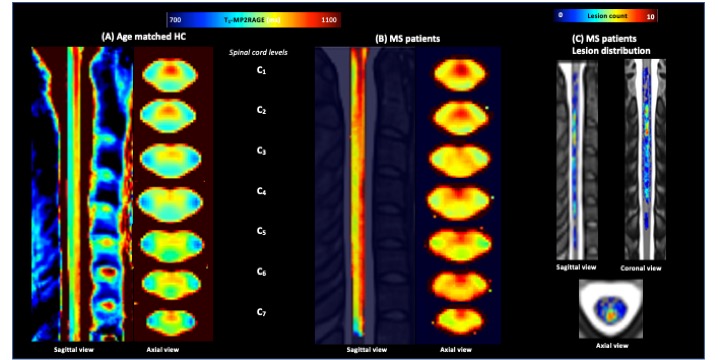
Fig.4 shows mean T1-MP2RAGE maps in the PAM50 space for HC_ALS (4A) and ALS patients (4B) with higher signal in CST and PST. Fig.5 shows HC_MS (5A) and MS patients (5B), together with the lesion distribution map (5C). A diffuse impairment could be noticed in both cohorts. The lesion distribution was more pronounced in the PST and in upper levels (C1-C3), in agreement with literature 11-12.
CONCLUSION
In this work, the MP2RAGE sequence was used for the first time in the context of neurodegenerative spinal cord pathologies.With a sub-millimetric spatial resolution, T1 quantification in the major WM tracts and aiGM could be performed (T1 measurements in anterior WM and posterior GM would require to move to higher field strength13). The good discrimination between WM and GM, the finding of increased T1-MP2RAGE in the motor tracts of ALS patients and posterior sensory tract in MS patients, gave further evidence for the potential of MP2RAGE sequence in neurodegenerative disease diagnostics. With a previously reported reproducibility of 5%1, an acquisition time of < 10min, no discard data rate, an improved lesion detection2, the MP2RAGE may be a technique of choice for clinical studies. Short-term perspectives include characterization of the sensitivity to temporal changes, comparison to conventional techniques, semi-automatic lesion segmentation and multi-centric studies.Acknowledgements
ARSEP and Thierry Latran foundationReferences
[1] Rasoanandrianina H, Massire A, Taso M, Guye M, Ranjeva J-P, Kober T, et al. Regional T1 mapping of the whole cervical spinal cord using an optimized MP2RAGE sequence. NMR Biomed 2019;32:e4142. https://doi.org/10.1002/nbm.4142 SMASH.
[2] Demortière S, Lehmann P, Pelletier J, Audoin B, Callot V. Improved Cervical Cord Lesion Detection with 3D-MP2RAGE Sequence in Patients with Multiple Sclerosis. Am J Neuroradiol 2020;41:1131–4. https://doi.org/10.3174/ajnr.A6567 SMASH.
[3] De Leener B, Fonov VS, Collins DL, Callot V, Stikov N, Cohen-Adad J. PAM50: Unbiased multimodal template of the brainstem and spinal cord aligned with the ICBM152 space. NeuroImage 2018;165:170–9. https://doi.org/10.1016/j.neuroimage.2017.10.041 SMASH.
[4] Smith SM, Jenkinson M, Woolrich MW, Beckmann CF, Behrens TEJ, Johansen-Berg H, et al. Advances in functional and structural MR image analysis and implementation as FSL. NeuroImage 2004;23:S208–19. https://doi.org/10.1016/j.neuroimage.2004.07.051 SMASH.
[5] Bonacchi R, Pagani E, Meani A, Cacciaguerra L, Preziosa P, De Meo E, et al. Clinical Relevance of Multiparametric MRI Assessment of Cervical Cord Damage in Multiple Sclerosis. Radiology 2020;296:605–15. https://doi.org/10.1148/radiol.2020200430 SMASH.
[6] Casserly C, Seyman EE, Alcaide-Leon P, Guenette M, Lyons C, Sankar S, et al. Spinal Cord Atrophy in Multiple Sclerosis: A Systematic Review and Meta-Analysis: Spinal Cord Atrophy in Multiple Sclerosis: Systematic Review. J Neuroimaging 2018;28:556–86. https://doi.org/10.1111/jon.12553 SMASH.
[7] DeLuca GC. Axonal loss in multiple sclerosis: a pathological survey of the corticospinal and sensory tracts. Brain 2004;127:1009–18. https://doi.org/10.1093/brain/awh118 SMASH.
[8] El Mendili M-M, Cohen-Adad J, Pelegrini-Issac M, Rossignol S, Morizot-Koutlidis R, Marchand-Pauvert V, et al. Multi-Parametric Spinal Cord MRI as Potential Progression Marker in Amyotrophic Lateral Sclerosis. PLoS ONE 2014;9:e95516. https://doi.org/10.1371/journal.pone.0095516 SMASH.
[9] Wang S, Poptani H, Bilello M, Wu X, Woo JH, Elman LB, et al. Diffusion tensor imaging in amyotrophic lateral sclerosis: volumetric analysis of the corticospinal tract. AJNR Am J Neuroradiol 2006;27:1234–8.
[10] Patzig M, Bochmann K, Lutz J, Stahl R, Küpper C, Liebig T, et al. Measurement of structural integrity of the spinal cord in patients with amyotrophic lateral sclerosis using diffusion tensor magnetic resonance imaging. PLOS ONE 2019;14:e0224078. https://doi.org/10.1371/journal.pone.0224078 SMASH.
[11] Eden D, Gros C, Badji A, Dupont SM, De Leener B, Maranzano J, et al. Spatial distribution of multiple sclerosis lesions in the cervical spinal cord. Brain 2019;142:633–46. https://doi.org/10.1093/brain/awy352 SMASH.
[12] Valsasina P, Aboulwafa M, Preziosa P, Messina R, Falini A, Comi G, et al. Cervical Cord T1-weighted Hypointense Lesions at MR Imaging in Multiple Sclerosis: Relationship to Cord Atrophy and Disability. Radiology 2018;288:234–44. https://doi.org/10.1148/radiol.2018172311 SMASH.
[13] Massire A, Rasoanandrianina H, Guye M, Callot V. Anterior fissure, central canal, posterior septum and more: New insights into the cervical spinal cord gray and white matter regional organization using T1 mapping at 7T. NeuroImage 2020;205:116275. https://doi.org/10.1016/j.neuroimage.2019.116275 SMASH.
[14] MATLAB. version 9.4.0 (R2018a). Natick, Massachusetts: The MathWorks Inc.; 2018.
[15] De Leener B, Lévy S, Dupont SM, Fonov VS, Stikov N, Louis Collins D, et al. SCT: Spinal Cord Toolbox, an open-source software for processing spinal cord MRI data. NeuroImage 2017;145:24–43. https://doi.org/10.1016/j.neuroimage.2016.10.009 SMASH.
Figures
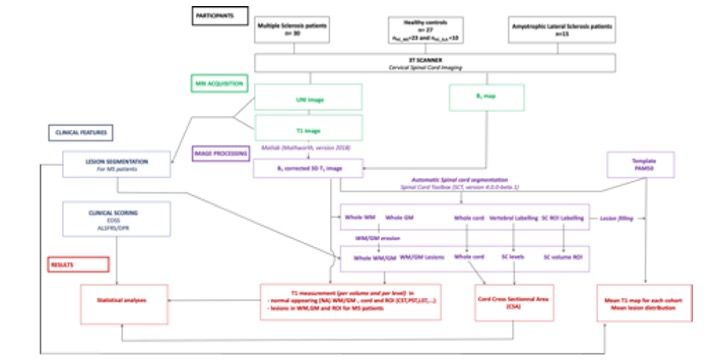
Fig.1: Study design and postprocessing pipeline. B1-corrected T1 maps were generated using Matlab14. Spinal cord segmentation and WM/GM parcellation were performed using the Spinal Cord Toolbox15 . Cord cross sectional area measurements was obtained for each subject and cervical spinal cord level (C1-C7). Analysis of the quantitative T1 dataset focused on largest SC ROI, including whole white matter (WM), anterior and intermediate gray matter (aiGM), posterior and lateral sensory tracts (PST/LST); as well as lateral corticospinal tracts (CST).