3442
Neurometabolic Analysis in Amyotrophic Lateral Sclerosis: A 1H-[13C]-NMR investigation1NMR Microimaging and Spectroscopy Facility, Centre for Cellular and Molecular Biology, Hyderabad, India
Synopsis
In this study we have evaluated the neurometabolic activity of a transgenic (SOD1G37R) mouse model of ALS by 1H-[13C]-NMR spectroscopy together with an infusion of 13C labeled substrates (glucose/acetate). Reduced motor performance and abnormal gait were observed in 18-month old male SOD1G37R mice. The glutamatergic and GABAergic neurometabolic rates were decreased, while astroglial metabolic flux was increased in the spinal cord of the SOD1G37R mice. In contrast, neuronal and astroglial metabolic activities were increased in the cerebral cortex of these mice.
Introduction
Amyotrophic lateral sclerosis (ALS) is the most common adult-onset motor neuron disorder, characterized by progressive death of upper and lower motor neurons of the brain and spinal cord1. The most common symptoms of ALS include muscle weakness, cramping, and paralysis, which eventually lead to death due to respiratory failure within 3-5 years of disease onset2. Only 5-10% of ALS cases are inherited (familial ALS), out of which 20% of patients have a mutation in the Cu/Zn superoxide dismutase (SOD1) gene3. SOD1G37R is a mouse model of ALS, which exhibits late onset and slow progression rate for the disease4. The objective of this study is to quantitatively evaluate the neurochemical homeostasis and neurometabolism in the brain and spinal cord of the SOD1G37R mice.Materials and Methods
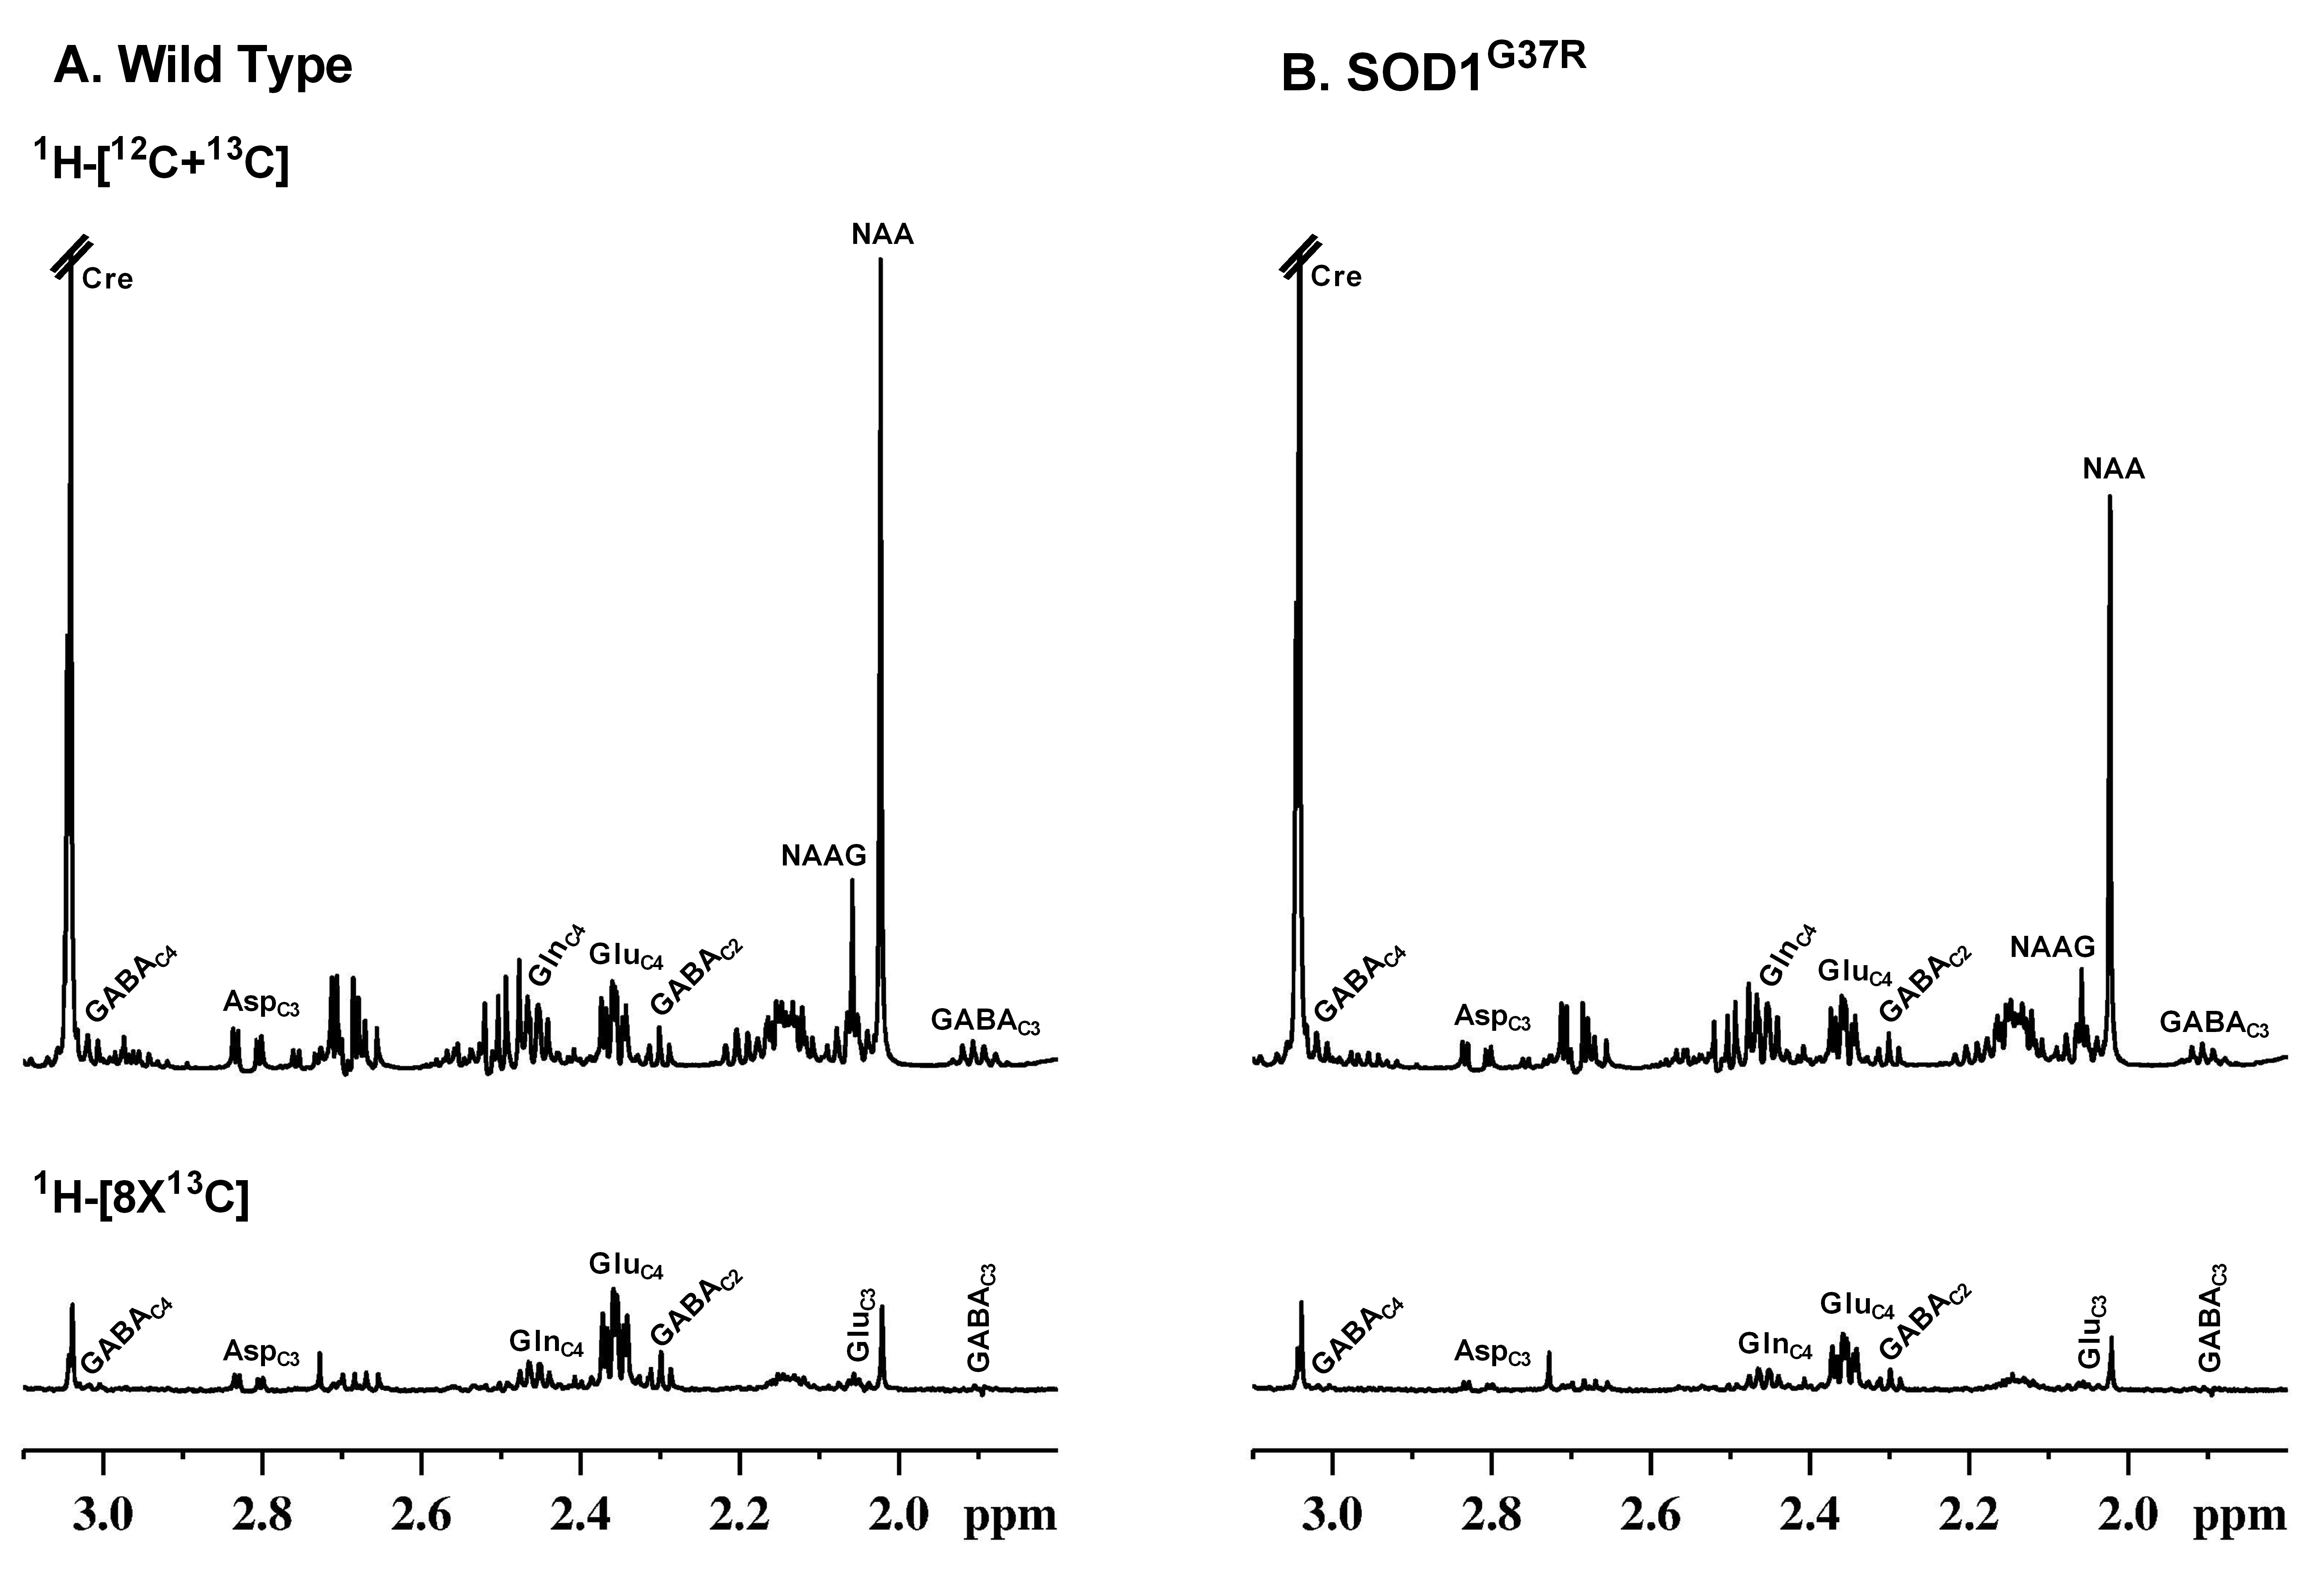
All animal experiments were performed under protocols approved by the Institutional Animal Ethics Committee of CCMB. Male 18-month-old SOD1G37R (n=10) and wild type (n=10) mice were used for this study. The forelimb strength of mice was measured using paw grip strength meter5. Additionally, the neurological scores of these mice were assessed6. For metabolic measurement, mice were kept on fasting for 4 hours. Mice were then anesthetized using urethane (1.5 g/kg, i.p.) and infused with [1,6-13C2]glucose or [2-13C]acetate through the tail vein using bolus variable infusion rates for 10 and 15 minutes respectively. Blood was collected from the retro-orbital sinus and brain metabolism was arrested by freezing the animals in liquid Nitrogen at the predefined time. The cerebral cortex and spinal cord were dissected in a cryostat and stored at -80°C. Metabolites were extracted from the frozen cortical and spinal cord tissue. The concentration and 13C labeling of amino acids were measured in 1H-[13C]-NMR spectra of tissue extracts recorded at 600 MHz Bruker Avance HD III NMR spectrometer7. The cerebral metabolic rate of glucose oxidation (CMRGlc(Ox)) by glutamatergic and GABAergic neurons and rate of acetate oxidation (CMRAce(Ox)) was determined from the 13C labeling of amino acids from [1,6-13C2]glucose and [2-13C]acetate, respectively8. The statistical significance of the difference in various parameters between SOD1G37R and wild type mice was carried out using the Student t-test. All the data are presented as the Mean±SD.Results
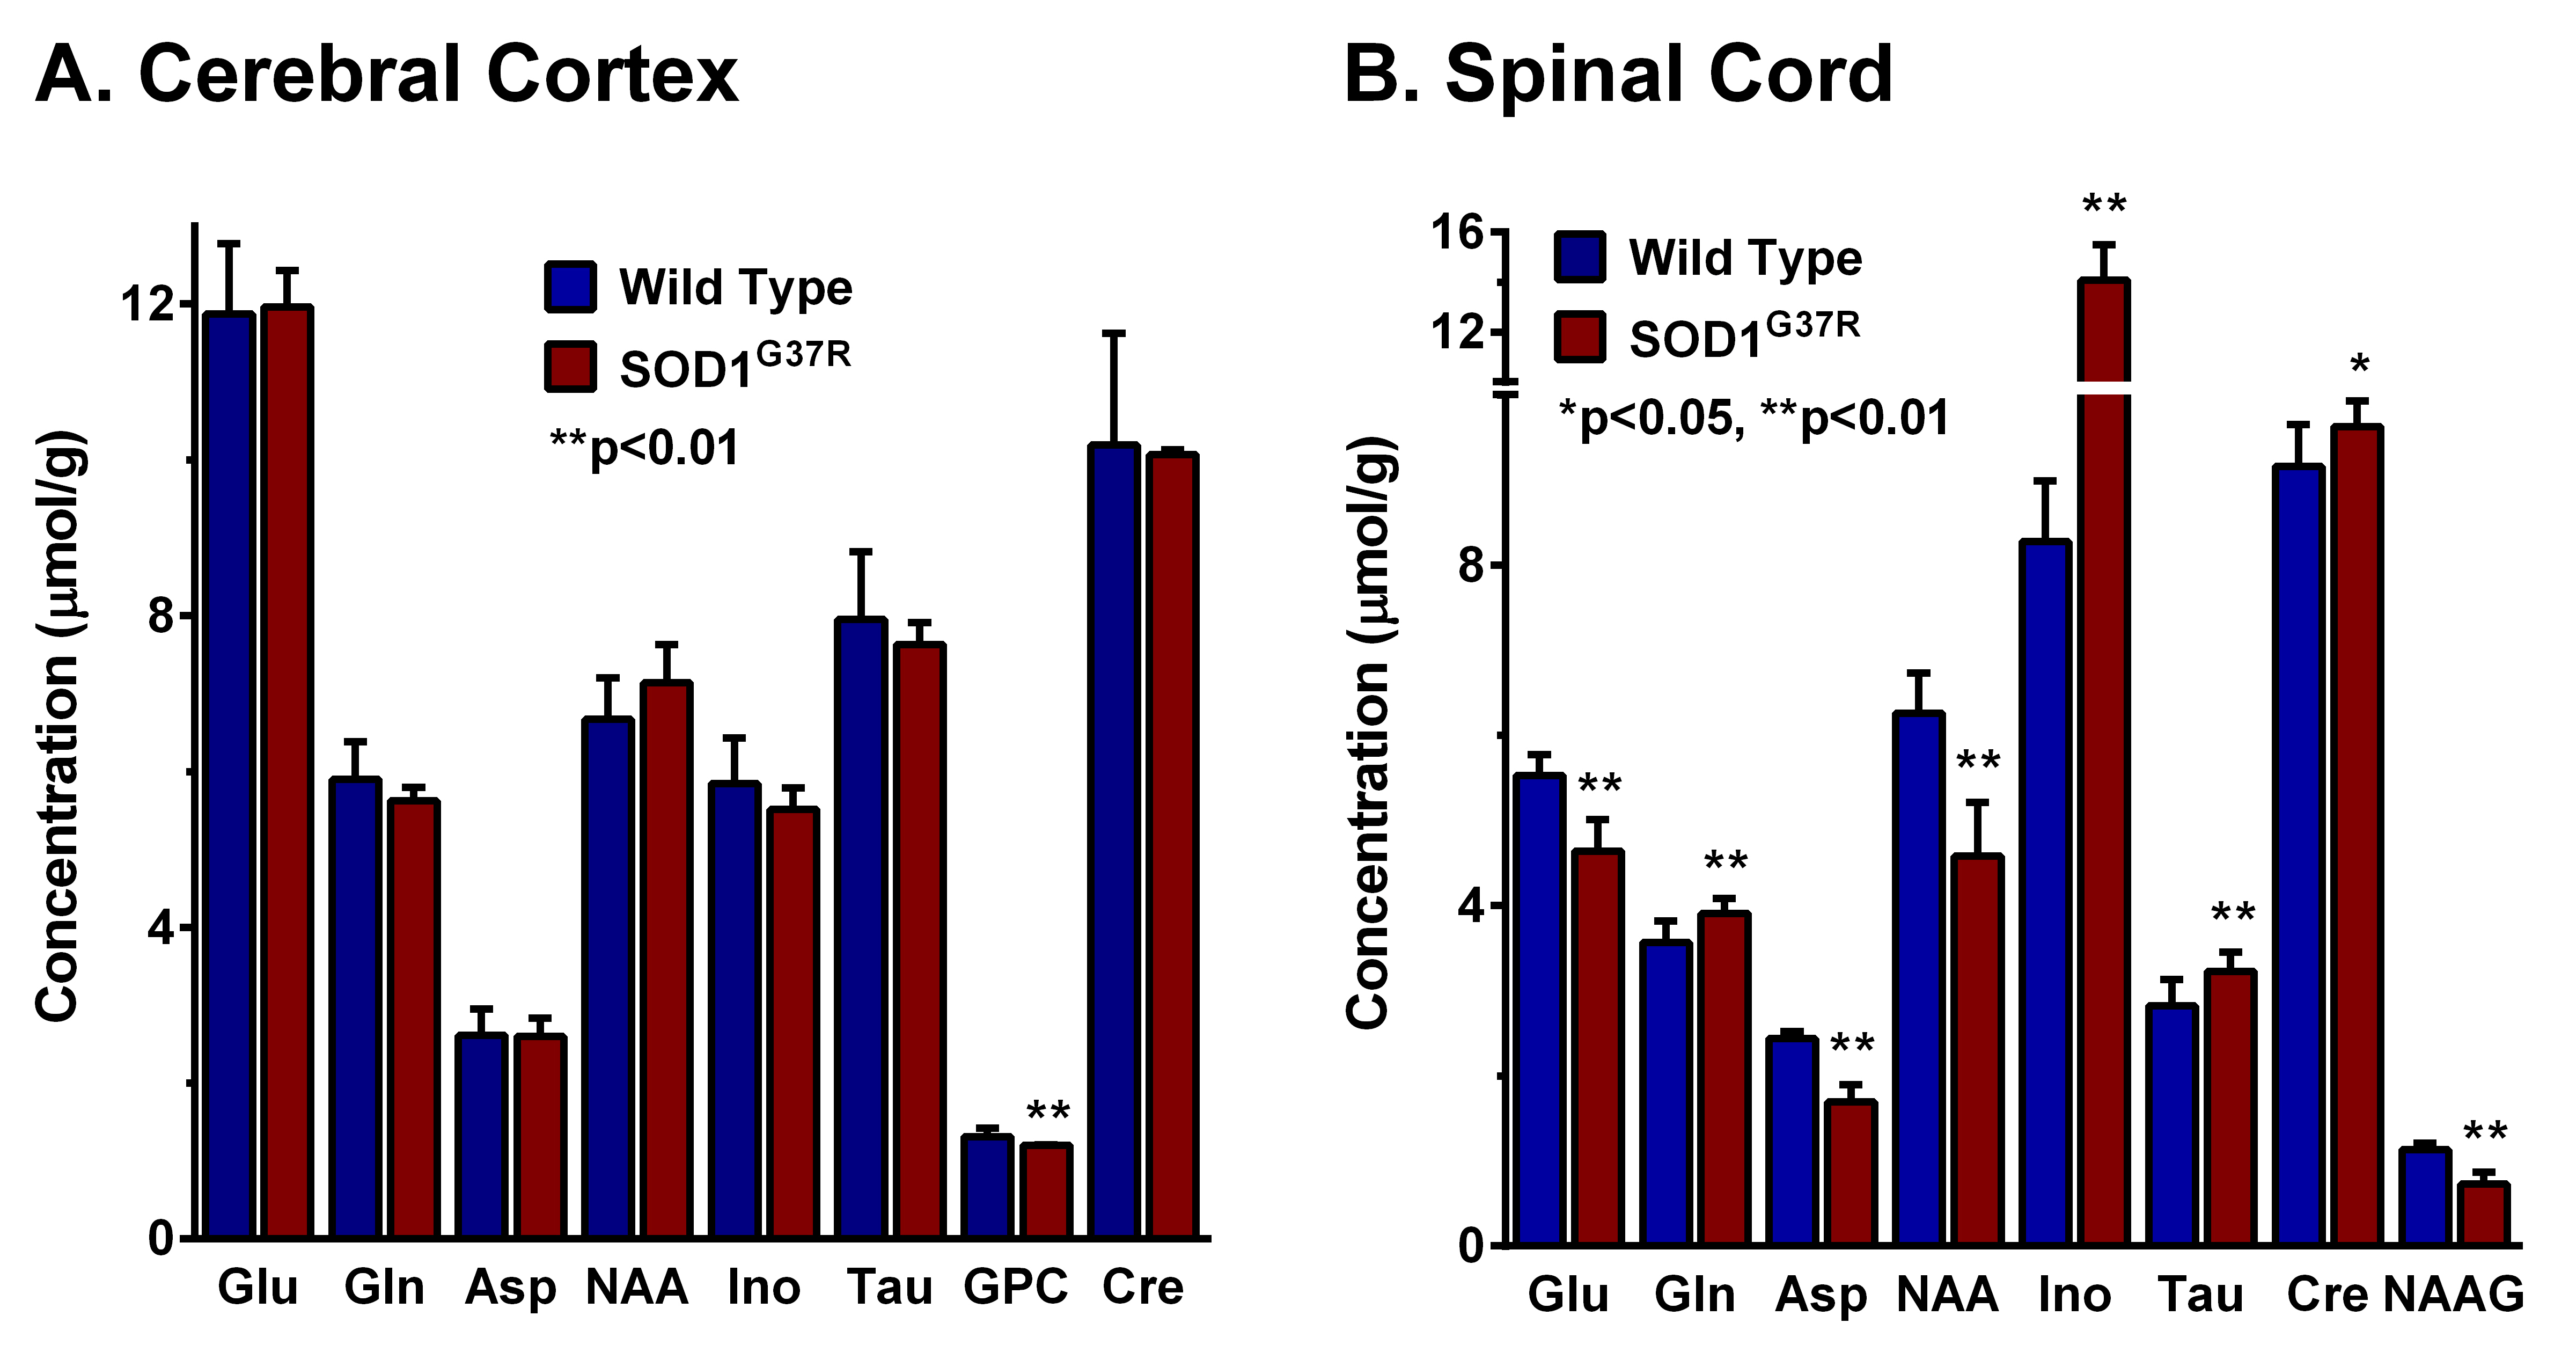
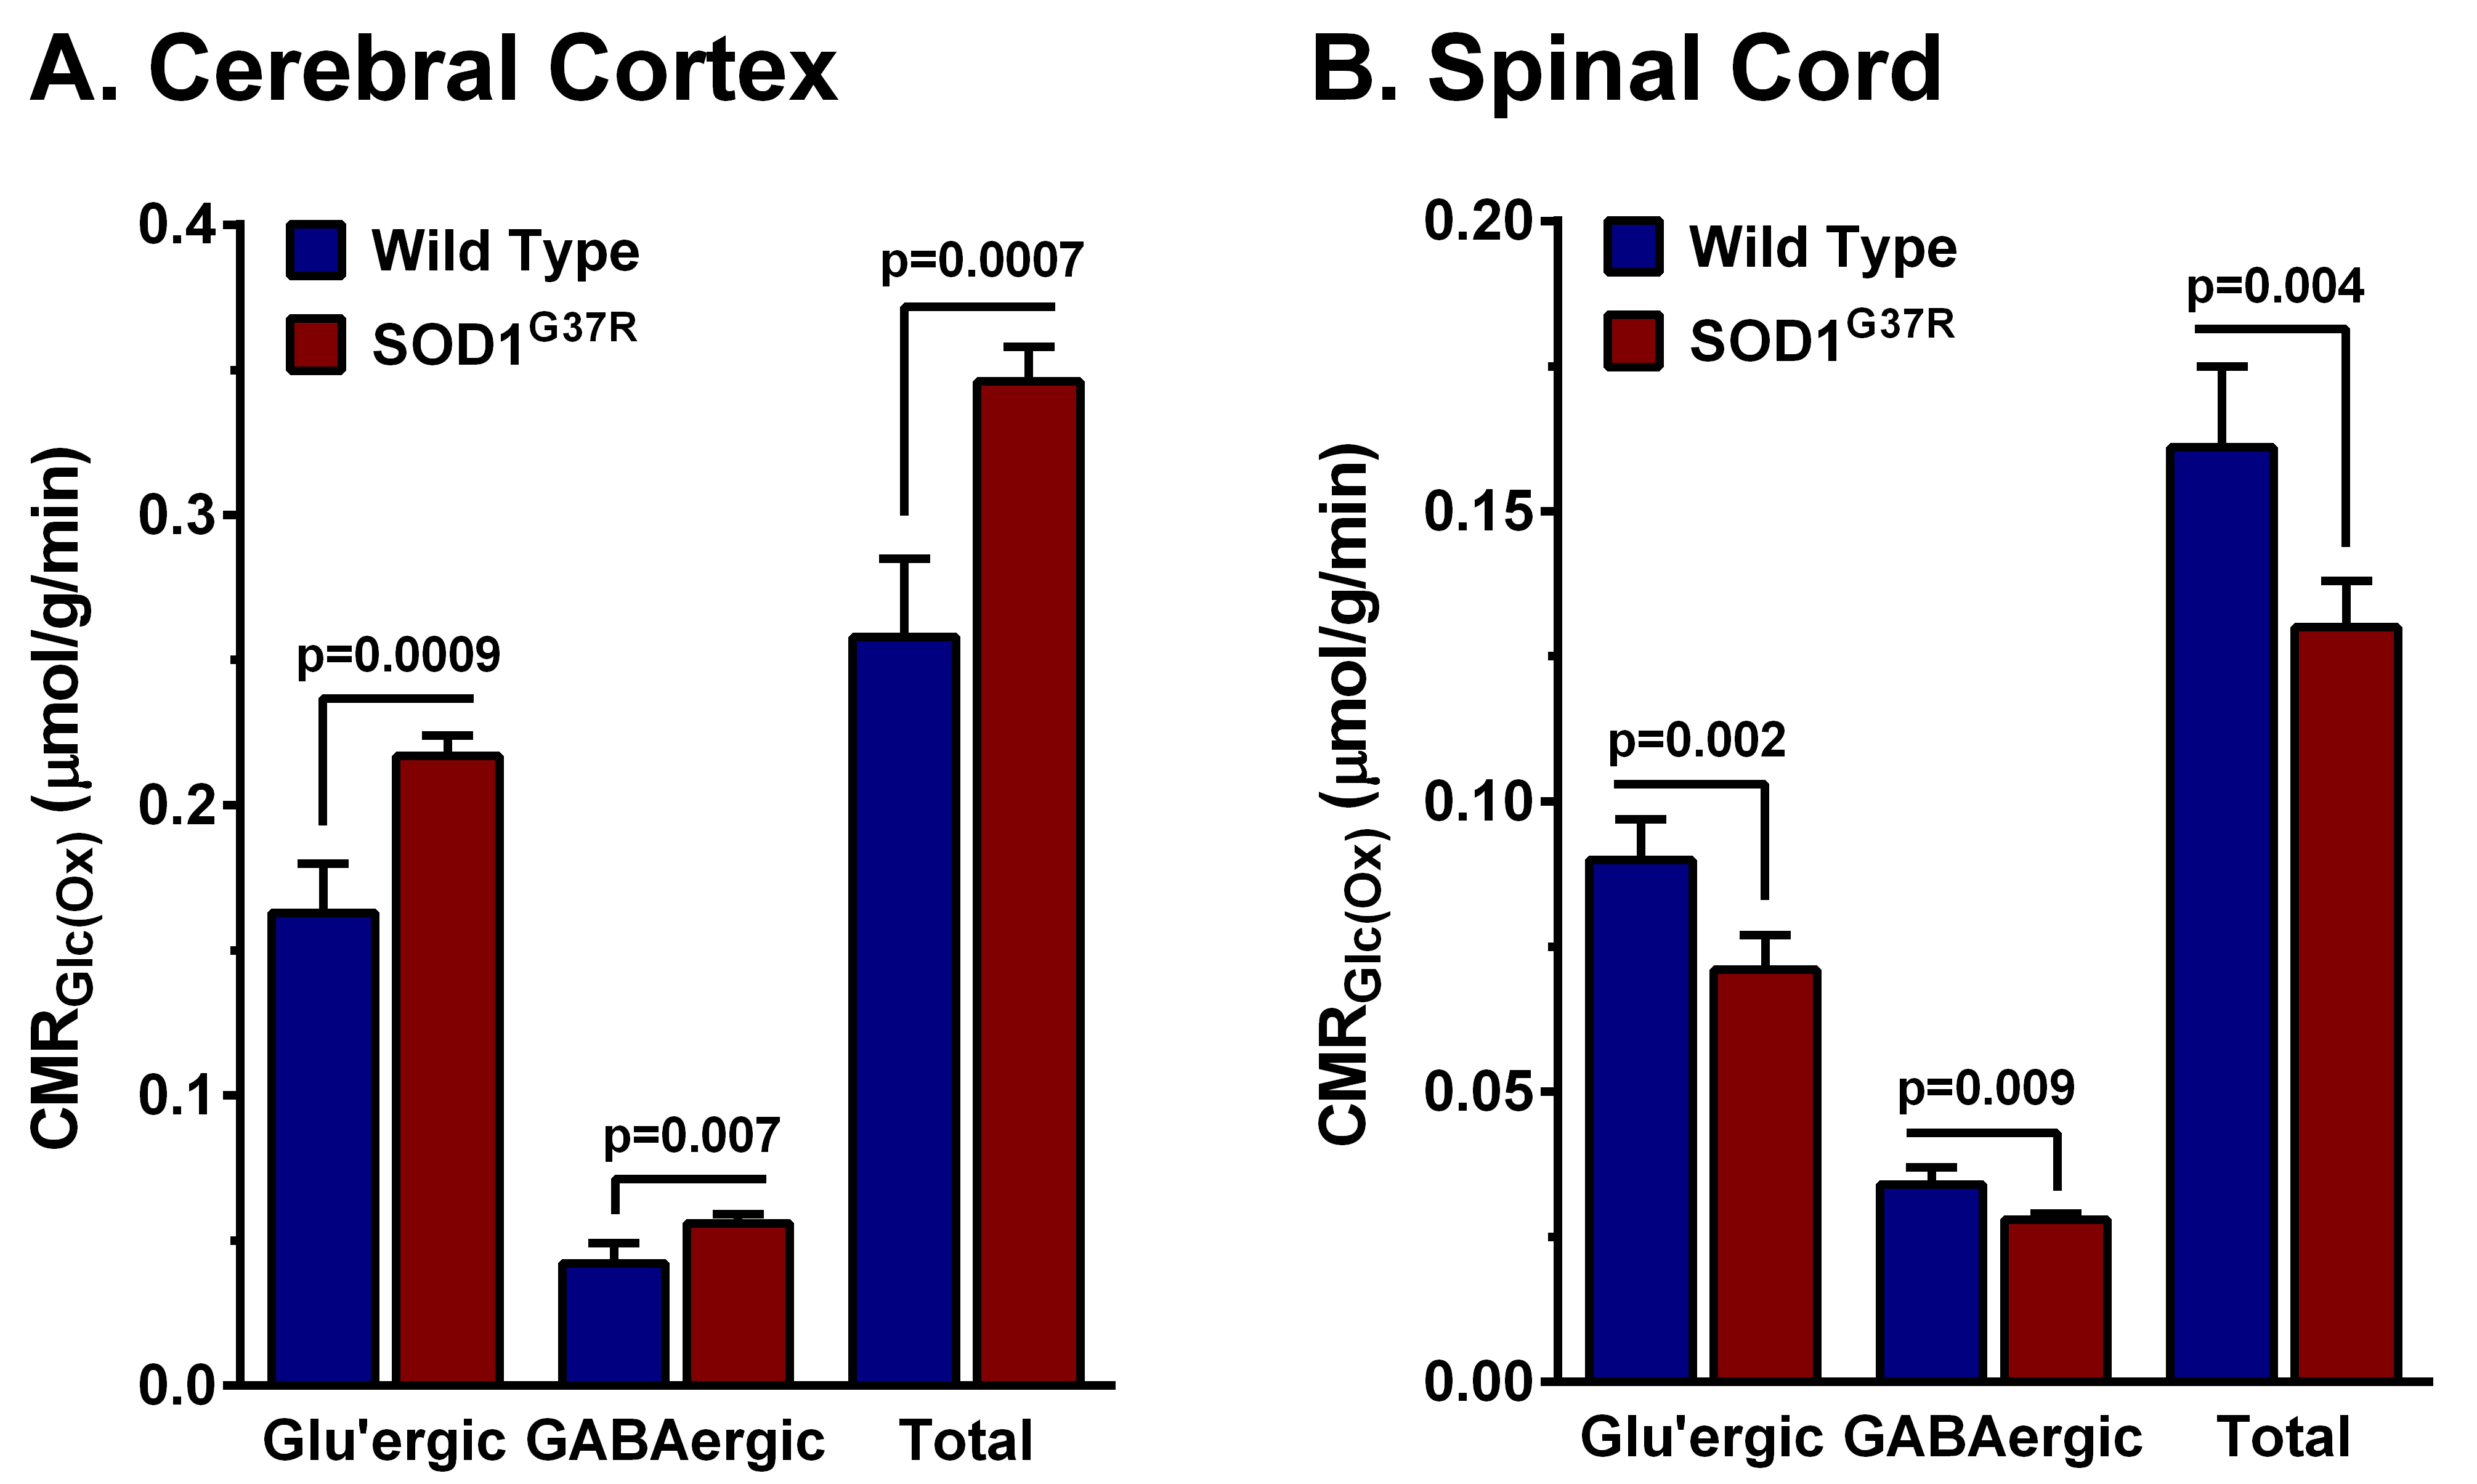
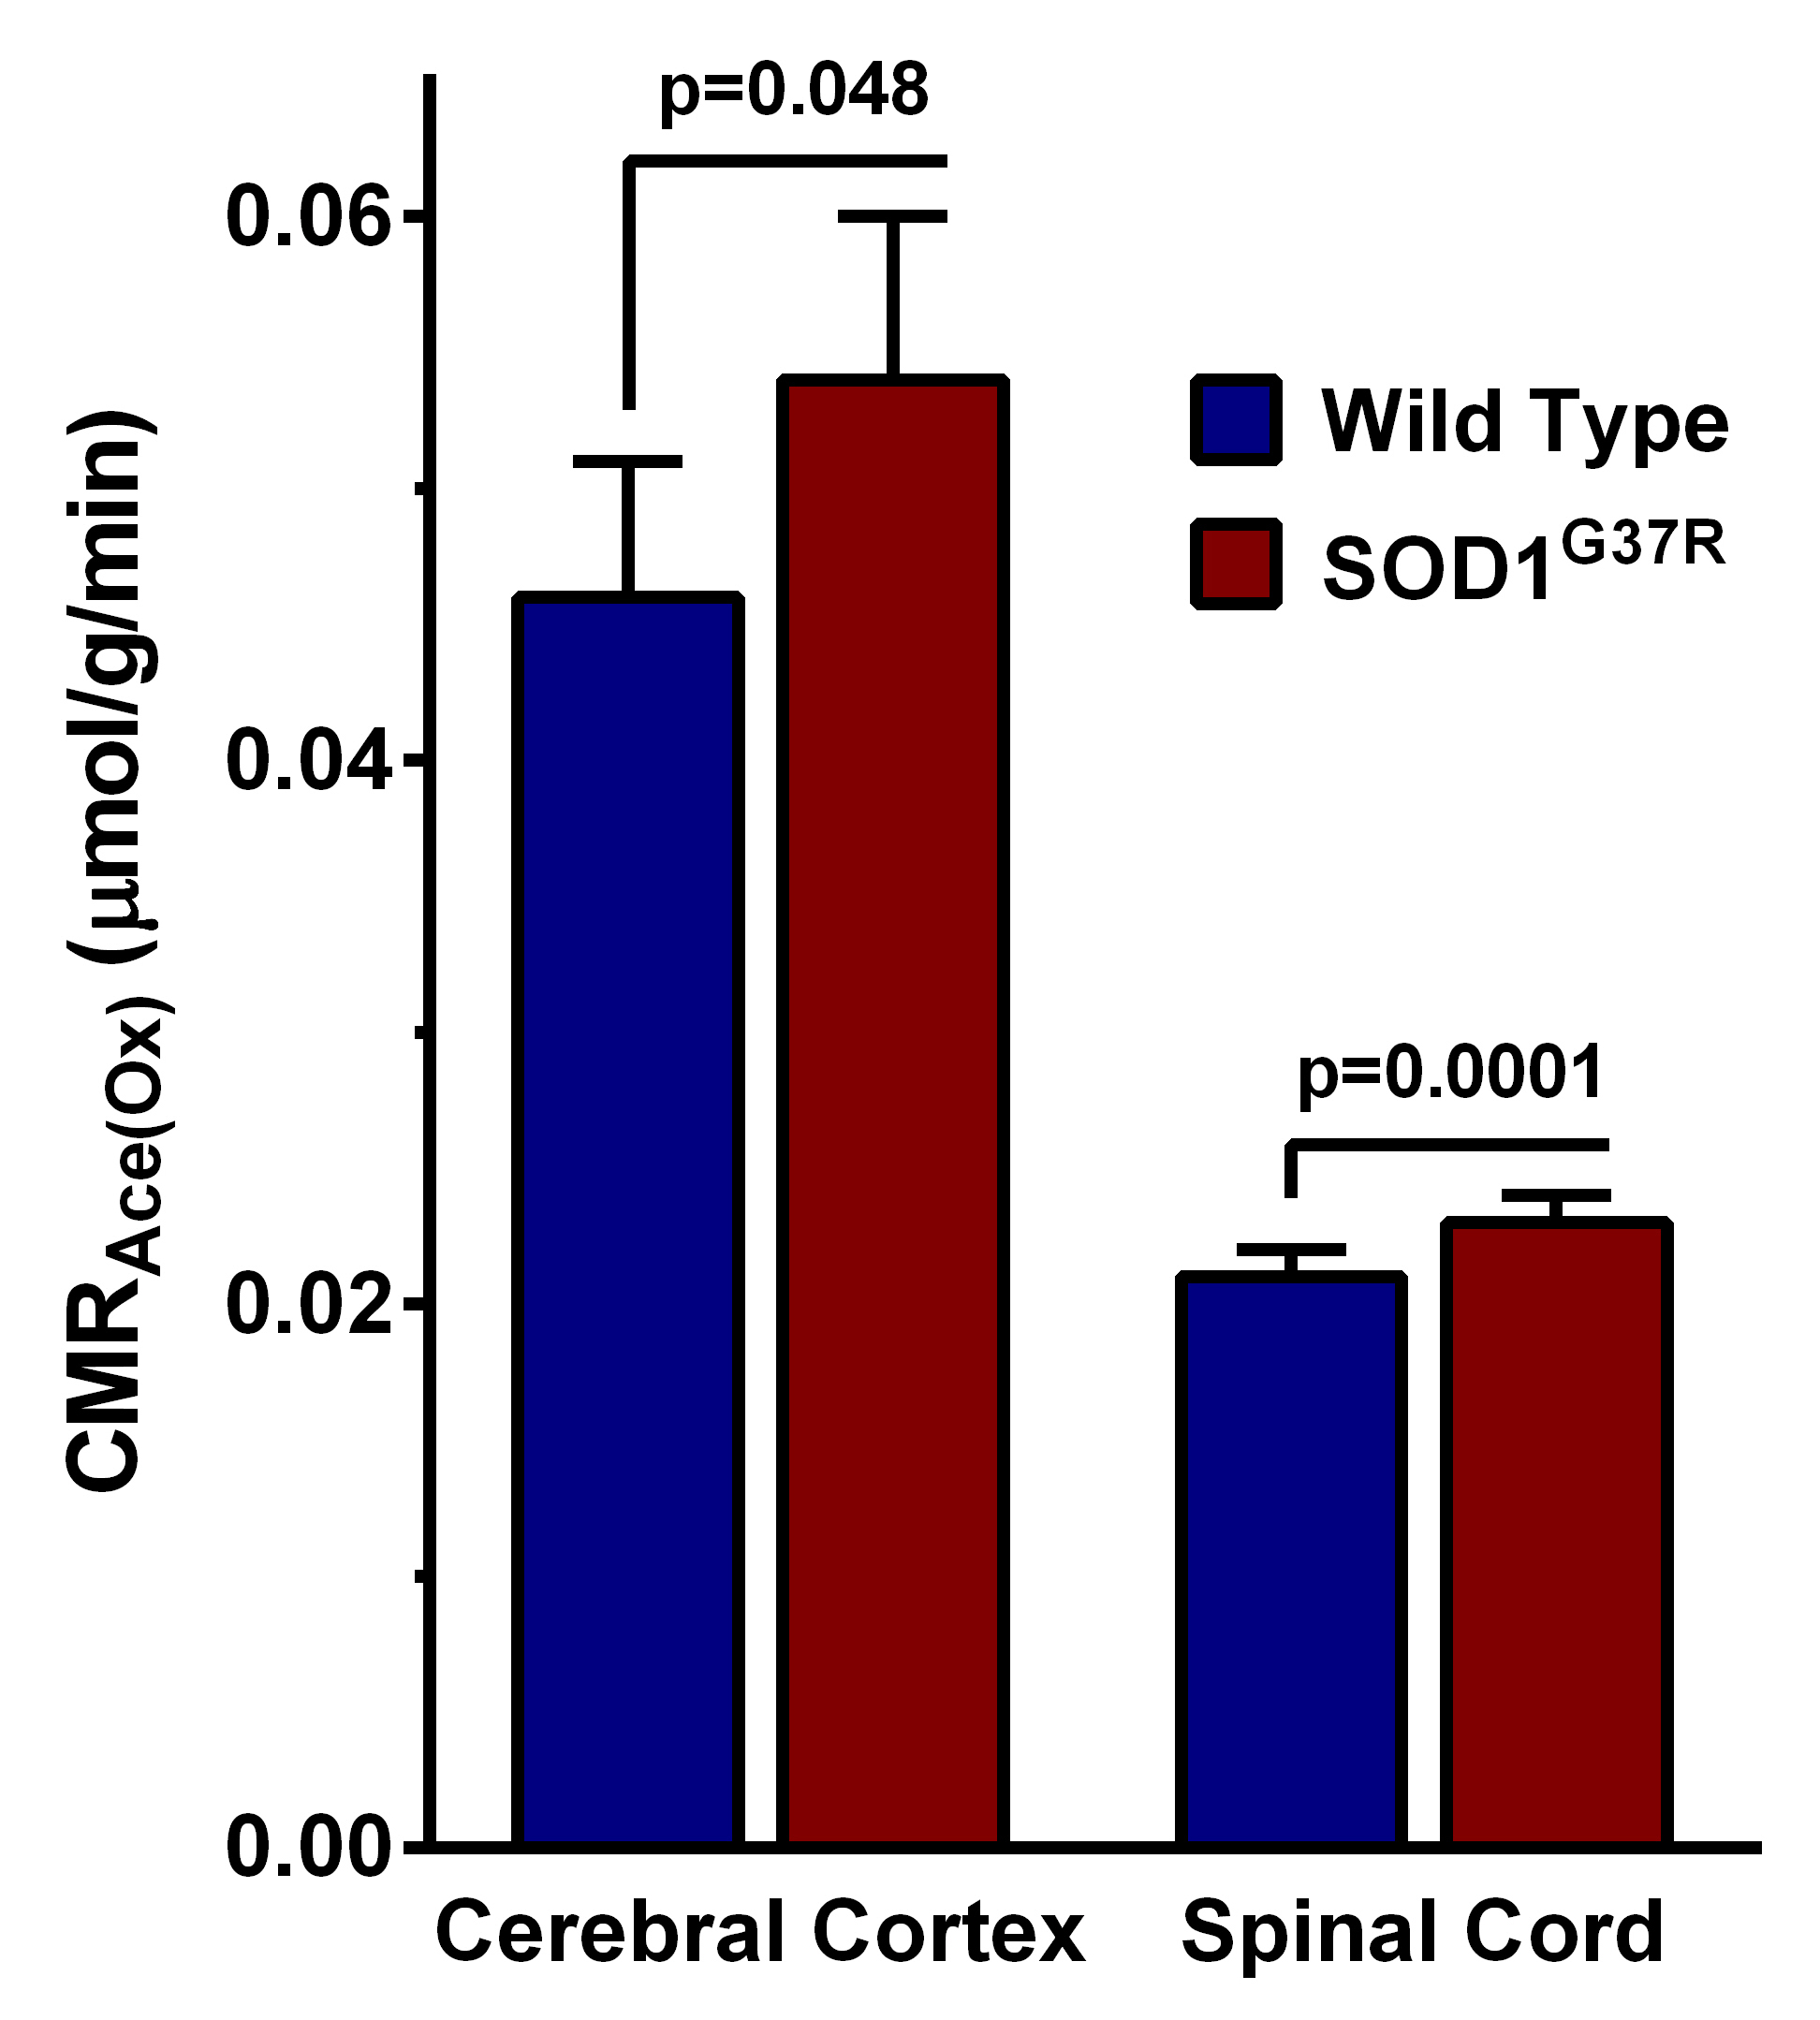
The forelimb strength of SOD1G37R mice (0.69±0.03 N) was significantly (p=0.001) reduced (-35 %) when compared with the controls (1.07±0.02 N) suggesting an impaired motor function in these animals. Moreover, these mice showed higher neurological scores (3.25±0.46) when compared with controls (0). The levels of glutamate (p=0.00001), aspartate (p=0.000001), NAA (p=0.000004), and NAAG (p=0.000001) were decreased, whereas levels of myo-inositol (p=0.000001), glutamine (p= 0.003), taurine (p=0.003), and creatine (p=0.02) were increased in the spinal cord (Fig. 2). The cerebral cortex exhibited a reduction in the level of choline (p=0.014) (Fig. 2). The concentrations of 13C labeled GluC4 (p=0.0009), GABAC2 (p=0.012) and AspC3 (p=0.009) from [1,6-13C2]glucose were decreased significantly in the spinal cord of SOD1G37R mice. This resulted in a significant decrease in the CMRGlc(Ox) of glutamatergic (0.090±0.007 to 0.071±0.006 micromole/g/min, p=0.002) and GABAergic (0.034±0.003 to 0.028±0.001 micromole/g/min, p=0.009) neurons in the spinal cord (Fig. 3). In contrast, amino acids labeling from [1,6-13C2]glucose were increased significantly (p<0.001) in the cerebral cortex of SOD1G37R mice. Consequently, the CMRGlc(Ox) associated with glutamatergic (0.163±0.017 to 0.217±0.007 micromole/g/min, p=0.0009) and GABAergic (0.042±0.007 to 0.056±0.003 micromole/g/min, p=0.007) neurons were increased in the cerebral cortex (Fig. 3). 13C Label accumulated at GlnC4 (p=0.02), GluC4 (p=0.0009), and GluC3 (p=0.048) from [2-13C]acetate was increased in the spinal cord of SOD1G37R mice, which resulted in an increased CMRAce(Ox) in the spinal cord (Fig. 4). Similarly, an increase in the CMRAce(Ox) has been found in the cerebral cortex of SOD1G37R mice (Fig. 4).Discussions
Our analysis indicates that SOD1G37R mice exhibit a loss in motor performance, which is a characteristic of ALS. The decrease in levels of glutamate and aspartate together with reduced NAA level suggest degeneration of excitatory neurons in the spinal cord. The finding of increased myo-inositol in the spinal cord is suggestive of an increased inflammatory condition in SOD1G37R mice, which is further supported by an increase in the rate of acetate oxidation in the spinal cord. The finding of reduced glucose oxidation of glutamatergic and GABAergic neurons in SOD1G37R mice is suggestive of a decrease in the excitatory and inhibitory activity in the spinal cord. Interestingly, these mice exhibit the increased neurometabolic activity of GABAergic and glutamatergic neurons in the cerebral cortex. Additionally, increased inflammation was also seen in the cerebral cortex. Our findings suggest innervations of excitatory motor neurons of the cerebral cortex into the spinal cord may be a plausible mechanism of degeneration of neurons in the spinal cord.Acknowledgements
This study is supported by funding from DST (DST/CSRI/2017/258), Government of India.
References
1. Rowland LP, Shneider NA. Amyotrophic lateral sclerosis. N Engl J Med. 2001;344:1688-1700.
2. Wijesekera LC, Leigh PN. Amyotrophic lateral sclerosis. Orphanet J Rare Dis. 2009;4:3.
3. Rosen DR, Siddique T, Patterson D, Figlewicz DA, Sapp P, Hentati A, Donaldson D, Goto J, O'Regan JP, Deng HX, et al. Mutations in Cu/Zn superoxide dismutase gene are associated with familial amyotrophic lateral sclerosis. Nature. 1993;362:59-62.
4. Wong PC, Pardo CA, Borchelt DR, Lee MK, Copeland NG, Jenkins NA, Sisodia SS, Cleveland DW, Price DL, et al. An adverse property of a familial ALS-linked SOD1 mutation causes motor neuron disease characterized by vacuolar degeneration of mitochondria. Neuron. 1995;14(6):1105-1116.
5. Smith JP, Hicks PS, Ortiz LR, Martinez MJ, Mandler RN, et al. Quantitative measurement of muscle strength in the mouse. J Neurosci Methods. 1995;62:15–19.
6. Hatzipetros T, Kidd JD, Moreno AJ, Thompson K, Gill A, Vieira FG, et al. A Quick Phenotypic Neurological Scoring System for Evaluating Disease Progression in the SOD1-G93A Mouse Model of ALS. J Vis Exp. 2015;104:1-6.
7. de Graaf RA, Mason GF, Patel AB, Behar KL, Rothman DL, et al. In vivo 1H-[13C]-NMR spectroscopy of cerebral metabolism. NMR Biomed. 2003;16(6-7):339-357.
8. Mishra PK, Kumar A, Behar KL, Patel AB, et al. Sub-Anesthetic Ketamine Reverses Neuronal and Astroglial Metabolic Activity Deficits in a Social Defeat Model of Depression. Journal of Neurochemistry. 2018;146(6):722-734.
Figures