3441
Application of QSM in SPIO - labeled stem cell transplantation in Beagles with acute spinal cord injury
Junting Zou1, Jilei Zhang2, Zhao Xiance2, Yuanyuan Xie1, Bing Zhang1, and Xiaoli Mai1
1Nanjing Drum Tower Hospital, Nanjing, China, 2Philips Healthcare, Shanghai, China
1Nanjing Drum Tower Hospital, Nanjing, China, 2Philips Healthcare, Shanghai, China
Synopsis
Tracing and monitoring the growth of transplanted stem cells in vivo has become a focus of research. The purpose of this study is to realize the dynamic tracing of transplanted mesenchymal stem cells labeled with nano-iron(SPIO-huc-MSCs), and preliminarily explore the feasibility of indirect tracing of SPIO-huc-MSCs by QSM technology. The results show that susceptibility values in the areas containing iron are significantly different from those in the normal spinal cord, which indicates that the iron concentration in the injured area decreases gradually. By quantifying iron concentration, QSM technology can be used to dynamically trace SPIO labeled stem cells in vivo.
Introduction
Traumatic spinal cord injury (TSCI) refers to the structural and functional impairment of the spinal cord caused by various mechanical factors, resulting in complete or incomplete motor, sensory and sphincter dysfunction below the injury level[1]. It has been proved in animal experiments that transplanted stem cells can realize cell regeneration and functional recovery of damaged spinal cord[2]. Tracing and monitoring the growth of transplanted stem cells in vivo has also become a focus of research. Superparamagnetic iron oxide nanoparticle (SPIONs) is an MR tracer for labeling stem cells by altering R2 relaxation and shortening T2 relaxation time. Quantitative magnetic sensitivity imaging (QSM) is very sensitive to the difference in susceptibility of tissues, and it can be used for quantitative analysis of the tissue susceptibility. The purpose of this study is to realize the dynamic tracing of transplanted mesenchymal stem cells labeled with nano-iron(SPIO-huc-MSCs), and preliminarily explore the feasibility of indirect tracing of SPIO-huc-MSCs by QSM technology.Methods
The acute TSCI model is constructed by hemisection of the spinal cord at the T9 segment of the female Beagles. They are divided into three groups: group C (hemisection of the spinal cord), group M (hemisection of the spinal cord+ transplantation of huc-MSCs) and group T (hemisection of the spinal cord+ transplantation of SPIO-huc-MSCs). Multimodal MRI are performed in a 3.0T MRI scanner(Ingenia CX, Philips Healthcare, Best, The Netherland) before the operation, and after the operation at an interval of 3d, 7d, 14d, 21d, 28d, 35d, 49d, 63d, 77d and 105d. SPIO can significantly affect T2 and T2* signals, so T2WI and T2*WI sequences can be used to trace SPIO-huc-MSCs. However, the gray values in T2*WI image are not a direct reflection of T2* values. So we use relaxation time mapping technology (T2* Mapping) to fit the T2* values by collecting data from multiple TE time nodes. The susceptibility values can be calculated by the quantitative susceptibility imaging algorithm. Pathological and immunohistochemical analyses are performed at different timepoints to verify whether the abnormal MR signals are nano-iron particles and to investigate the biological behavior of transplanted MSCs in the spinal cord.Results
On the 3rd day after cell transplantation, hypointense signal appears in the central area of spinal cord injury on T2* weighted images, and remains in the spinal cord even on the 105th day, i.e. the scheduled termination time of the experiment. The hypointense T2* signalin the amplitude image and hyperintense in the QSM image is the imaging characteristic of SPIO. Prussian blue + hematoxylin + eosin staining of spinal cord specimen shows that a large number of PB staining positive iron nanoparticles appear in hypointense T2* signal region. As time goes on, fewer and fewer positive particles are observed and their distribution becomes more and more irregular. We consider that a part of the SPIO particles are metabolized and excreted into the mesenchyme. DAPI/CMDIL/CD90 staining positive cells, namely living SPIO-huc-MSCs, are found in spinal cord samples within 28 days. The susceptibility values per unit pixel decrease with time, and the total volume of iron increases with time. The T2* values also show a trend of increasing with time.Discussion
The SPIO-huc-MSCs are traced in vivo for 28 days by T2*WI. Compared with the normal tissues, the transverse relaxation time (T2) of iron is short and the signal attenuation is fast, so the T2* signal of iron is significantly lower than that of the normal spinal cord, and the susceptibility values of iron are calculated by the quantitative susceptibility imaging algorithm is higher than that of the normal spinal cord. The susceptibility values and T2* values in the areas containing iron are significantly different from those in the normal spinal cord, and their tendencies of change is consistent, which indicates that the iron concentration in the injured area decreases gradually.Conclusion
The SPIO-huc-MSCs are traced in vivo for 28 days by T2*WI. By quantifying iron concentration, QSM technology can be used to dynamically trace SPIO labeled stem cells in vivo.Acknowledgements
No acknowledgement found.References
1. Ryken T C , Hurlbert R J , Hadley M N , et al. The Acute Cardiopulmonary Management of Patients With Cervical Spinal Cord Injuries[J]. Neurosurgery, 2013, 72:84-92.Michailidou C, Marston L, Souza L H D, et al. 2. A systematic review of the prevalence of musculoskeletal pain, back and low back pain in people with spinal cord injury[J]. Disability & Rehabilitation, 2014, 36(9):705-715.Figures
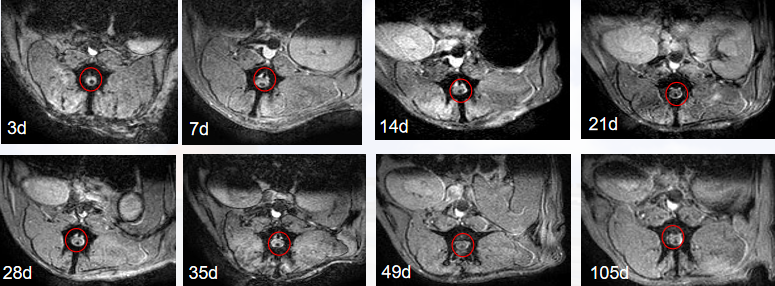
FIG. 1. MR-T2 * tracing of SPIO-huc-MSCs at different timepoints in beagles.The point-like hypointense signals in the injured spinal cord are observed in T2*WI images of each timepoint.
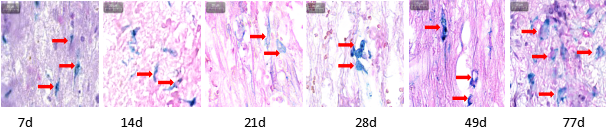
FIG. 2. Prussian blue + hematoxylin + eosin staining of spinal cord specimen.A large number of PB staining positive iron nanoparticles appear in hypointense T2* signal region. As time goes on, fewer positive particles are observed and their distribution becomes irregular. We consider that a part of the SPIO particles are metabolized and excreted into the mesenchyme.
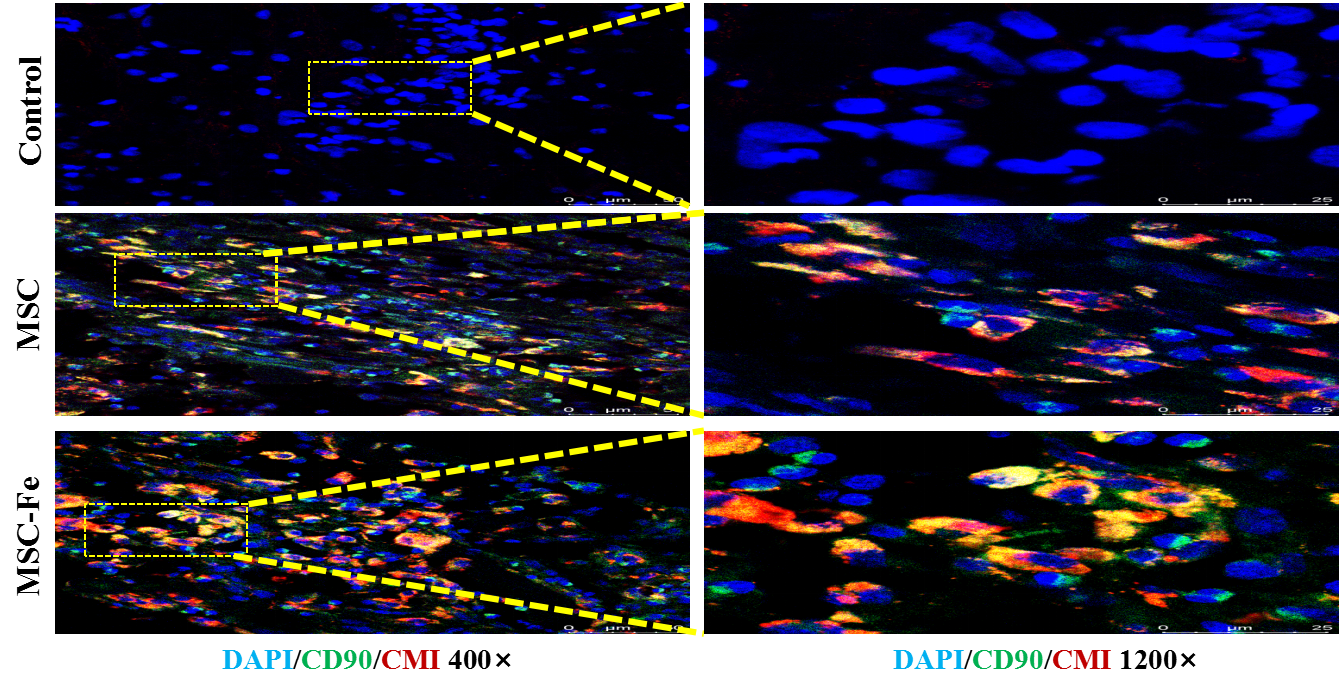
FIG. 3. DAPI/CMDIL/CD90 immunofluorescence staining of spinal cord specimen. CD90: surface marker of MSC cells; CMDIL: red dye, DAPI: nuclear staining. Transplanted MSCs with intact cell morphology are observed in all spinal cord samples within 28d, indicating that the SPIO-huc-MSCs still exist in vivo on the 28th day after transplantation.
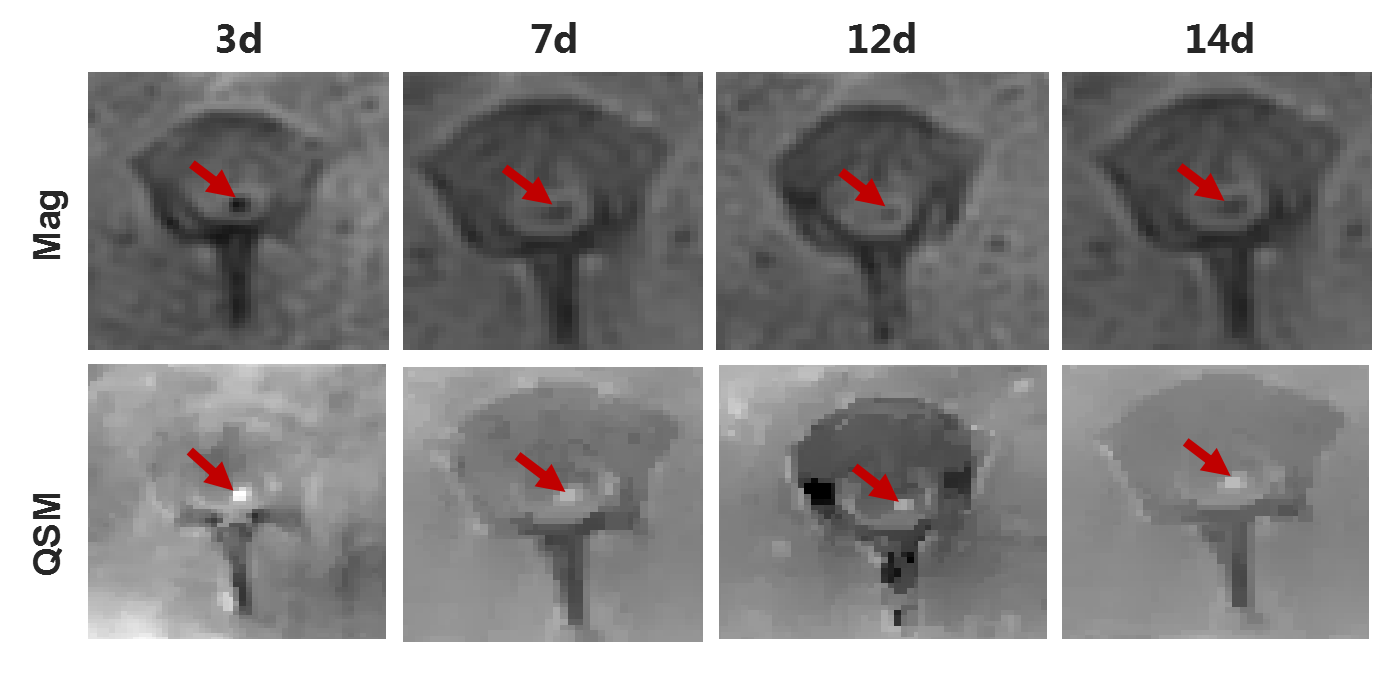
FIG. 4. QSM image of SPIO.Mag: Amplitude map, in which nano-iron oxide is black; QSM: The post-processed susceptibility distribution diagram, in which nano-iron oxide is white. We observed characteristic SPIO signals in the T2* hypointense signal region.
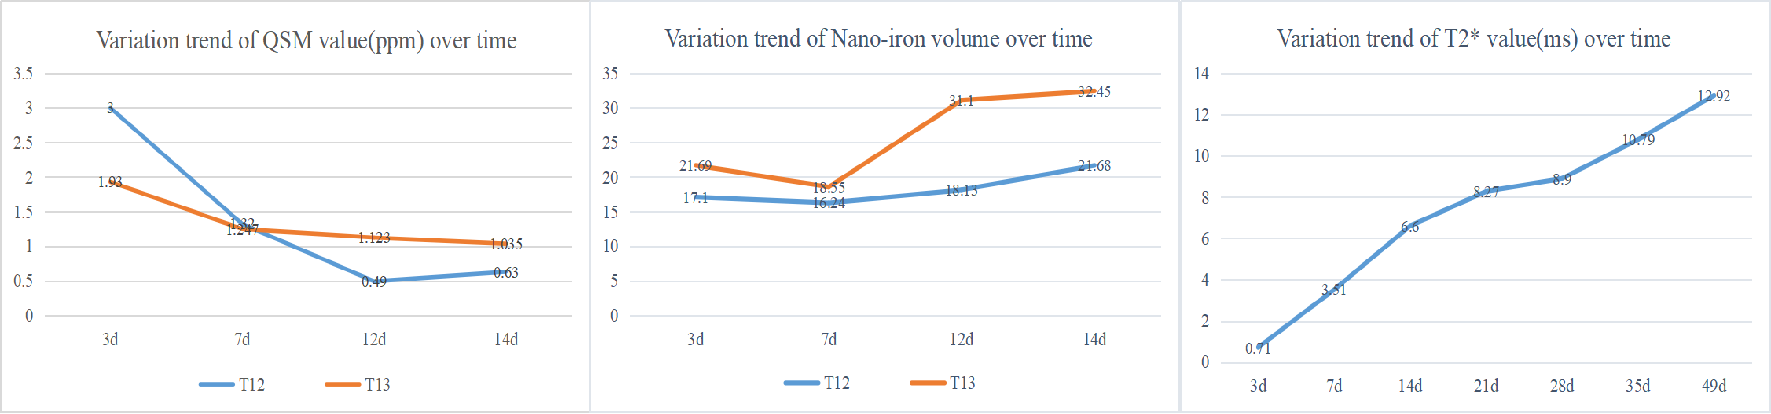
FIG. 5. Trend graphs of T2* values and susceptibility values changing over time.The susceptibility values per unit pixel decrease with time, and the total volume of iron increases with time. The T2* values also show a trend of increasing with time.