3440
Multicomponent Diffusion Analysis using L1-norm Regularized NNLS for an Accurate and Robust Detection of Alternations in Spinal Cord1Department of Electrical and Computer Engineering, University of Illinois at Chicago, Chicago, IL, United States, 2Research Resources Center, University of Illinois at Chicago, Chicago, IL, United States, 3Department of Bioengineering, University of Illinois at Chicago, Chicago, IL, United States
Synopsis
Multiple components analysis of nuclear magnetic resonance (MR) relaxation data using L2-norm regularized non-negative least squares (NNLS) method has been widely used in myelin imaging for neurological diseases. When this analysis is applied to diffusion-weighted MR imaging to investigate water diffusion properties of biological tissues, noise corruption becomes a major problem which affects the accuracy and robustness of results. In this study, a L1-norm regularized method was developed to process diffusion-weighted MRI data from spinal cords of amyotrophic lateral sclerosis affected mice.
INTRODUCTION:
Multiple components analysis of nuclear magnetic resonance (MR) relaxation data using the non-negative least squares (NNLS) method has been widely used in myelin imaging for neurological diseases.1-3 While NNLS approaches were rarely employed to analyze water diffusion properties of biological tissues, our previous study applied a L2-norm regularized NNLS algorithm revealing differences in certain diffusion coefficient fractions between wild type and amyotrophic lateral sclerosis (ALS) affected mice spinal cords.4 L2-norm regularization enhances stability and suppresses spurious peaks. The intrinsic property of L2-norm, however, may over-smooth the distribution of diffusion coefficients. In this study, we exploited a L1-norm regularization NNLS method to improve performance in suppressing spurious peaks and reduces effect of noise5,6 for the diffusion MRI data acquired over a wide range of b values in a mouse model of ALS.THEORY:
Diffusion-weighted signals can be written as I = A·W7, where W are the weights of diffusion coefficients (D). A is a matrix with elements Aij = exp(-biDj), bi is the ith element in b-values and Dj is the jth element in D. Due to noise corruption, the W cannot be calculated by a simple matrix inverse. The proposed L1-norm regularization minimizesArgminW γ||W||1
s.t. 1/2||A·W-In||22 ≤ αRmin2
0 ≤ W ≤ ub
where In is the normalized signal intensities from diffusion-weighted MR images, $$$≤$$$ denotes generalized inequalities, 0 is a vector with all elements zero and ub is the upper bound which has as an upper limit when D is larger than 2×10⁻³. The α and γ are given factors (α>0, γ>0) and Rmin is the residual of the non-regularized problem.
METHODS:
MRI scans of G93ASOD1 (n=8) and wild type (n=7) mice were performed on a 9.4 T Agilent MRI scanner with ambient temperature of [18, 20]$$$°C$$$. Both groups of animals (postnatal days 100) were euthanized (approved by IACUC) before MRI scans. A diffusion-weighted stimulated echo sequence was applied with b-values ranging from 0 to 858,022 s/mm2 and T2-weighted images were acquired using a fast spin echo sequence.4 Image post-processing was performed in MATLAB (MathWorks) and CVX (version 2.2, CVX Research, Inc.). Region of Interests (ROIs) were manually drawn at lumbar level of spinal cord. The sums of the calculated D weights (Sw) over pre-defined ranges were calculated and were used for student t test. The overlay of Sw maps on the T2-weighted images were performed in FSLeyes (FMRIB Analysis Group, Oxford, UK).RESULTS:
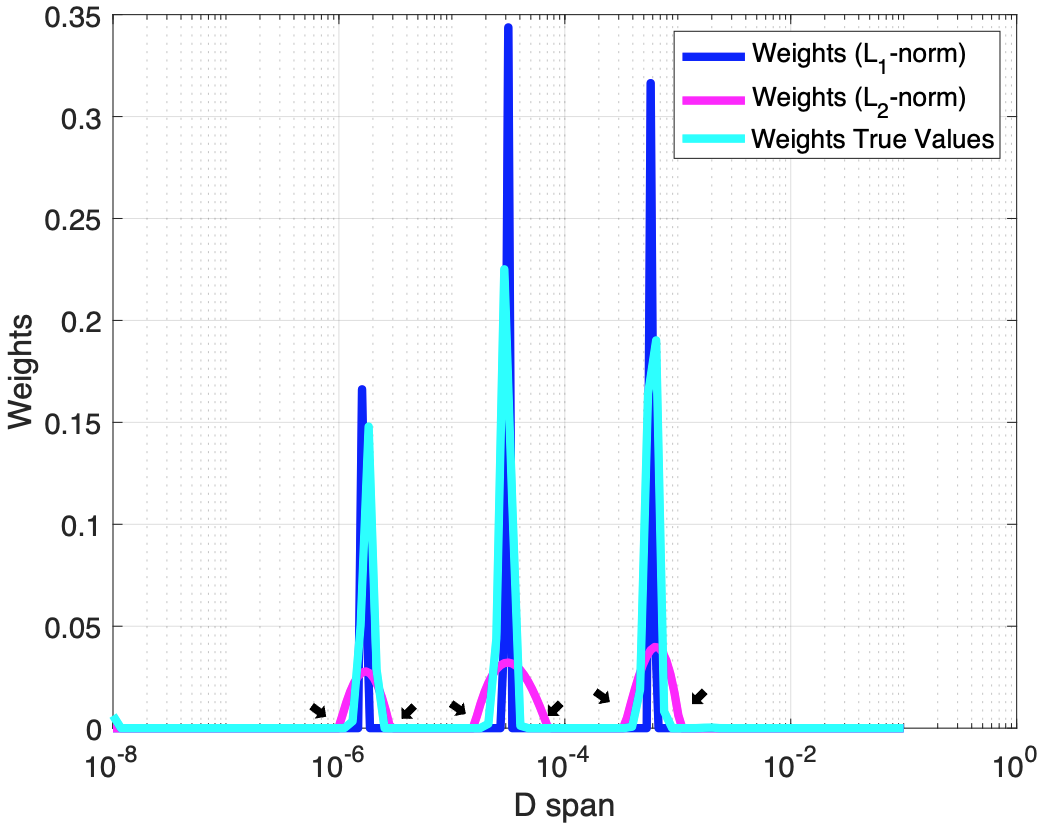
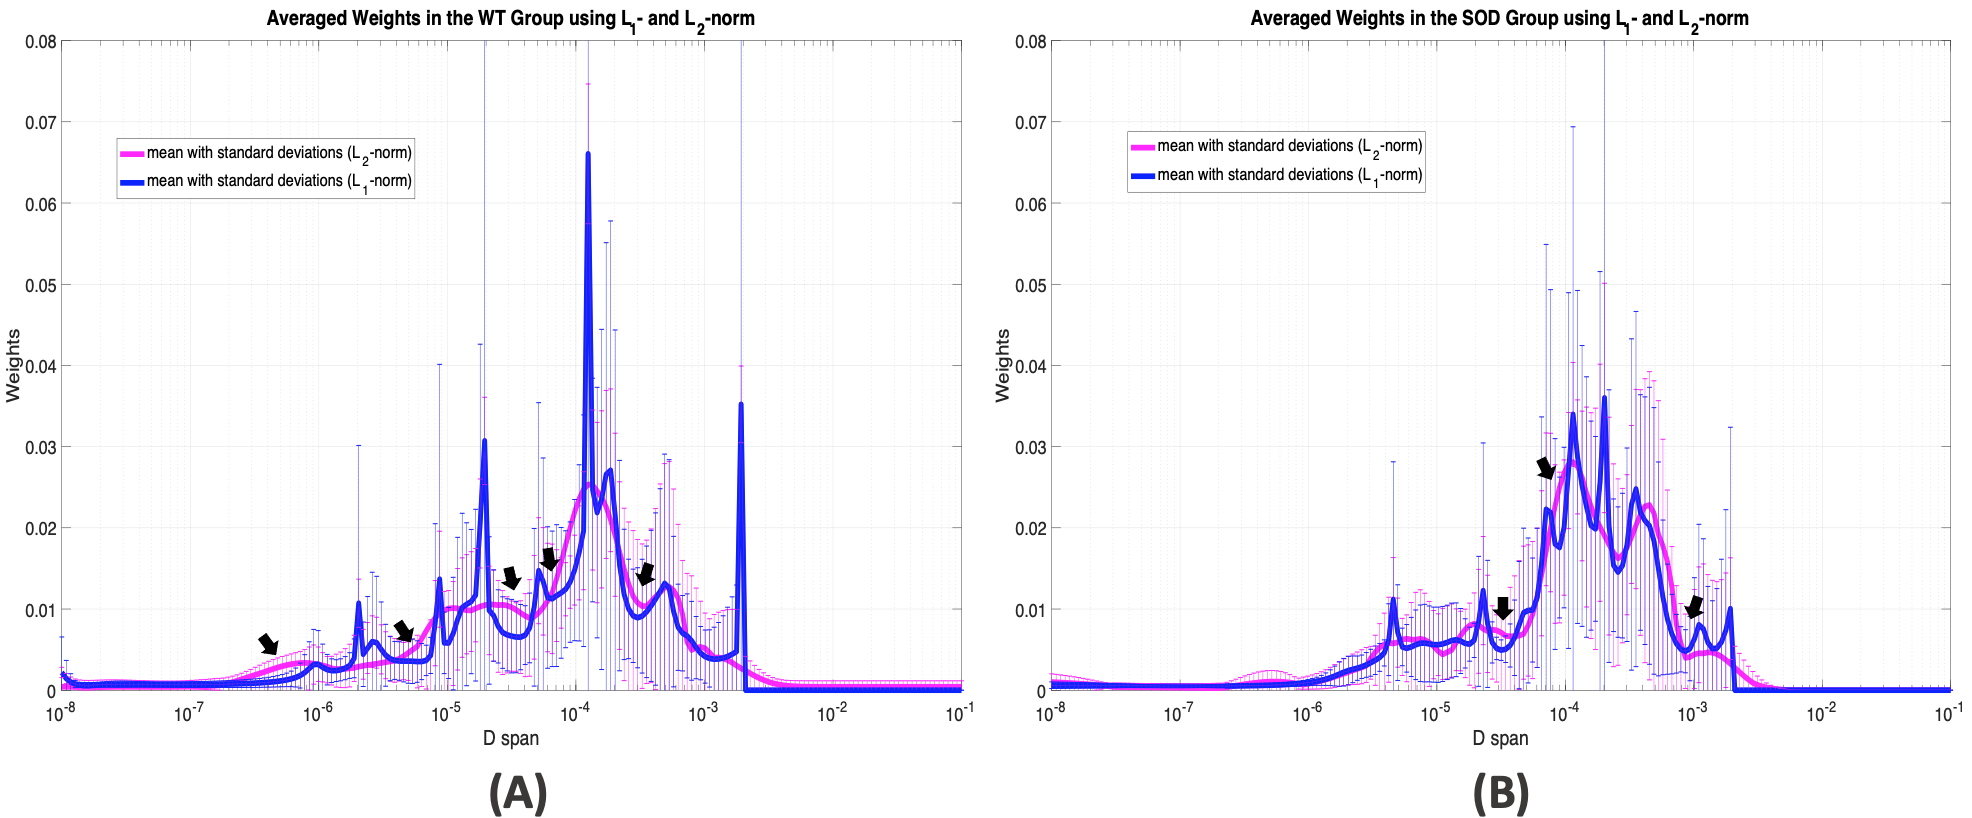
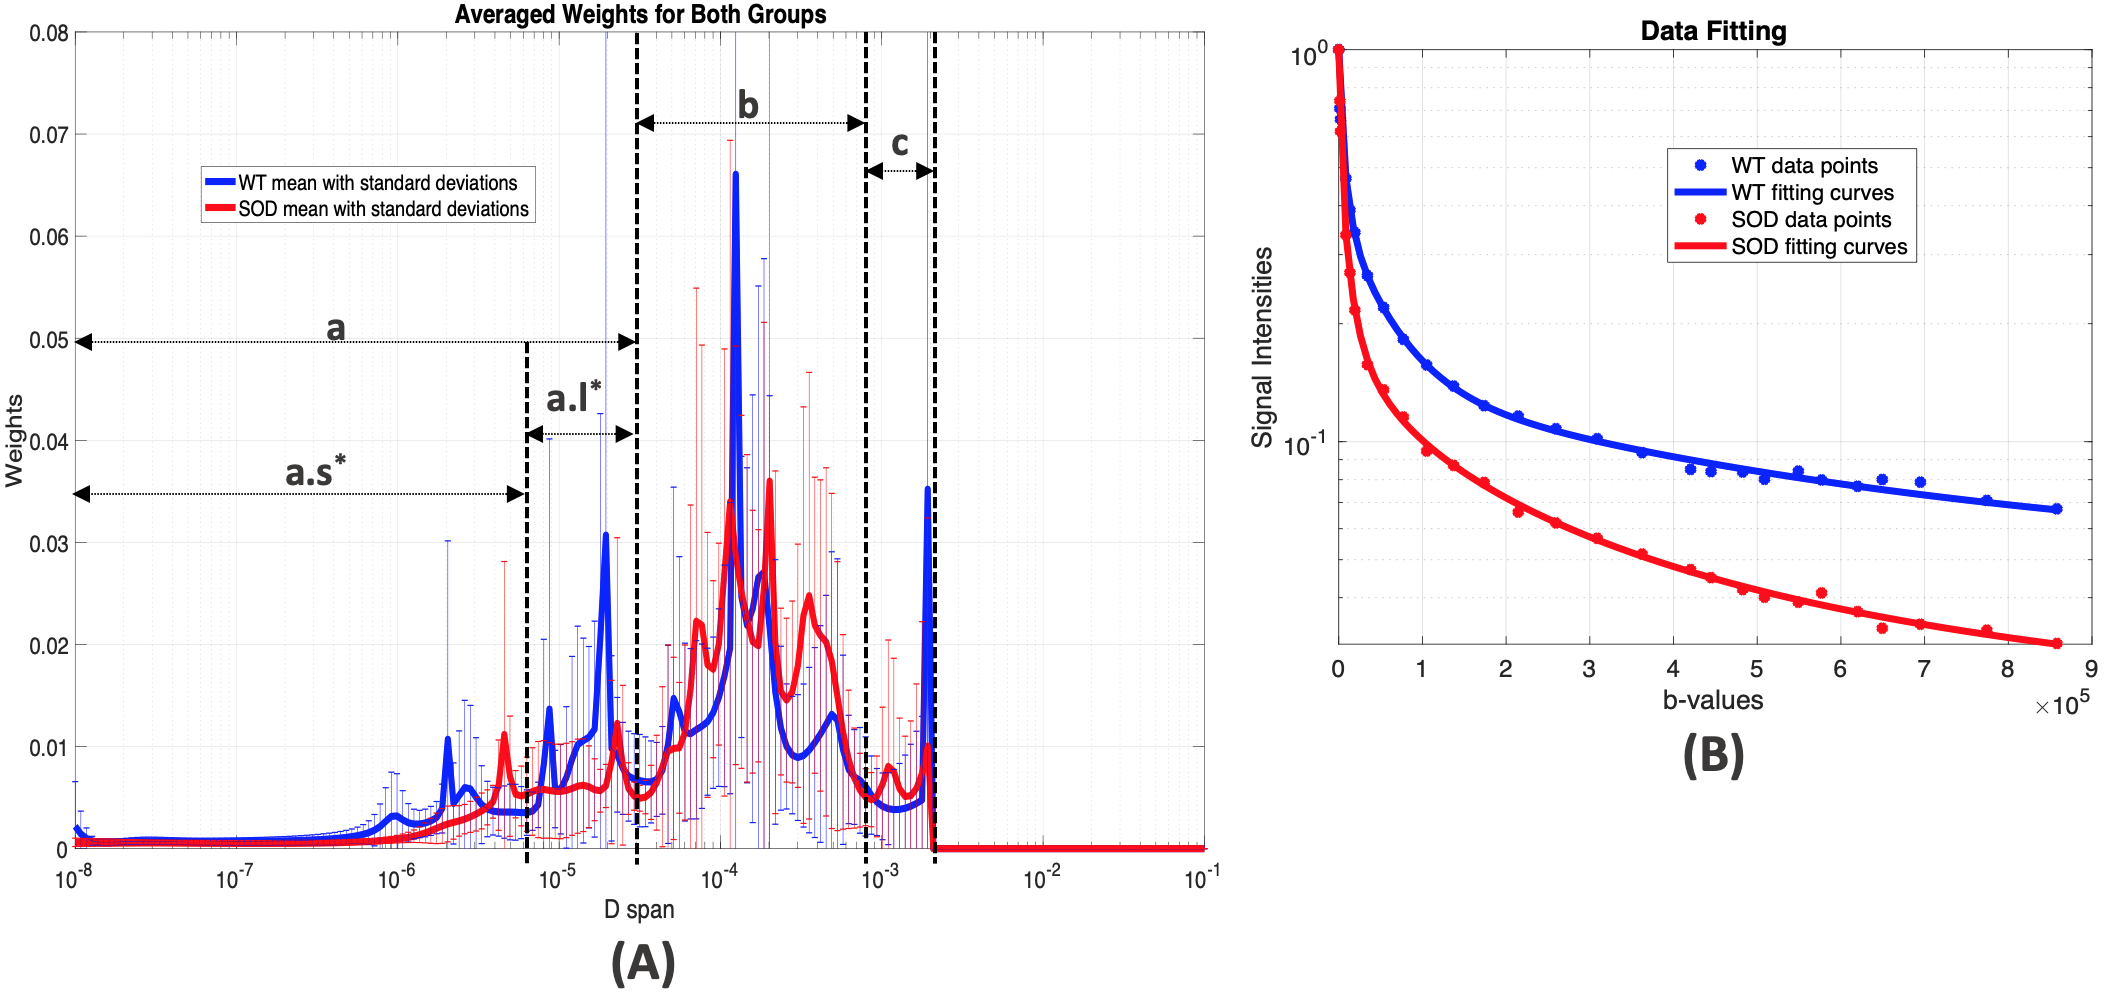
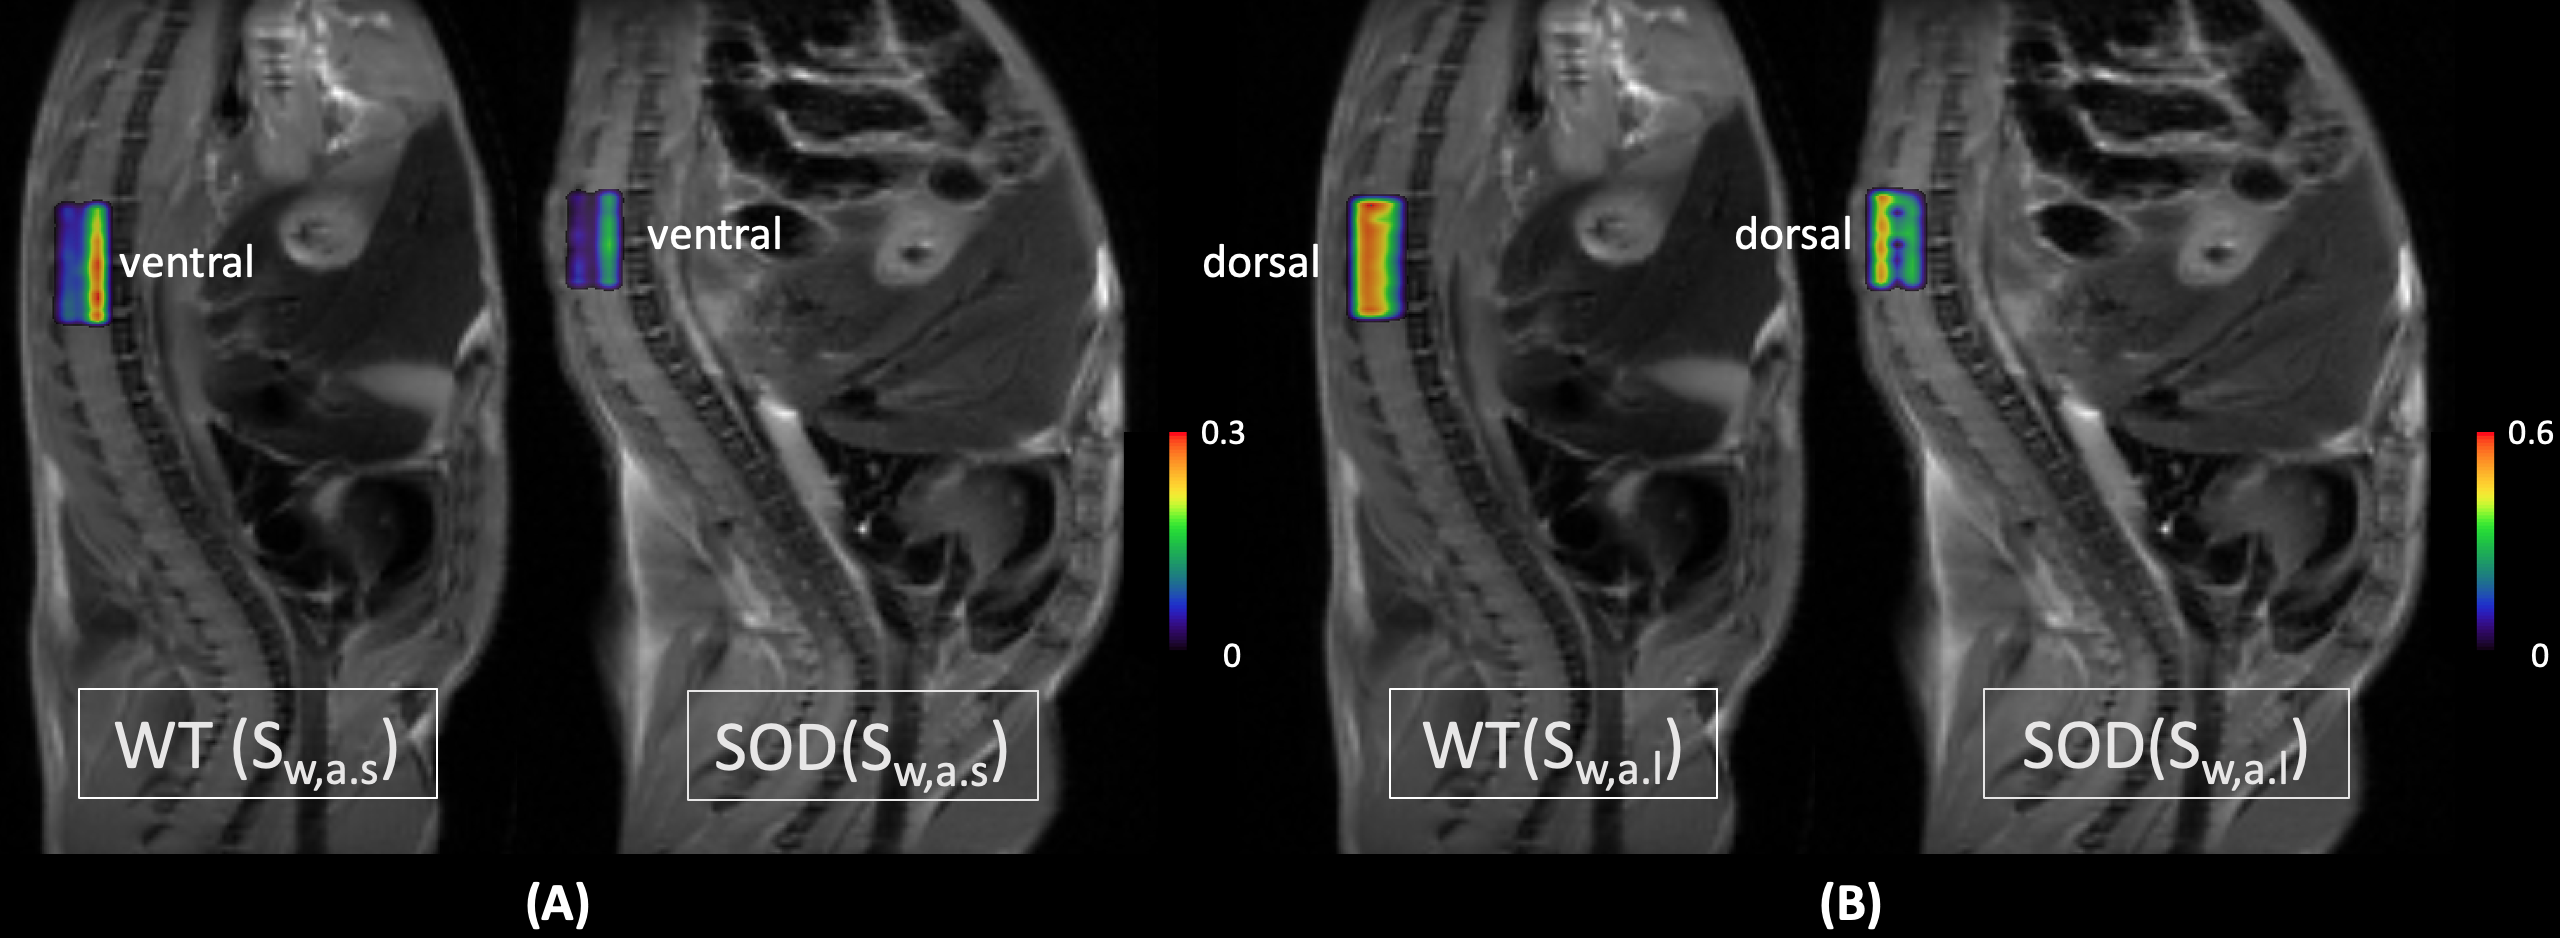
As shown in the simulation results (Fig. 1), the weight distribution of the L2-norm method in magenta is over-smoothed at all three peaks, when compared to the true distribution in cyan. Nevertheless, the peaks from the L1-norm method are narrower in width and the transition areas (pointed by black arrows) are sharper than them from L2-norm method. Similar behaviors were observed in the weight distributions in both groups of animals respectively (Fig. 2(A)(B)). When the results from the L1-norm method on wild type (WT) and mutant (SOD) groups are put together, it’s not hard to obtain three intervals, shown as ‘a’, ‘b’ and ‘c’ in Fig. 3(A). The interval ‘a’ can be further divided into two sub-regions, the one containing ultra-small diffusion coefficients (‘a.s’) and the other that has relatively small diffusion coefficients (‘a.l’). Significant differences of Sw between two animal groups are observed in both regions. The Sw calculated pixel-wisely in the region “a.s” (Sw,a.s) and “a.l” (Sw,a.l) are shown in Fig. 4(A) and (B) respectively. Apparently, the representative SOD mouse has lower Sw,a.s and Sw,a.l when compared to the WT mouse. Additionally, high Sw,a.s is shown on the ventral roots of spinal cord in both WT and SOD animals, and high Sw,a.l is shown on dorsal roots.DISCUSSION:
Compared to the L2-norm method (with χ2 misfit), the proposed L1-norm method can be solved as a convex optimization problem where the local minimum equals the global minimum. In addition, the robustness to outliers from L1-norm regularization ensures a good performance in diffusion-weighted MRI data that has low signal-to-noise ratios at high b-values. The sparsity of L1-optimal solutions provided the narrow peaks and sharp transition areas, which benefits the comparison of two distributions. The radial diffusivity (RD) in diffusion tensor imaging from other studies8-11 falls into the region ‘b’. Significant decreases of Sw in SOD group at region ‘a’ may reveal the degeneration in micro-environment associating with ALS disease (P< 0.05). In addition, the high Sw,a.s in ventral roots and high Sw,a.l in dorsal roots are consistent with the larger RD observed in dorsal roots than ventral.8-11 Nonetheless, the sums of weights on small Ds calculated from the ultra-high b-value diffusion-weighted MRI imaging are more sensitive to highly compact structures when compared to RD. The Sw,a.s and Sw,a.l, therefore, may detect micro-environment alternations in ALS affected spinal cord with increased sensitivity and accuracy.Acknowledgements
No acknowledgement found.References
1. Laule C, Vavasour IM, Moore GRW, Oger J, Li DKB, Paty DW, et al. Water content and myelin water fraction in multiple sclerosis. Journal of Neurology 2004;251:284-293.
2. Manogaran P, Vavasour I, Borich M, Kolind SH, Lange AP, Rauscher A, et al. Corticospinal tract integrity measured using transcranial magnetic stimulation and magnetic resonance imaging in neuromyelitis optica and multiple sclerosis. Multiple Sclerosis Journal 2015;22:43-50.
3. Sirrs SM, Laule C, Mädler B, Brief EE, Tahir SA, Bishop C, et al. Normal-appearing white matter in patients with phenylketonuria: water content, myelin water fraction, and metabolite concentrations. Radiology 2007;242:236-243.
4. Gao J, Jiang M, Magin RL, Gatto RG, Morfini G, Larson AC, et al. Multicomponent diffusion analysis reveals microstructural alterations in spinal cord of a mouse model of amyotrophic lateral sclerosis ex vivo. PLOS ONE 2020;15:e0231598.
5. Gholami A, Sacchi MD. A Fast and Automatic Sparse Deconvolution in the Presence of Outliers. IEEE Transactions on Geoscience and Remote Sensing 2012;50:4105-4116.
6. Claerbout JF, Muir F. Robust Modeling With Erratic Data. Geophysics 1973;38:826-844.
7. Whittall KP, MacKay AL. Quantitative interpretation of NMR relaxation data. Journal of Magnetic Resonance (1969) 1989;84:134-152.
8. Marcuzzo S, Bonanno S, Figini M, Scotti A, Zucca I, Minati L, et al. A longitudinal DTI and histological study of the spinal cord reveals early pathological alterations in G93A-SOD1 mouse model of amyotrophic lateral sclerosis. Experimental Neurology 2017;293:43-52.
9. Kim JH, Wu T-H, Budde MD, Lee J-M, Song S-K. Noninvasive detection of brainstem and spinal cord axonal degeneration in an amyotrophic lateral sclerosis mouse model. NMR in Biomedicine 2011;24:163-169.
10. Figini M, Scotti A, Marcuzzo S, Bonanno S, Padelli F, Moreno-Manzano V, et al. Comparison of diffusion MRI acquisition protocols for the in vivo characterization of the mouse spinal cord: variability analysis and application to an amyotrophic lateral sclerosis model. PLOS ONE. 2016 Aug 25. doi: 10.1371/journal.pone.0161646
11. Gatto RG, Amin MY, Deyoung D, Hey M, Mareci TH, Magin RL. Ultra-high field diffusion MRI reveals early axonal pathology in spinal cord of ALS mice. Translational neurodegeneration. 2018 Aug 08. doi: 10.1186/s40035-018-0122-z
Figures