3430
Effect of the Signal-to-noise Ratio on the Optimal Model Mapping for Intravoxel Incoherent Motion MRI1Department of Neuroscience, Kyoto University Graduate School of Medicine, Kyoto, Japan, 2Human Brain Research Center, Kyoto University Graduate School of Medicine, Kyoto, Japan, 3Institute for the Advanced Study of Human Biology (ASHBi), Kyoto University, Kyoto, Japan, 4Yasu City Hospital, Yasu, Japan
Synopsis
To improve the uncertainties caused by the inappropriate diffusion model fitting in the IVIM-MRI, an optimal model mapping method has been proposed and demonstrated its usefulness. Here, we investigated the effect of the SNR in the method. Six different SNR data sets, derived by changing the numbers of average (NA) of six sets of DWI volumes, were analyzed. Then, the resultant maps reached a steady-state when the NA is four or higher. This study revealed that further investigations on b-value distribution optimization and denoising are necessary to obtain such high SNR data within practical scan time.
Introduction
In the Intravoxel Incoherent Motion MRI (IVIM-MRI) study, the quality of diffusion fitting can influence perfusion analysis quality. Therefore, an appropriate model for the diffusion analysis was critical for the quantification of perfusion. Some previous studies showed that the optimal model could be varied by tissue structures (1, 2) so that applying a single model to the whole regions of interest might cause intrinsic errors by inappropriate modeling. To improve the uncertainties caused by this effect, the so-called optimal modeling method has been proposed (3), in which an optimal diffusion model was selected from the candidates voxel by voxel, and demonstrated its usefulness. However, to differentiate the optimal one from the others based on the goodness-of-fit, sufficiently high SNR is necessary. Therefore, this study aims to investigate the effect of the SNR on the optimal model mapping method.Materials and Methods
Six normal subjects were examined with a whole-body 3T scanner Trio Tim (Siemens, Germany) with a 32-channel phased-array head coil. In IVIM-MRI, six motion probing gradient (MPG) directions ([1,1,0], [0,1,1], [1,0,1], [1,−1,0], [0,1,−1], [−1,0,1]) with 17 b-values ranging from 0 to 2500 s/mm2 were applied for a single set of IVIM-MRI images. Totally six sets of images were obtained, and different SNR data sets were derived by changing the numbers of average (NA) from one to six. The other imaging parameters were TR/TE = 2,600/80 ms; flip angle = 90°; voxel size = 3×3×3 mm3; acquisition matrix size = 64×48 (3/4 partial Fourier); image matrix size = 64×64; 22 slices and slice gap = 3 mm.The IVIM-MRI parameters were analyzed by using the asymptotic method (4). The threshold b-value of 600 s/mm2 was used. Gaussian, Kurtosis, and Gamma models were used for the optimal model mapping (5). The diffusion-relative parameters of mean diffusivity (MD) and apparent diffusional kurtosis (Kapp) were acquired model by model. The residual signals were then analyzed by the mono-exponential model for the perfusion-relative parameters of the perfusion fraction (fp) and the pseudo-diffusion coefficient (D*). The corrected Akaike Information Criterion (cAIC) was used to verify the optimal model for a voxel in each condition. The optimal parameter maps were reconstructed by referring to the optimal model map and filling the optimal results to the corresponding voxels.
Results
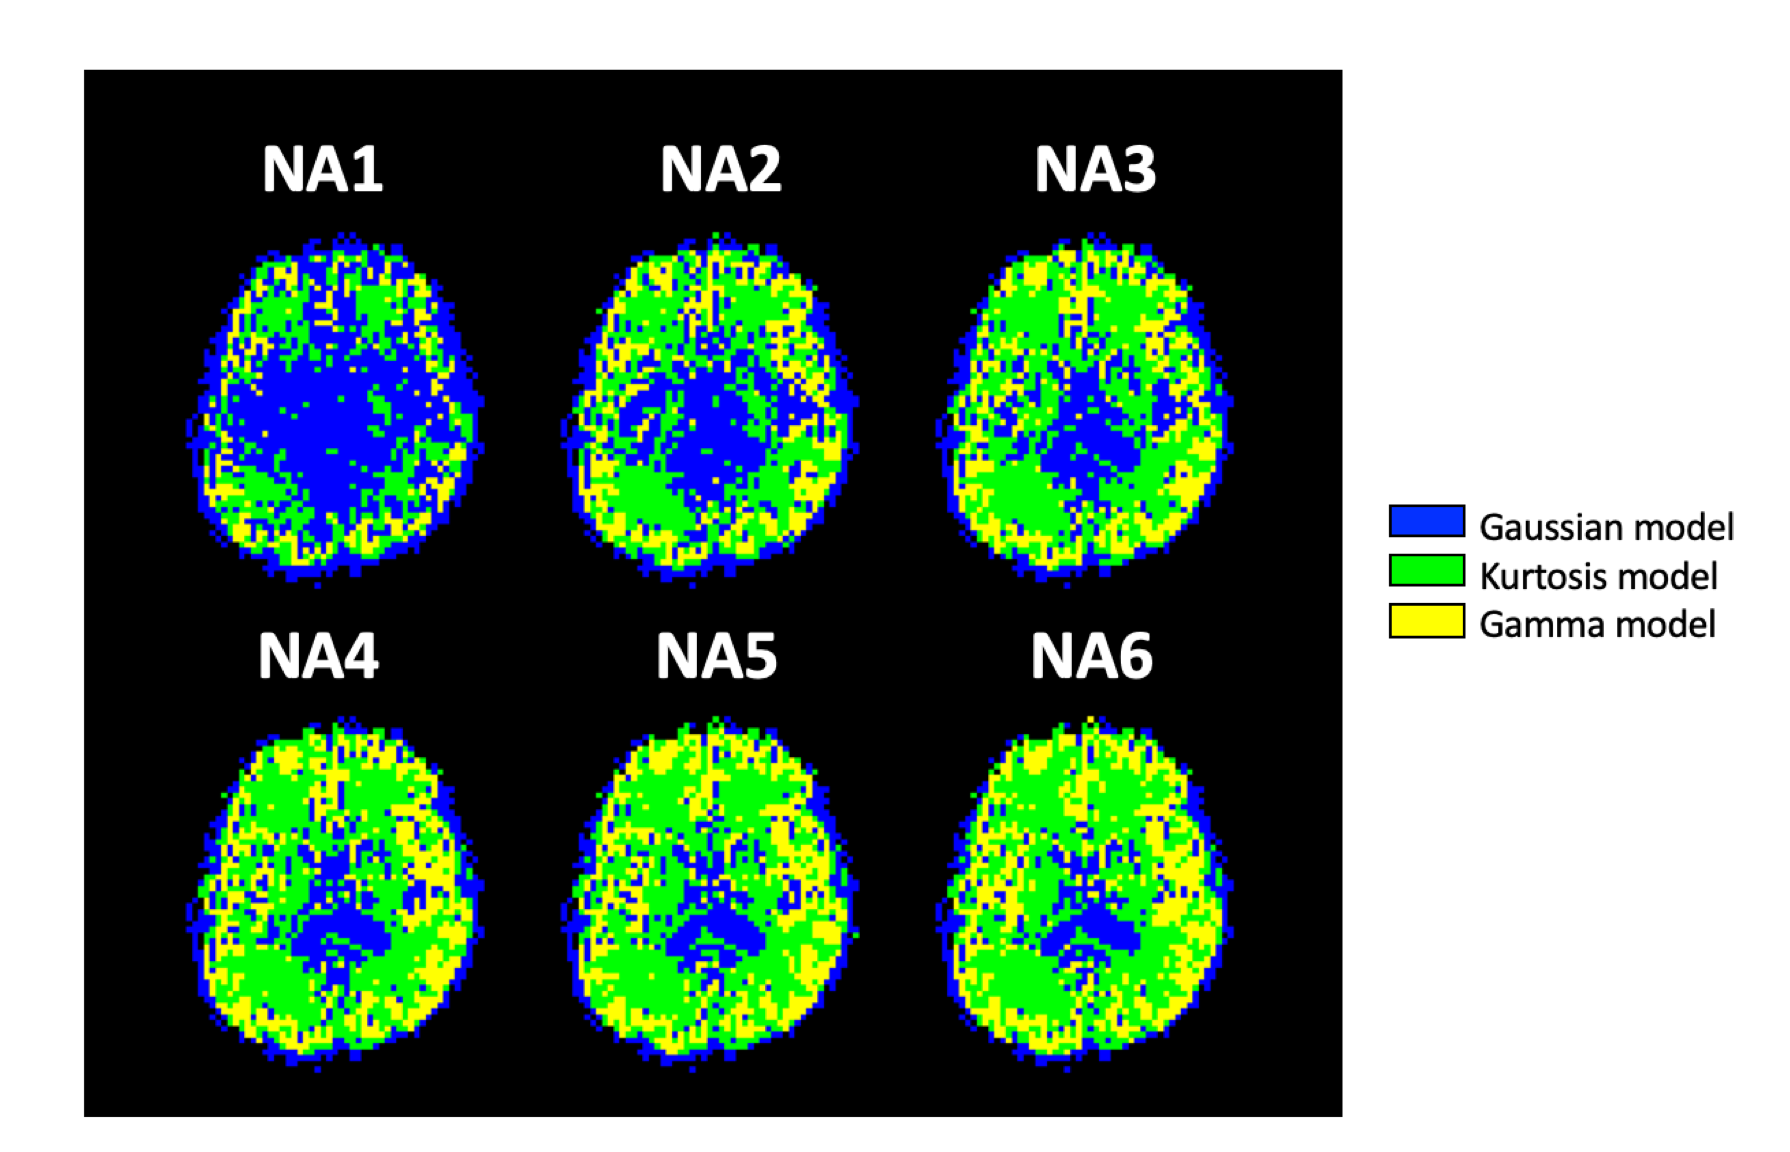
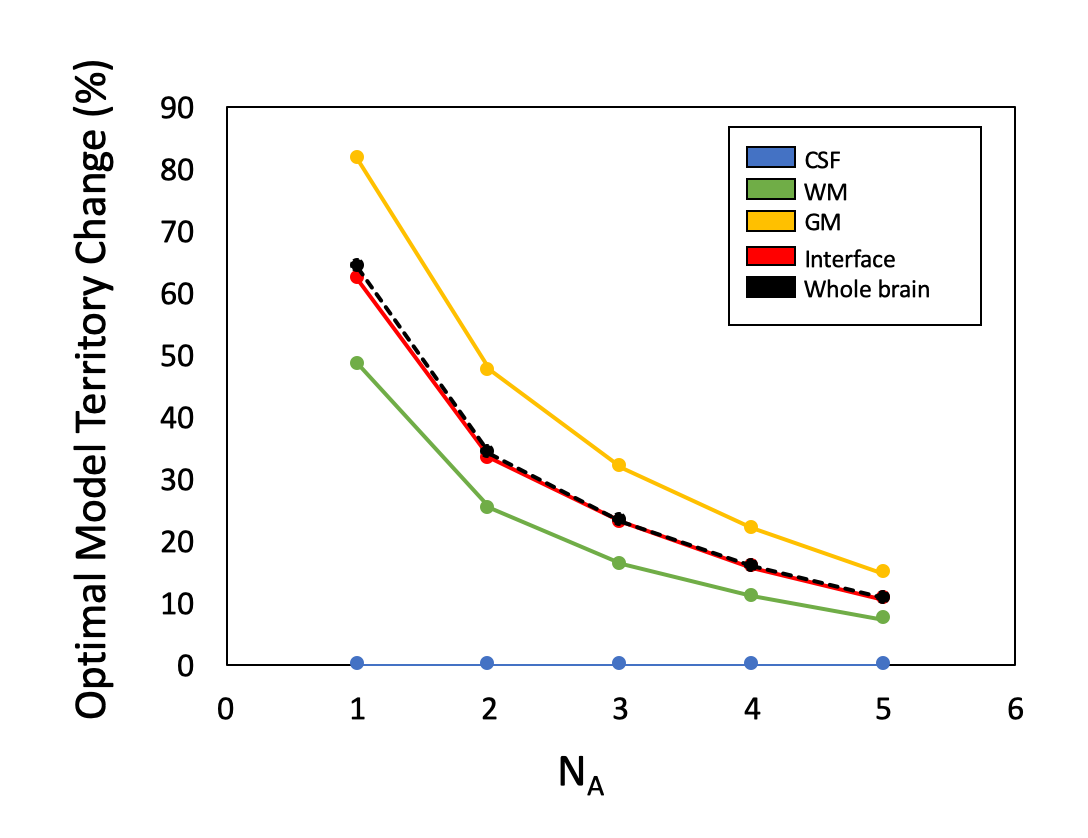
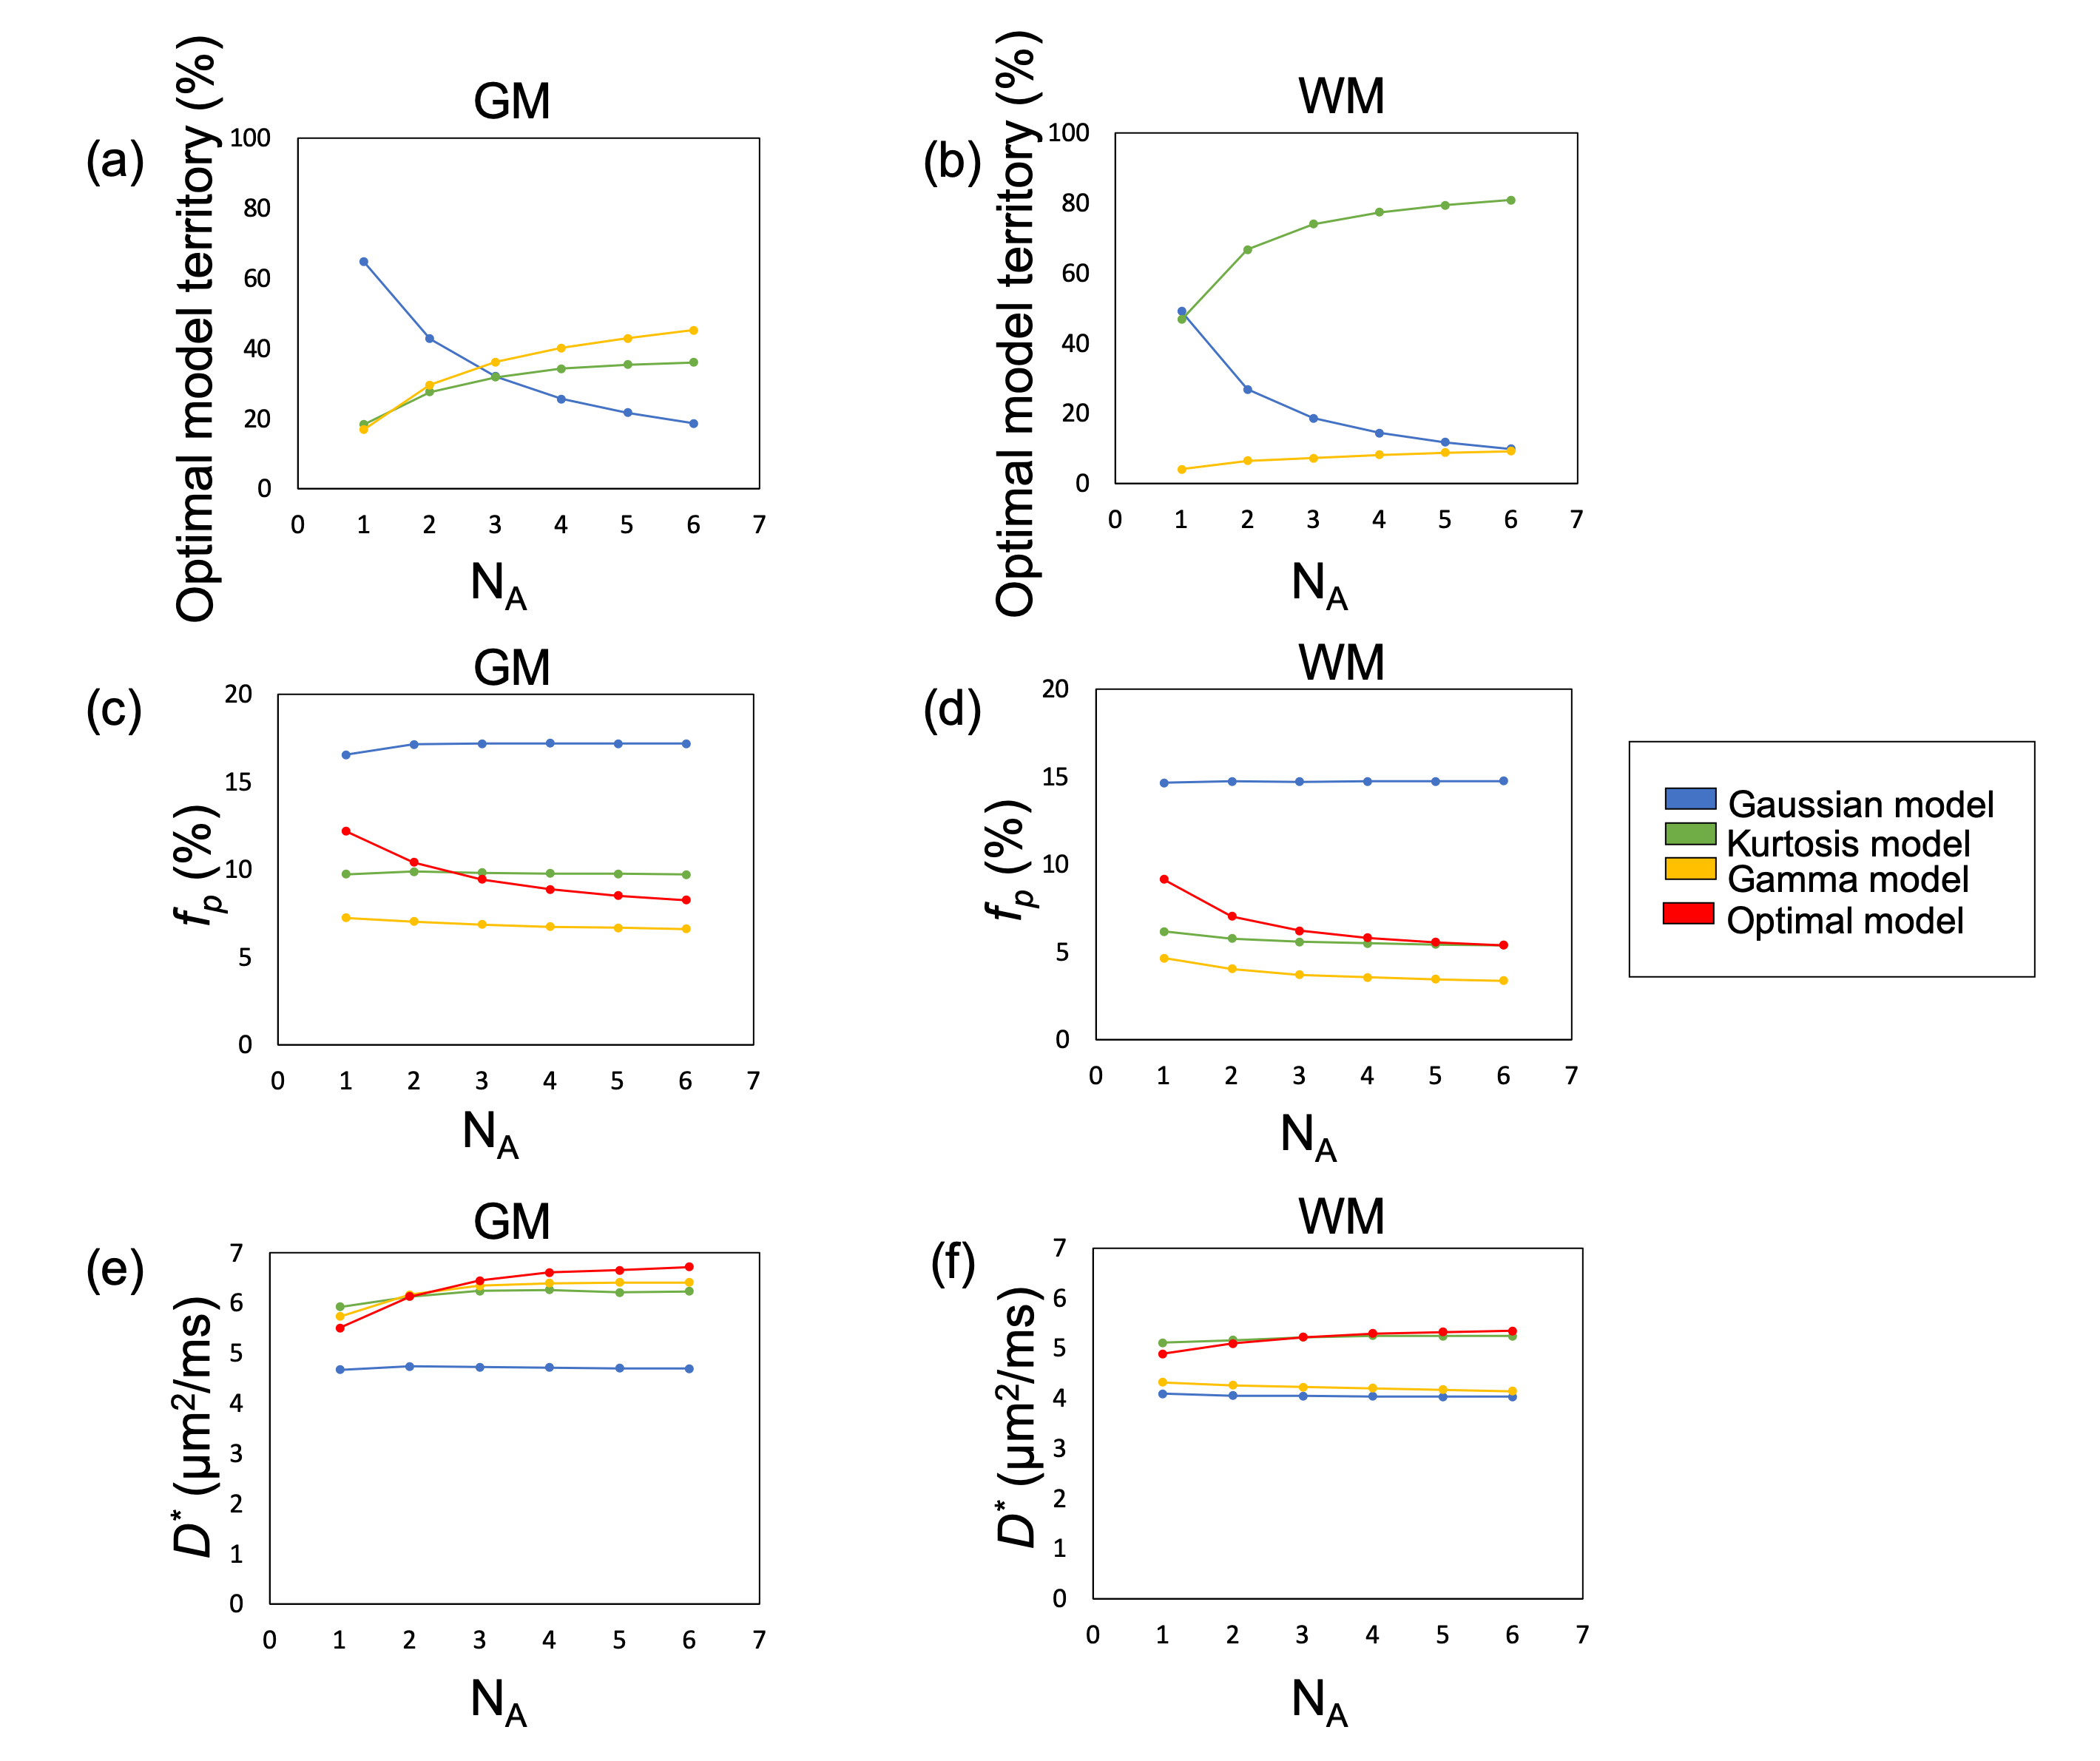
Figure 1 showed the optimal model maps with different NAs. The Gaussian model was dominant when the SNR is low (e.g., NA1), but the optimal model is switched to the Kurtosis or Gamma model in the parenchymal regions by increasing NA. Figure 2 illustrated changes of the optimal model territory relative to that of the NA6 data. The optimal model switches happened in 64.2% (NA1), 34.3% (NA2), 23.2% (NA3), 16.0% (NA4), and 10.8% (NA5) of whole-brain voxels. Figure 3(a) and 3(b) demonstrate the optimal model territories by different NA in gray matter (GM) and white matter (WM), respectively. By increasing NA, the Gamma and Kurtosis models became more dominant in GM and WM, respectively, while the Gaussian model declined. Besides, there were changes in estimated fp (Fig.3 (c) and (d)) and D* (Fig.3 (e) and (f)) on increasing NA in the parenchymal regions. All curves started achieving plateaus when NA was four or larger.Discussion
This study showed that the SNR, which NA represented, influences the optimal model mapping results. We demonstrated that with NA≥ 4, the IVIM-MRI parameters estimated by the optimal model mapping method were relatively stable, and the optimal model maps showed clear territories corresponding to the tissue structures (Fig.1 and Fig. 3).In contrast, the single model analysis by each candidate model showed less sensitivity to SNR. Both of the inter-subject means of fp and D* were relatively stable by increasing NA. However, the intrinsic errors from the diffusion modeling can affect to the perfusion estimations. In the clinic, there is no modeling expectation for the legion structures. The uncertainties caused by the inappropriate diffusion model cannot be aware without additional information. Therefore, for the quantitative analysis, the potential of the optimal model mapping can be expected with quality IVIM-MRI data.
In conclusion, sufficient high SNR is needed for the optimal model mapping method. Some novel denoising techniques can gain SNR for the IVIM-MRI data. Besides, the b-value distribution should be optimized. The applicable protocols for the method need further investigation.
Acknowledgements
We thank Prof. Denis Le Bihan for assistance with establishing the basic hypothesis of this study. We also would like to express our immense gratitude to Dr. Aso, Dr. Okada, Dr. Fujimoto, and Dr. Matsuhashi for their comments that greatly improved the manuscript. We also thank the University of Minnesota Center for Magnetic Resonance Research for sharing their Multiband DWI sequence.References
1. Lu Y, Jansen JF, Mazaheri Y, Stambuk HE, Koutcher JA, Shukla-Dave A. Extension of the intravoxel incoherent motion model to non-gaussian diffusion in head and neck cancer. J Magn Reson Imaging. 2012 Nov;36(5):1088-1096.
2. Pavilla A, Gambarota G, Arrigo A, Mejdoubi M, Duvauferrier R, Saint-Jalmes H. Diffusional kurtosis imaging (DKI) incorporation into an intravoxel incoherent motion (IVIM) MR model to measure cerebral hypoperfusion induced by hyperventilation challenge in healthy subjects. MAGMA. 2017 Dec;30(6):545-554.
3. Liao YP, Urayama S, Fukuyama H, Le Bihan D. Hybrid Modeling for Perfusion Quantification Using Intravoxel Incoherent Motion MRI. Proc. Intl. Soc. Mag. Reson. Med. 25 (2017): 1730 (Traditional Poster)
4. Pekar J, Moonen CT, van Zijl PC. On the precision of diffusion/perfusion imaging by gradient sensitization. Magn Reson Med. 1992 Jan;23(1):122-9.
5. Jensen JH, Helpern JA. MRI quantification of non-Gaussian water diffusion by kurtosis analysis. NMR Biomed. 2010 Aug;23(7):698-710.
Figures