3429
Fast and accurate quantification of intra-voxel incoherent motion (IVIM) with spherical-tensor-encoded diffusion MRI1Department of Neurology, University Medical Center Utrecht, Utrecht, Netherlands, 2PROVIDI Lab, Image Sciences Institute, University Medical Center Utrecht, Utrecht, Netherlands, 3Brigham and Women's Hospital, Harvard Medical School, Boston, MA, United States, 4Cardiff University Brain Research, Imaging Centre (CUBRIC), University of Cardiff, Cardiff, United Kingdom, 5Image Sciences Institute, University Medical Center Utrecht, Utrecht, Netherlands
Synopsis
Diffusion MRI scans sensitive to intra-voxel incoherent motion (IVIM) are increasingly being applied to derive properties of capillary blood pseudo-diffusion in-vivo. A robust quantification of pseudo-diffusion measures requires the acquisition of diffusion MRI with multiple weightings and directions, which is time-consuming. Here, we investigate whether the isotropic averaging of spherical tensor diffusion encoding (STE) can improve IVIM estimates and shorten the acquisition time. Our simulations and in-vivo data show that STE can substantially shorten the acquisition time required to robustly quantify pseudo-diffusion while also removing a previously unreported bias in voxels containing complex white matter fiber configurations.
Introduction
The quantification of intra-voxel incoherent motion1 (IVIM) effects is popular to derive surrogate markers of blood pseudo-diffusion based on diffusion MRI2 (dMRI). To reliably quantify pseudo-diffusion, experiments typically consist of a large range of diffusion weightings and gradient directions, which is time consuming and hinders widespread clinical application.In contrast to conventional linear tensor encoding3 (LTE), which typically requires signal averaging across directions, multidimensional encoding such as spherical tensor encoding4 (STE) might be beneficial for IVIM, because it sensitizes the signal to diffusion in all directions in a single encoding. In this work, we investigate whether STE can improve the estimation of IVIM models – particularly in regions of crossing fibres where LTE results may be biased5 – and can further shorten acquisition time towards clinical application.
Methods
TheoryBlood pseudo-diffusion can be quantified with a bi-exponential1,6 or tri-exponential7 model, or spectral methods8. Here, we focus on the bi-exponential isotropic model, because it features just 4 free parameters. The signal can be written as
$$S(b)=S_{0}(f_{IVIM}e^{-bD_{IVIM}}+(1-f_{IVIM})e^{-bD_{T}}), [1]$$
where S is the signal collected at diffusion-weighting b, S0 the non diffusion-weighted signal, fIVIM the pseudo-diffusion fraction associated to diffusivity DIVIM, and DT the mean diffusivity of tissue.
The bi-exponential model was fit with a non-linear least-squares procedure9 implemented in MATLAB. When fitting LTE data, geometric averaging of each diffusion weighting was performed8.
Simulations
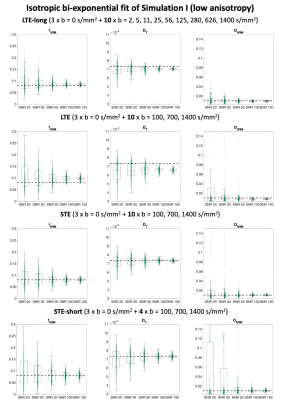
We considered 4 data acquisitions: 1) a reference LTE acquisition (LTE-long) with 10 directions at 10 b-values log-spaced between 0 and 1400 s/mm2 with TE=80ms; 2) LTE in 10 directions at b = [0,100,700,1400]s/mm2 and TE = 110ms; 3) STE with the parameters as in 2); 4) STE-short, an STE acquisition with only 40% of the data in 3).
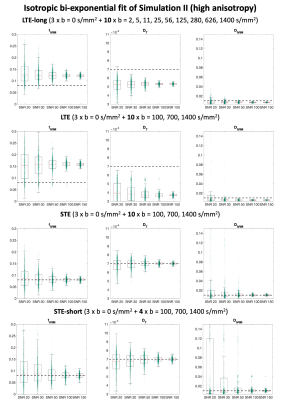
Two physiologically plausible simulations were performed. In Simulation I, a synthetic signal was generated as sum of two cylindrically symmetric tensors representing tissue and anisotropic pseudo-diffusion10, respectively, with axial/radial diffusivity of 1.2/0.5x10-3mm2/s and 20/5x10-3mm2/s, and T2 of 90ms and 180ms. In Simulation II, the axial/radial diffusivity of the tissue tensor were set to 1.7/0.2x10-3mm2/s, changing fractional anisotropy (FA). In both simulations, the corresponding ground-truth values were fIVIM = 0.08, DT = 0.7x10⁻³mm2/s, DIVIM = 0.7x10⁻³mm2/s.
The signals of both simulations were generated 1000 times with Rician noise to simulate SNR at b = 0s/mm2 of [20,30,50,100,150]. After fitting, fIVIM was corrected for T2 effects (assuming their value as known) and the relative errors of the median of the computed parameters were determined.
In-vivo data
MRI data acquired with a Siemens 3T with resolution 2.5mm3 isotropic, and both LTE and STE9 was used. A subset of the data matching the simulated gradient encodings (simulations 2-4) was selected to perform the IVIM fit. Diffusion tensors were fitted to the LTE data10 to quantify FA11.
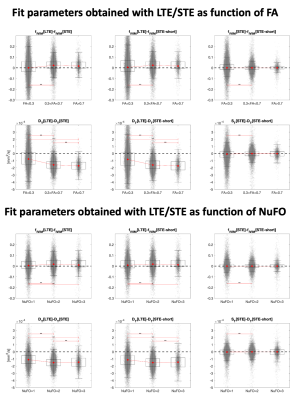
Subsequently, the fiber orientation distribution was determined using all available LTE data14 and the number of fibers15 (NuFO) derived voxel-wise. The difference between fIVIM and DT computed with LTE and STE was evaluated in 3 classes of voxels defined by either by FA<0.2, 0.2<FA<0.7 and FA>0.7, or by NuFO, and its significance assessed with sign-tests.
Results
The results of simulation I are reported in Fig. 1. The boxplots show that the estimates of fIVIM, DT and DIVIM with LTE data are consistently biased across all SNR, whereas estimates with STE and STE-short are unbiased for all SNR levels.Fig. 2 shows that higher anisotropy further worsens the estimates with LTE, but not with STE. This is also confirmed by Table 1: at SNR 50, the maximum average estimation error of fIVIM is 2.2% with STE-short, as compared to 52.5% with LTE-long.
Fig. 3 illustrates the estimates obtained with in-vivo data. The map of fIVIM with LTE (denoted fIVIM[LTE]) shows higher values than with STE, especially in WM. The dependence of fIVIM and DT on FA is analyzed in Fig. 4. The difference between fIVIM[LTE] and fIVIM[STE] significantly increases with FA, whereas the difference in DT decreases. A similar relation is observed as function of NuFO.
Discussion
Our results suggest that the use of STE is preferred over LTE to obtain more accurate estimates of pseudo-diffusion. With simulations, we have shown that the mean diffusivities of two isotropic components converge to the underlying ground truth value when using STE, even in voxels with high tissue anisotropy or crossing fibers. Conversely, the use of LTE results in systematic biases, which may relate to the suboptimality of geometric averaging in combination with isotropic diffusion models.We further observe that the improved accuracy with STE persists even when compared to a richer LTE acquisition with more SNR (LTE-long). Furthermore, fIVIM[STE] seems to agree with perfusion maps obtained with alternative modalities such as ASL and DSC, where GM has a larger perfusion fraction than WM. Given the limited sample size (N=1) used in this work, these observations require further evaluation with in vivo acquisitions (planned).
Conclusion
We have shown that the use of STE allows to robustly quantify blood pseudo-diffusion even in voxels with complex configuration with just 16 diffusion-weighted volumes, supporting the application of IVIM in clinical settings.Acknowledgements
CMWT was supported by a Sir Henry Wellcome Fellowship (215944/Z/19/Z) and a Veni grant (17331) from the Dutch Research Council (NWO).References
1. Le Bihan, D. et al. Separation of diffusion and perfusion in intravoxel incoherent motion MR imaging. Radiology 168, 497–505 (1988).
2. Le Bihan, D. Intravoxel incoherent motion perfusion MR imaging: a wake-up call. Radiology 249, 748–52 (2008).
3. Stejskal, E. O. & Tanner, J. E. Spin Diffusion Measurements: Spin Echoes in the Presence of a Time-Dependent Field Gradient. J. Chem. Phys. 42, (1965).
4. Westin, C. F. et al. Q-space trajectory imaging for multidimensional diffusion MRI of the human brain. Neuroimage 135, 345–362 (2016).
5. Vos, S. B., Jones, D. K., Jeurissen, B., Viergever, M. A. & Leemans, A. The influence of complex white matter architecture on the mean diffusivity in diffusion tensor MRI of the human brain. Neuroimage 59, 2208–2216 (2012).
6. De Luca, A., Bertoldo, A. & Froeling, M. Effects of perfusion on DTI and DKI estimates in the skeletal muscle. Magn. Reson. Med. 78, 233–246 (2017).
7. Rydhög, A. S. et al. Separating blood and water: Perfusion and free water elimination from diffusion MRI in the human brain. Neuroimage 156, 423–434 (2017).
8. De Luca, A., Leemans, A., Bertoldo, A., Arrigoni, F. & Froeling, M. A robust deconvolution method to disentangle multiple water pools in diffusion MRI. NMR Biomed. 1–17 (2018) doi:10.1002/nbm.3965.
9. Guo, F., Leemans, A., Viergever, M. A., Dell’acqua, F. & De Luca, A. Damped Richardson-Lucy Deconvolution for Multi-Shell Diffusion MRI. in International Society for Magnetic Resonance in Medicine(2018).
10. Finkenstaedt, T. et al. The IVIM signal in the healthy cerebral gray matter: A play of spherical and non-spherical components. Neuroimage 152, 340–347 (2017).
11. Szczepankiewicz, F., Hoge, S. & Westin, C. F. Linear, planar and spherical tensor-valued diffusion MRI data by free waveform encoding in healthy brain, water, oil and liquid crystals. Data Br. 25, 104208 (2019).
12. Basser, P. J., Mattiello, J. & LeBihan, D. MR diffusion tensor spectroscopy and imaging. Biophys. J. 66, 259–67 (1994).
13. Pierpaoli, C. & Basser, P. J. Toward a quantitative assessment of diffusion anisotropy. Magn. Reson. Med. (1996).
14. Guo, F., Leemans, A., Viergever, M. A., Dell’Acqua, F. & De Luca, A. Generalized Richardson-Lucy (GRL) for analyzing multi-shell diffusion MRI data. Neuroimage 218, 116948 (2020).
15. Dell’Acqua, F., Simmons, A., Williams, S. C. R. & Catani, M. Can spherical deconvolution provide more information than fiber orientations? Hindrance modulated orientational anisotropy, a true-tract specific index to characterize white matter diffusion. Hum. Brain Mapp. 34, 2464–2483 (2013).
Figures


Fig. 3: An axial image of the fractional anisotropy (FA) number of fibers (NuFO) and fIVIM obtained with MRI data of a human brain containing both LTE and STE. fIVIM[LTE] exhibits higher values than fIVIM[STE], especially in correspondence of NuFO values above 1. fIVIM[STE] and fIVIM[STE-short] are remarkably similar showing higher value in gray matter than white matter, as expected from known physiology.
