3425
Not all voxels are created equal: reducing estimation bias in regional NODDI metrics using tissue-weighted mean1Centre for Medical Image Computing, Department of Computer Science, UCL, London, United Kingdom, 2Dementia Research Centre, Department of Neurodegenerative Disease, UCL Queen Square, Institute of Neurology, UCL, London, United Kingdom
Synopsis
Region-of-interest (ROI) metrics are typically computed as a mean over ROI voxels. However, for some NODDI metrics, this approach produces biased estimates in the presence of cerebrospinal fluid partial volume. We address this by introducing a tissue-weighted alternative. We compare the proposed mean to its conventional counterpart for periventricular and non-periventricular ROIs in healthy subjects and patients with young onset Alzheimer’s disease (YOAD). Results show the conventional mean overestimates orientation dispersion index and inflates inter-subject variation, particularly for periventricular ROIs and the YOAD cohort. This technique may improve detection of true regional effects in future group studies of neurodegenerative diseases.
Introduction
Regional microstructure estimates provide useful summary metrics for group studies. Conventional methods estimate these metrics by averaging the voxel-wise values across a region-of-interest (ROI). However, this can produce biased estimates for some parameters of Neurite Orientation Dispersion and Density Imaging (NODDI), in particular, neurite density index (NDI) and orientation dispersion index (ODI), which are properties of the tissue compartment within a voxel1. When some ROI voxels experience cerebrospinal fluid (CSF) partial volume, it can lead to voxel-wise variation in tissue fraction within the ROI, a variation ignored by the conventional mean. This can be problematic, for example, in periventricular regions whose border contains high CSF partial volume. To produce unbiased ROI means of NDI and ODI, we introduce a tissue-weighted formulation that utilises tissue fraction estimated with NODDI to account for its voxel-wise variation.Methods
TheoryNODDI models each voxel as a tissue compartment, combined with a free-water space contributed primarily from CSF partial volume. It estimates the extent of the free-water contribution in a voxel as free water fraction (FWF); the contribution of the tissue compartment by definition is TF = 1 - FWF. The conventional mean of NDI and ODI, two properties of the tissue compartment, weighs each voxel equally, ignoring the variability of TF. The tissue-weighted formulation instead estimates the ROI mean of these metrics as a weighted average across voxels within an ROI: $$${\sum_i TF_{i}M_{i}} \diagup {\sum_i TF_{i}}$$$, where $$$TF_{i}$$$ is the tissue fraction of voxel $$$i$$$ within the ROI, and $$$M_{i}$$$ the tissue property (NDI, ODI) of the voxel.
To understand the relation between the tissue-weighted and the conventional means, observe that $$${\sum_i TF_{i}M_{i}} \diagup N$$$, with $$$N$$$ being the number of voxels in an ROI, is an estimate of $$$\mathrm{E}[M \,TF]$$$, which is equal to $$$\mathrm{Ε}[M]\mathrm{Ε}[TF]+Cov(M,TF)$$$(ref. 2). As $$${\sum_i TF_{i}} \diagup {N}$$$ is an estimate of $$$\mathrm{E}[TF]$$$, the tissue-weighted mean is thus the conventional mean with an additional term, namely the covariance of M and TF divided by $$$\mathrm{E}[TF]$$$. This shows that the conventional mean is in general a biased estimate of the tissue-weighted alternative; the two are the same only when $$$Cov(M,TF)=0$$$.
Evaluation
The conventional mean and the proposed tissue-weighted mean were compared in a study of YOAD. Bias in the conventional means of all ROIs was assessed using histograms of differences and Bland-Altmann style plots. The hypothesis that bias was highest for periventricular ROIs and in YOAD was tested by examining the between-subject ROI means for non-periventricular (non-PV) and periventricular (PV) ROIs in both control and YOAD groups. To investigate the implications for group studies, changes in the ROIs between-subject mean, standard deviation and effect size (Cohens d3, control – YOAD) were examined after calculating the tissue-weighted means.
Data
Multi-shell diffusion-weighted images (DWI) were acquired in healthy controls (n=21) and age-matched YOAD patients (n=30) on a 3T Siemens Magnetom Trio Scanner using b-values of 0 (n=13), 300 (n=8), 700 (n=32) and 2000 (n=64) s/mm2 with slice thickness 2.5mm, in plane FOV (240x240)mm2 and resolution (2.5x2.5)mm2.
Processing
NODDI metrics (NDI and ODI and FWF) were fitted to artefact-corrected DWIs using AMICO1,4. DWIs and ROIs were aligned to a population-specific template using DTI-TK5. Subjects’ conventional and tissue-weighted means were calculated for 48 white matter ROIs from the JHU white matter atlas6. ROIs were manually categorised as periventricular (PV, n=29) or non-periventricular (non-PV, n=19).
Results & Discussion
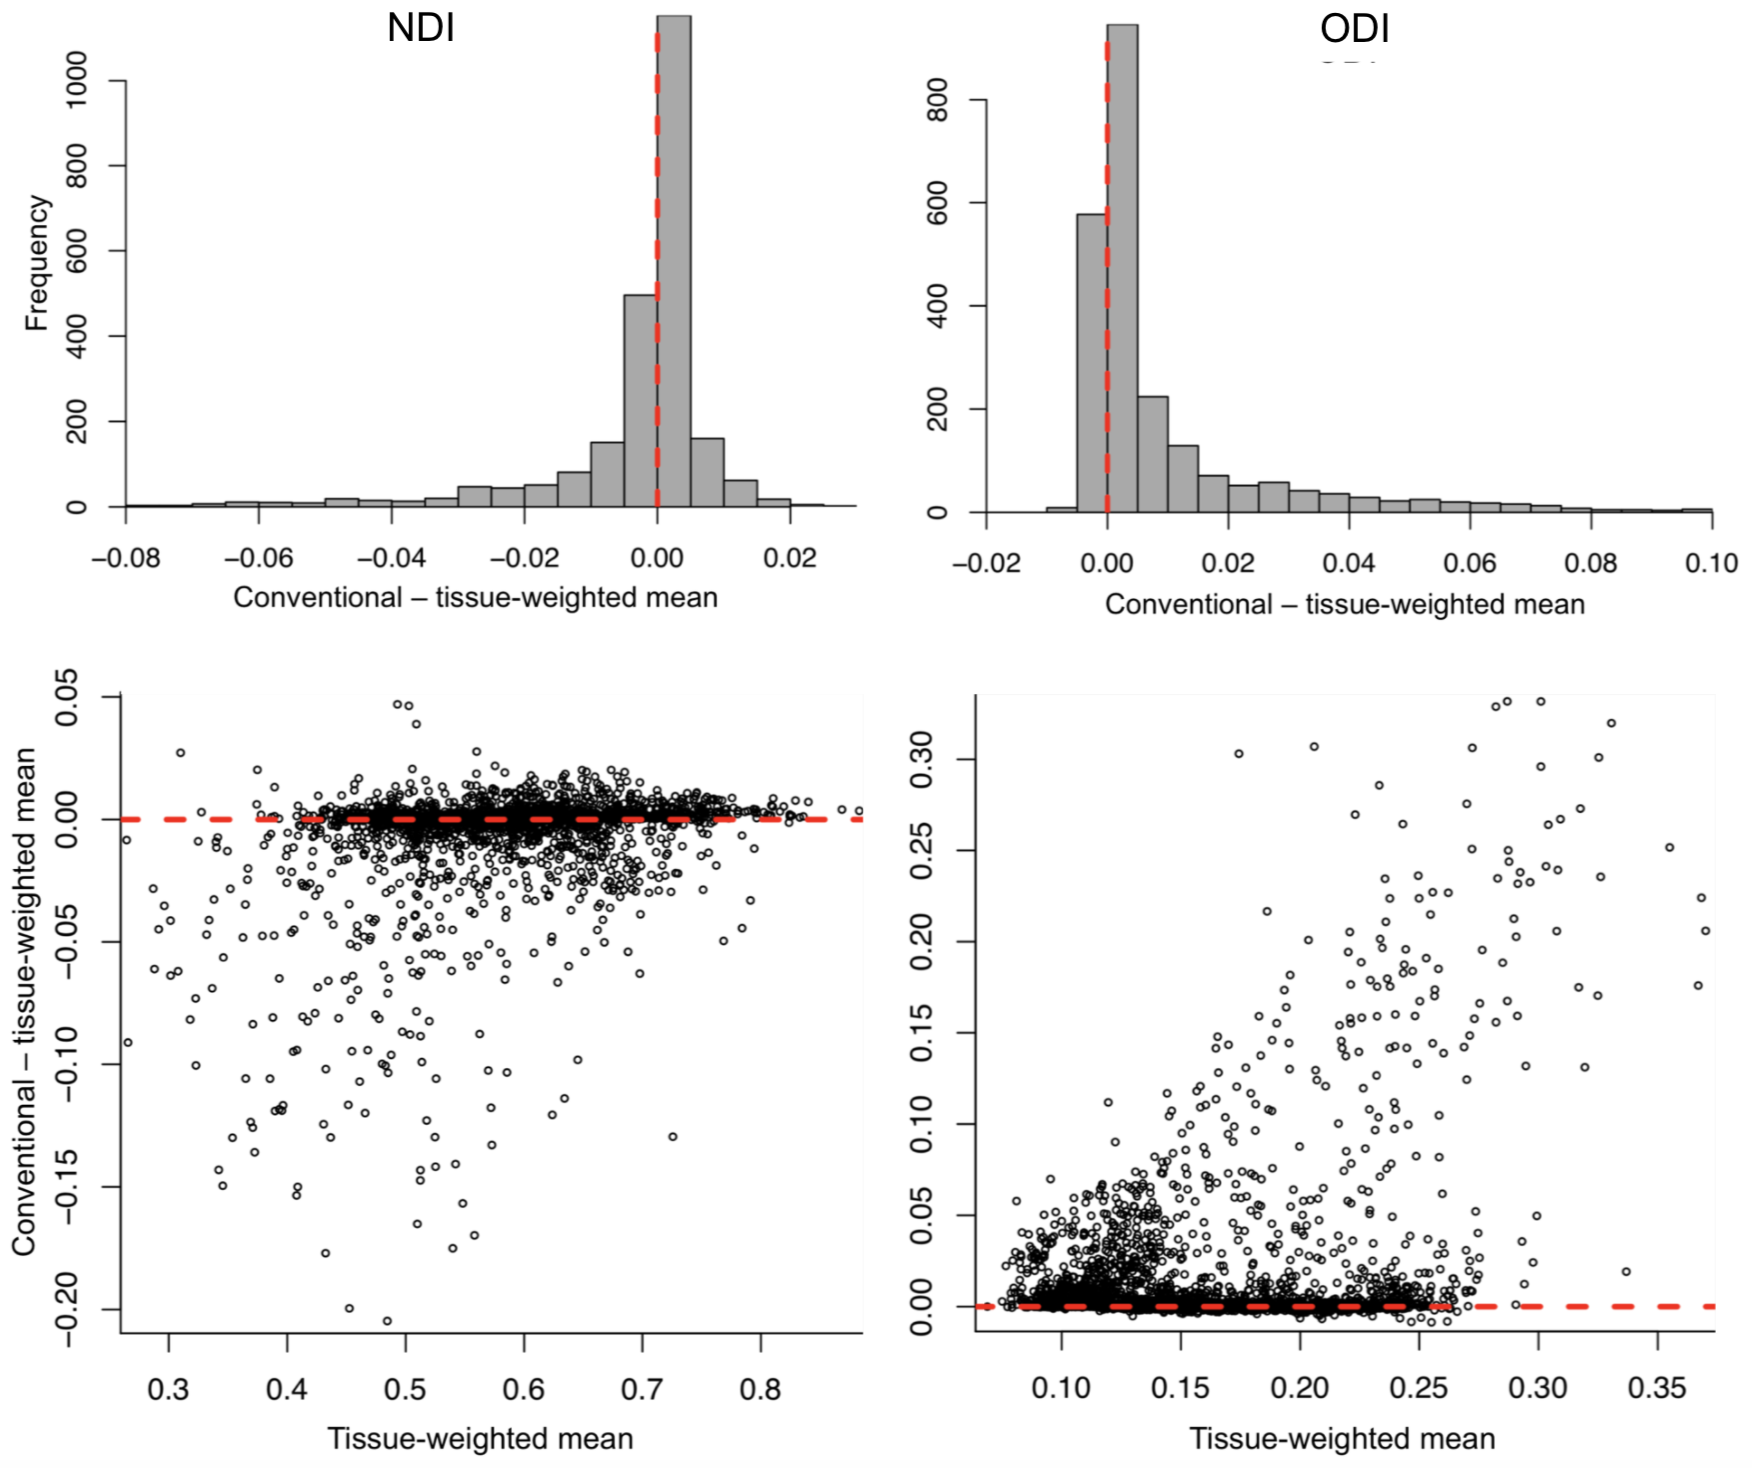
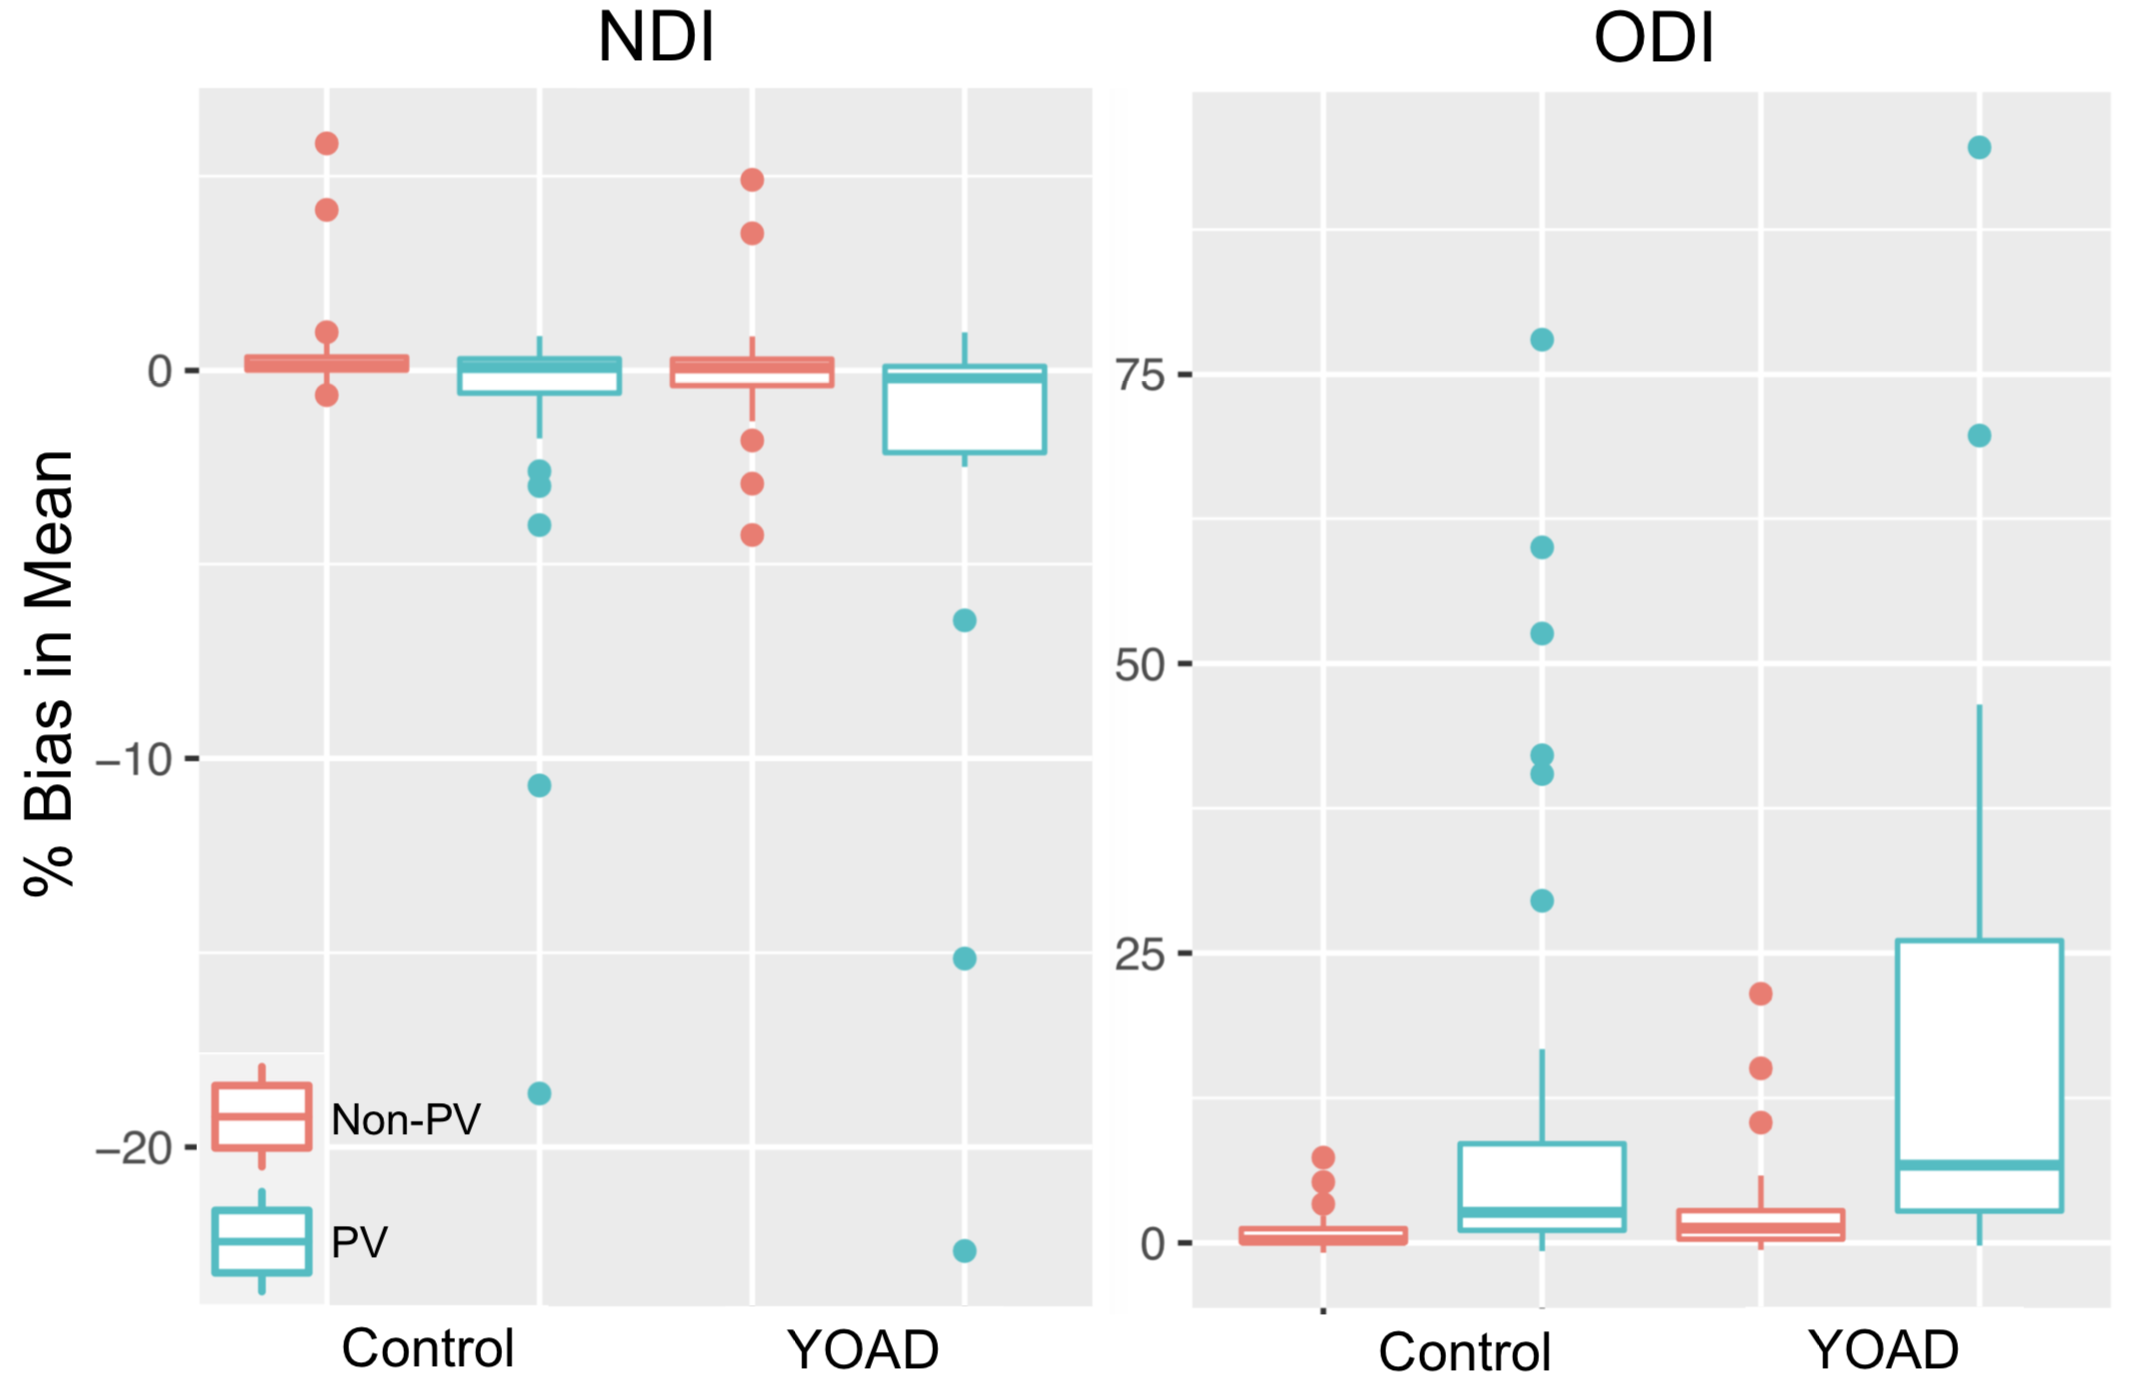
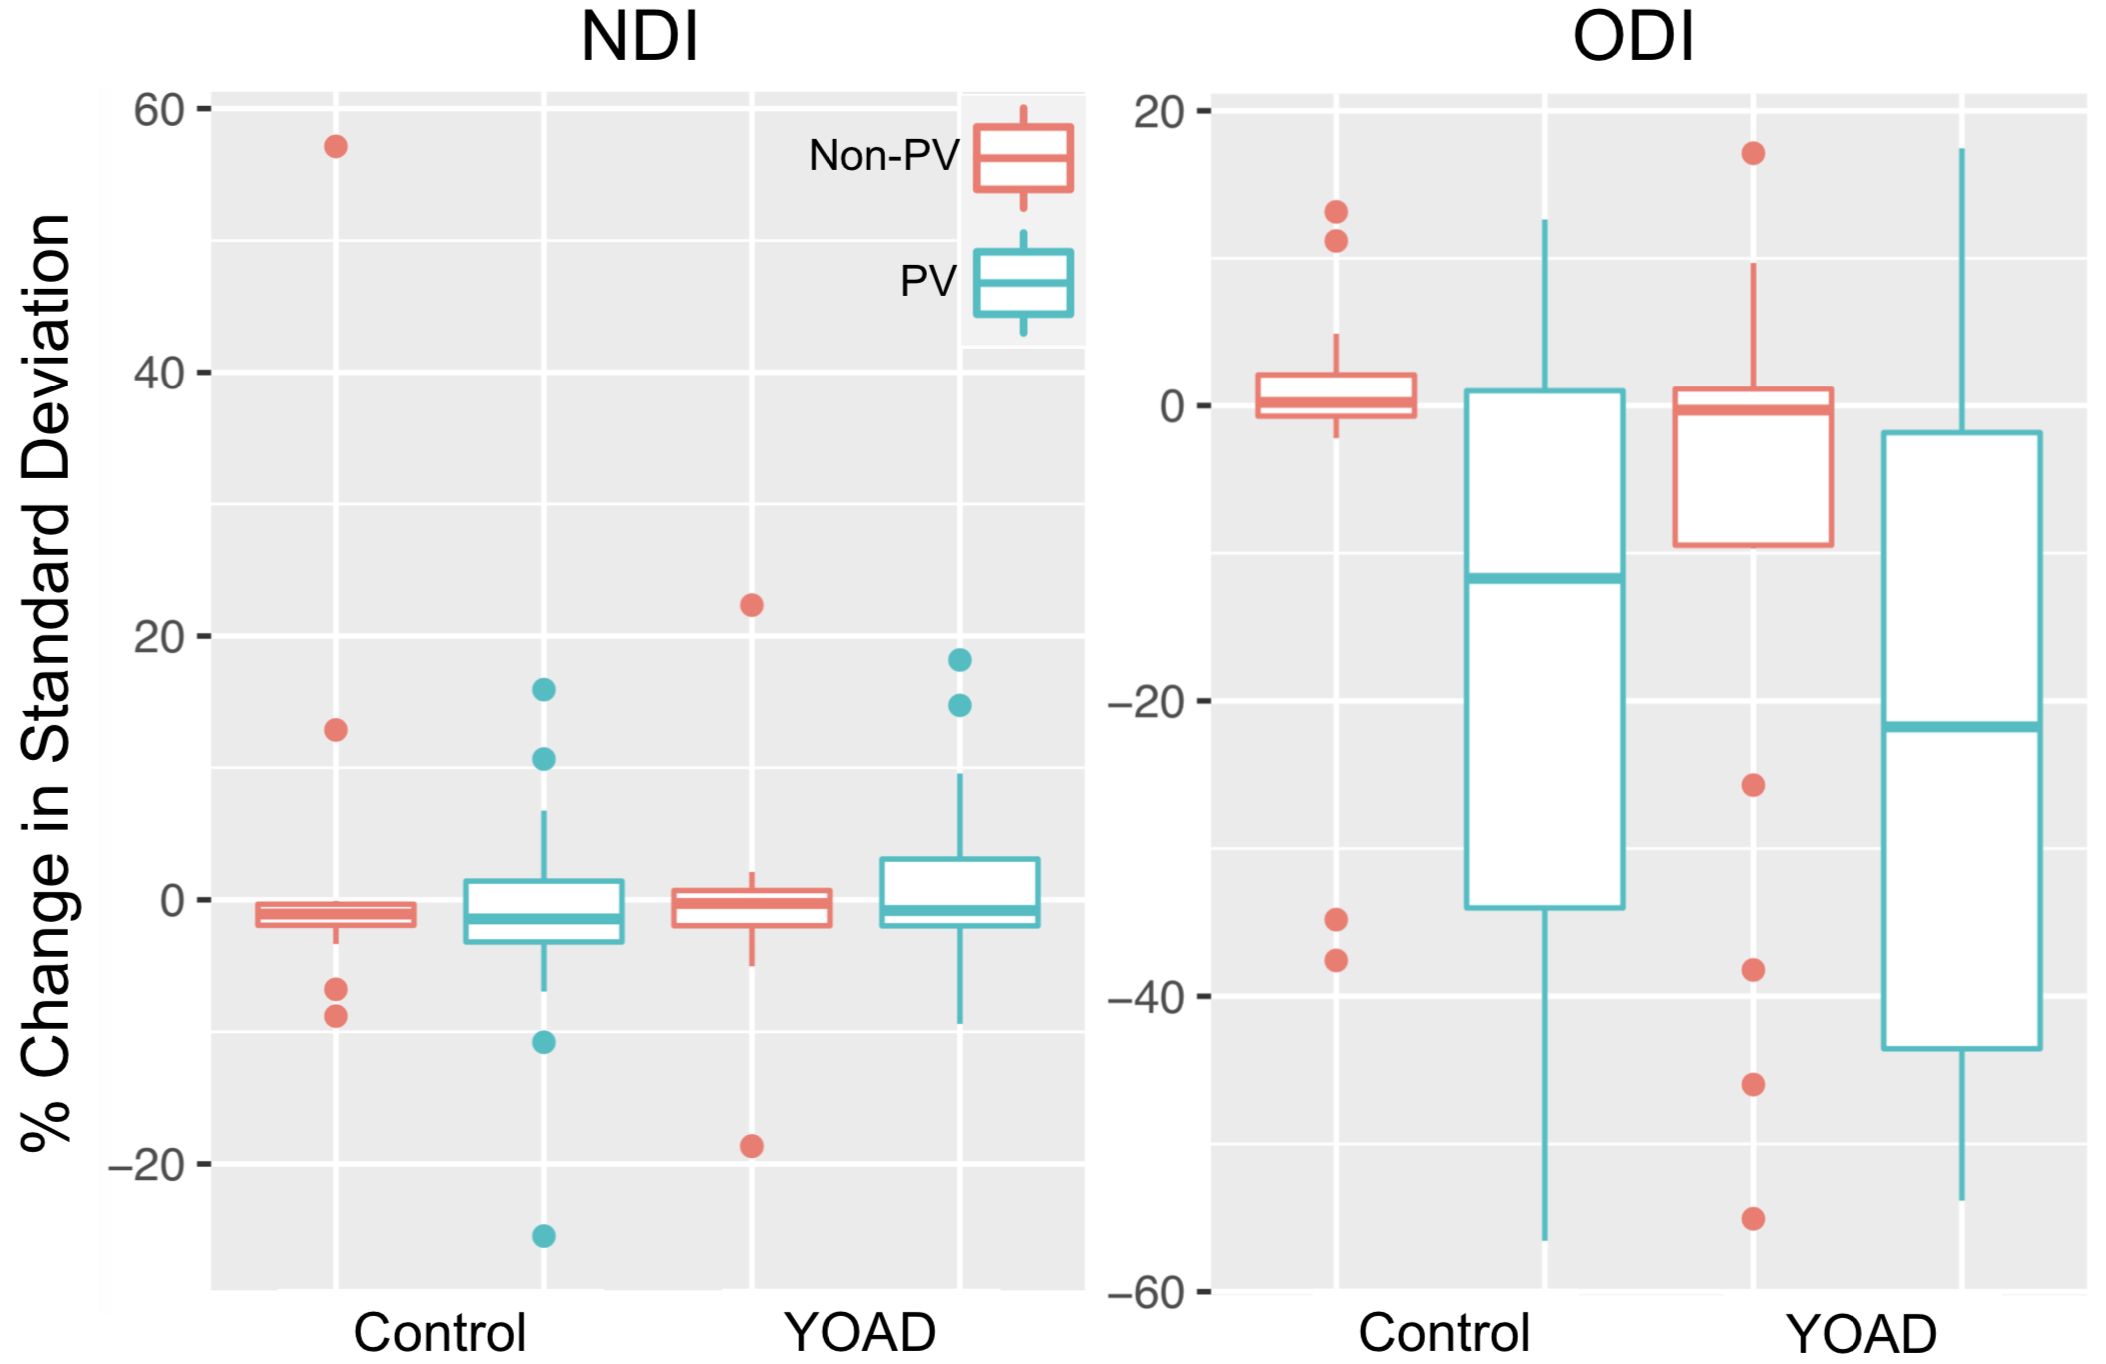
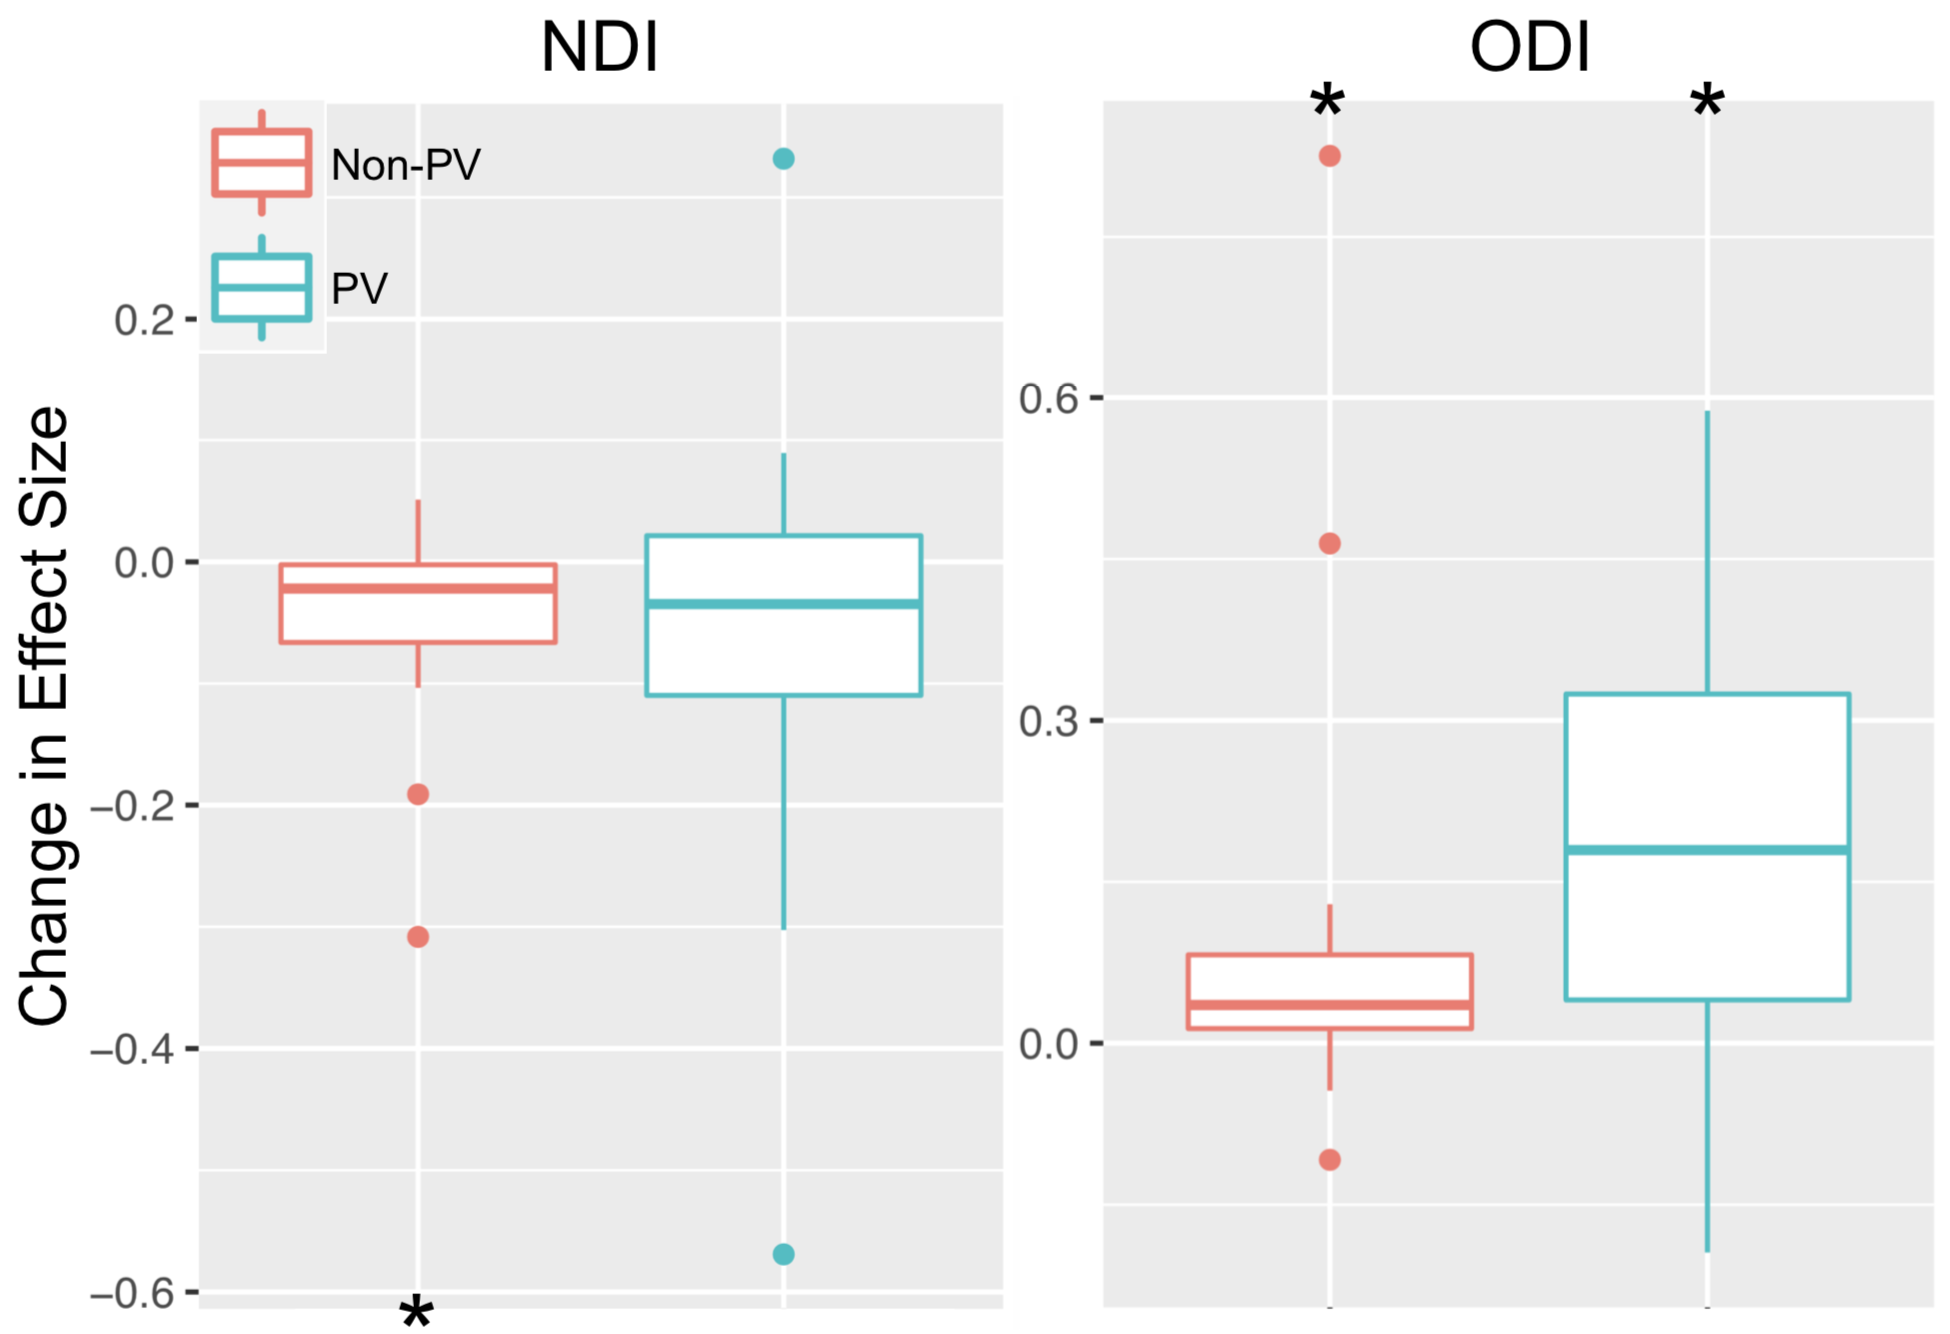
Across all ROIs the conventional mean for NDI and ODI showed significant bias, being on average under- and over-estimated, respectively (Fig. 1). The observed bias for each ROI was equivalent to the fractional covariance $$$-Cov(M,TF) \, \diagup \, \overline{TF}$$$ (R2>0.99). Conventional means had higher average ODI in control and YOAD subjects for PV and non-PV ROIs, with greatest bias in PV ROIs (Fig. 2). Importantly, each ROI group contained ROIs with significant bias. The higher bias in PV ROIs was caused by significant number of voxels with very small TF. In such voxels, NDI and ODI were indeterminate. When this happened, the fitting routine assigned 0 as the default NDI estimate, leading to lower conventional mean of NDI, and 1 as the default ODI estimate, leading to higher conventional mean of ODI.Tissue-weighted means had markedly lower between-subject standard deviation for ODI in PV ROIs, with reductions of up to 56% (Fig. 3). Changes in between-subject ROI means closely mirrored the reported bias, notably resulting in lower ODI values for all ROIs. Signed effect size for group differences increased for ODI when using tissue-weighted means compared to the conventional mean, particularly in PV ROIs, and decreased in NDI (Fig. 4). Although this may reflect greater bias reduction of group ROI means in YOAD individuals compared to controls, effect size calculations also depend on each ROIs pooled standard deviation, which was not reported here.
Conclusion
Tissue-weighted means aim to provide a tissue microstructure average that is unbiased in the presence of regional variations in tissue fraction. Results show the proposed technique provides less variable estimates of regional ODI that are also lower, particularly in PV ROIs, where the tissue-weighted mean is less biased by CSF partial volume. This may increase power to detect true effects in future and retrospective studies of neurodegenerative diseases.Acknowledgements
No acknowledgement found.References
1. Zhang, H., Schneider, T., Wheeler-Kingshott, C. A., and Alexander, D. C. NODDI: practical in vivo neurite orientation dispersion and density imaging of the human brain. Neuroimage 61, 4 (2012), 1000–1016.
2. Jukna S. (2011) Linearity of Expectation. In: Extremal Combinatorics. Texts in Theoretical Computer Science. An EATCS Series. Springer, Berlin, Heidelberg. https://doi.org/10.1007/978-3-642-17364-6_18
3. Cohen, J. Statistical power analysis for the behavioral sciences, 2nd edition, 1988.
4. Daducci, A., Canales-Rodrıguez, E. J., Zhang, H., Dyrby, T. B., Alexander, D. C., and Thiran, J.P. Acelerated microstructure imaging via convex optimization (AMICO) from diffusion MRI data. Neuroimage 105 (2015), 32–44.
5. Zhang, H., Yushkevich, P. A., Alexander, D. C., and Gee, J. C. Deformable registration of diffusion tensor MR images with explicit orientation optimization. Medical image analysis 10, 5 (2006), 764–785.
6. Mori, S., Wakana, S., Nagae-Poetscher, LM., van Zijl, PC. MRI atlas of human white matter. Amsterdam The Netherlands: Elsevier; 2005.
Figures