3424
Mapping apparent soma and neurite density in the in-vivo mouse brain using SANDI1Champalimaud Centre for the Unknown, Lisbon, Portugal, 2University College London, London, United Kingdom
Synopsis
Measuring micro-architectural features involving cell body morphologies is emerging as a frontier of diffusion MRI. This work aimed to map the apparent soma size and density and neurite density via the SANDI methodology in the mouse brain in-vivo at 9.4T. Our results show consistent parameters values between N=3 animals in both gray and white matter ROIs. Moreover, we have also compared the effects of using different number of shells and maximum b-values in the SANDI analysis. Our work augurs well for future investigations in animal models of plasticity and disease.
Introduction
Diffusion MRI is a prominent MRI modality employed to characterize tissue structure at the microscopic scale. Over the years, many different dMRI techniques have been developed for highlighting different features of the tissue investigated1,2,3,4. Among them, the SANDI approach5 has been very recently proposed to map the apparent soma size and density and neurite density based on diffusion MRI data. This is achieved by employing a 3-compartment model and powder averaged diffusion measurements over a wide range of b-values, up to very high diffusion weightings5. So far, SANDI has been employed for in-vivo human brains and ex-vivo mouse brains6, but to our knowledge, in-vivo SANDI MRI in rodents has never been reported.Here we study SANDI contrasts in the in-vivo mouse brain and investigate the possibility of optimizing acquisition time using protocols with fewer shells and lower maximum b-values.
Methods
Acquisition: All experiments were performed after approval from the institutional ethics committee and in accordance with European Directive 2010/63. Diffusion weighted data from N=3 C57BL/6J mice (37-47 weeks) were acquired on a 9.4T Bruker Biospec scanner equipped with an 86 mm quadrature transmission coil and 4-element array reception cryocoil. Briefly, mice were induced with 5% isofluorane and maintained at 2%, and their temperature and breathing rate were continuously monitored. SANDI datasets were acquired using a PGSE-EPI sequence with the following parameters: TE=36.8ms, TR=4s, 4 averages, slice thickness = 0.4mm, 35 slices, in plane resolution = 0.12x0.12mm, matrix size = 118x100, Partial Fourier =1.35, per-slice triggering and fat suppression. Diffusion parameters: 8 b-values: 1000, 2500, 4000, 5500, 7000, 8500, 10000 and 12500 ms/mm2 with 40 directions each (equidistributed on a sphere) and 16 b0 images; the chosen diffusion timing parameters (Δ/δ = 20/5.5 ms) are appropriate for soma mapping7.Post-processing: For each animal, images were rigidly registered, normalized, and then powder averaged over each shell8.
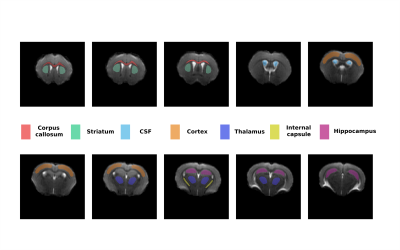
Data analysis: The data was fitted using the 3-compartment SANDI model (spheres, sticks and Gaussian diffusion) with custom code written in Matlab® (The Mathworks, Nattick, MA, USA) using a Random Forest regression algorithm trained on simulated data with the intra-sphere diffusivity of 2 μm2/ms5. Diffusion kurtosis tensor was also fitted to data with b<5000 ms/mm2, using custom code written in Matlab®. The SANDI parameters were then analysed in different manually defined ROIs (shown in Figure 2) as well as for 3 subprotocols with 7, 6 and 5 shells obtained by removing the highest b-values.
Results
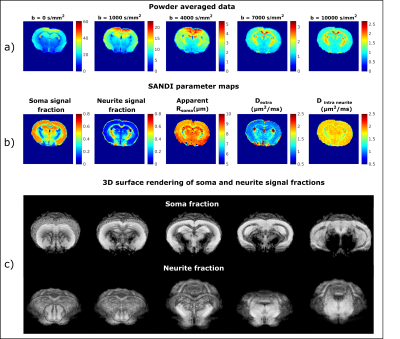
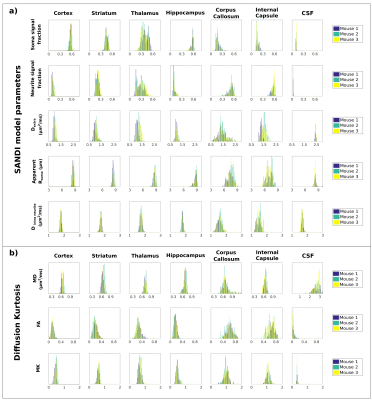
Figure 1a) presents the powder averaged diffusion data for different b values from one representative mouse; the contrasts are qualitatively consistent between animals even at very high b-values. Figure 1b) illustrates the SANDI parameter maps; the contrasts are consistent with previous ex-vivo mouse brain SANDI maps5, with high soma signal fraction (fsoma) in GM, high neurite signal fraction (fneurite) in WM and large extracellular signal fraction in CSF. Figure 1c) further shows 3D surface renderings of the soma and neurite density maps at different positions.Figure 3 presents the histograms of SANDI and DKI parameters for the 3 animals in different ROIs. In the cortex and WM ROIs, the histograms show tight distributions, while in striatum, thalamus and hippocampus, the distributions are wider, reflecting the tissue heterogeneity. The mean and standard deviation of SANDI parameters are given in Table 1. Although the distributions do not have the same median (null hypothesis rejected in Kruskal-Wallis test in most ROIs), the differences between the mean values are generally very small, on the order of 1% in most ROIs. One exception is Dextra which shows lower values in several ROIs in Mouse 1, and thus appears to explain the slightly lower mean diffusivity observed when fitting the DKI model.
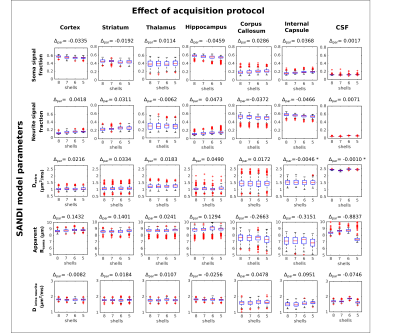
When decreasing the acquisition protocol from 8 to 5 shells (Figure 4), the estimated parameters are still stable, nevertheless, there is a slight shift in both fsoma and fneurite. For instance, in the cortex, fsoma slightly decreases, and fneurite slightly increases, while in the WM ROIs the trends are reversed. These results show, nevertheless, that it is possible to further accelerate the data acquisition without significant loss of information.
Discussion
SANDI was harnessed for the first time to study the in-vivo mouse brain, and we evaluated the estimated parameters across different ROIs and animals, as well as the effect of different number of shells. The parameters follow expected patterns with high fsoma in GM and high fneurite in WM. The fsoma in CSF is around 0.1, which can reflect both partial volume effects, as well as a plateau value reached due to Rician noise9, although it has been incorporated in the fitting routine. Limitations: this study involved a small number of animals and only a limited number of sub-protocols. Future work will include more animals and repeated measurements, as well as other combinations of b-shells.Conclusion
This work shows that it is feasible to employ SANDI in the mouse brain, in-vivo, and the parameters are consistent across different animals. Moreover, the acquisition protocol can be further shortened and optimised compared to the one from this study. This augurs well for future studies in animal models where cell body morphology could become an important biomarker.Acknowledgements
AI's work received the support of a fellowship from ”la Caixa” Foundation (ID 100010434) and from the European Union’s Horizon 2020 research and innovation programme under the Marie Skłodowska-Curie grant agreement No 847648. The fellowship code is LCF/BQ/PI20/11760029; NS is supported by European Research Council (ERC) (agreement No. 679058); FF, JC and CC are supported by Champalimaud Centre for the Unknown, Lisbon (Portugal); MP is supported by UKRI Future Leaders Fellowship MR/T020296/1. The vivarium of the Champalimaud Foundation, is a research facility part of CONGENTO, project number Lisboa-01-0145-FEDER-022170.References
1. Alexander et al, Imaging brain microstructure with diffusion MRI: practicality and applications, NMRBiomed (2018) 32(4): e3841
2. Novikov et al, Quantifying brain microstructure with diffusion MRI: Theory and parameter estimation, NMRBiomed (2018) 32(4): e3998
3. Jelescu et al, Challenges for biophysical modeling of microstructure, J Neurosci Methods (2020), 344:108861
4. Veraart et al, Noninvasive quantification of axon radii using diffusion MRI, eLife (2020) 9:e49855
5. Palombo et al, SANDI: A compartment-based model for non-invasive apparent soma and neurite imaging by diffusion MRI. NeuroImage (2020), 215:116835
6. Palombo et al, Histological validation of the brain cell body imaging with diffusion MRI at ultrahigh field, ISMRM, 2019.
7. Ianus et al, Mapping complex cell morphology in the grey matter with double diffusion encoding MRI: a simulation study (2020), https://arxiv.org/abs/2009.11778
8. Callaghan et al Diffusion of water in the endosperm tissue of wheat grains as studied by pulsed field gradient nuclear magnetic resonance Biophysical journal. (1979) 28:133–141
9. Afzali et al SPHERIOUSLY? The challenges of estimating spherical pore size non-invasively in the human brain from diffusion MRI (2020), bioRxiv, doi: https://doi.org/10.1101/2020.11.06.371740
Figures


