3423
Estimating cortical soma and neurite densities from diffusion MRI measures using a machine learning approach1Department of Radiology, Children's Hospital of Philadelphia, Philadelphia, PA, United States, 2Department of Bioengineering, University of Pennsylvania, Philadelphia, PA, United States, 3Department of Physics, University of Washington Seattle, Seattle, WA, United States, 4Department of Neurology, University of Pennsylvania, Philadelphia, PA, United States, 5Department of Radiology, University of Pennsylvania, Philadelphia, PA, United States
Synopsis
Diffusion MRI (dMRI) has ushered in a new era in which conventional brain cortical histological measures such as soma and neurite densities may be assessed noninvasively through advanced dMRI. However, analytical dMRI microstructural models are restricted by the model assumptions and lack of validation from quantitative histology data. Individual dMRI parameters characterize only limited microstructural information. By leveraging a variety of dMRI-based parameters delineating cortical microstructure from multiple aspects, we established a machine learning based method accurately estimating cortical soma and neurite densities in the cortex, paving the way for data-driven noninvasive virtual histology for potential applications to Alzheimer’s diseases.
Purpose
Diffusion MRI (dMRI) has ushered in a new era in which conventional brain cortical histological measures such as soma and neurite densities may be assessed noninvasively through advanced dMRI1-9. However, analytical dMRI microstructural models are restricted by the model assumptions and lack of validation from quantitative histology data. Individual dMRI parameters characterize only limited microstructural information. Besides DTI-based metrics which are sensitive to brain microstructures10,11, metrics derived from diffusion kurtosis imaging (DKI) are sensitive to neurofilament density in the cerebral cortex9. Here, by leveraging a variety of high resolution dMRI-based parameters delineating cortical microstructure from multiple aspects, we established a machine learning based method accurately estimating cortical soma and neurite densities in the cortex.Methods
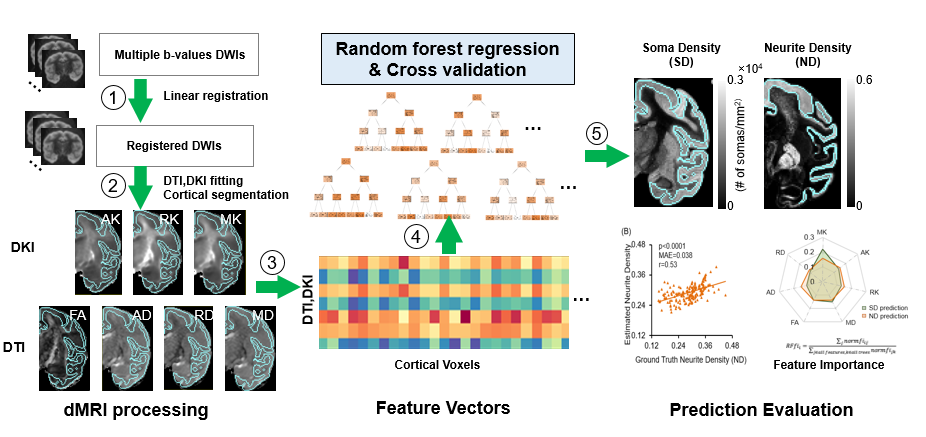
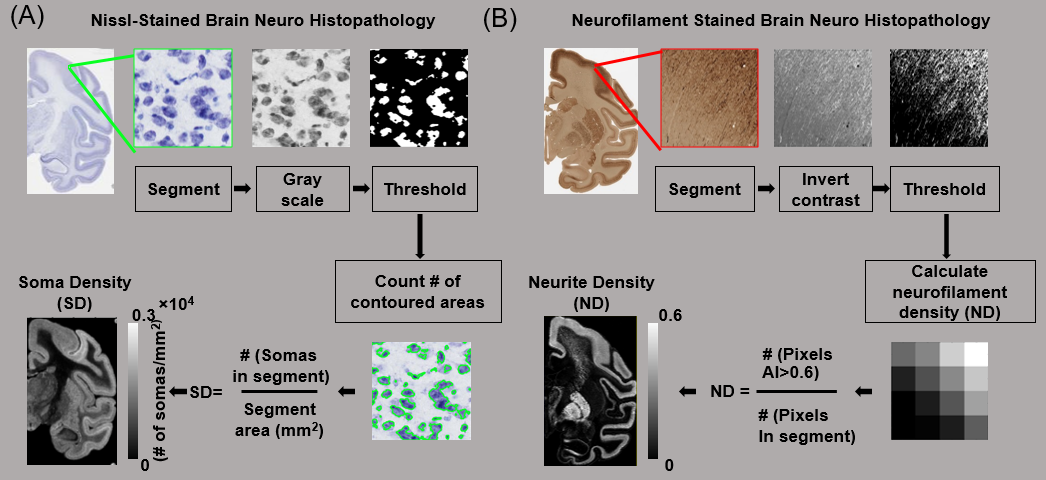
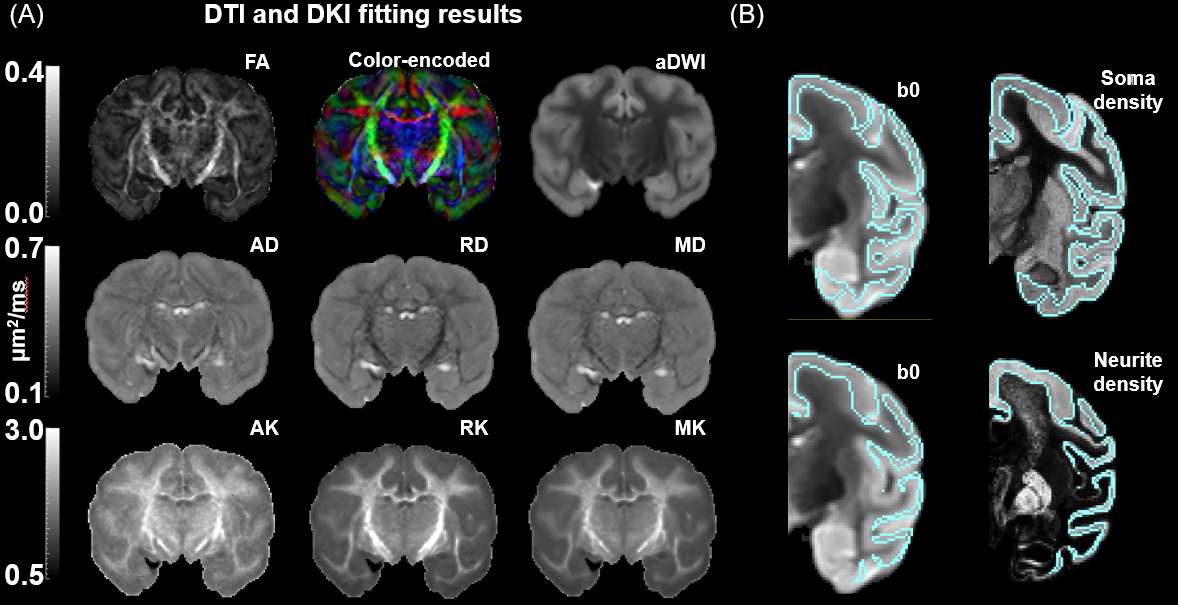
The method overview is shown in Fig.1. DMRI (Fig 1 left panel): High resolution dMRI acquisitions with two b-values (b=1500s/mm2, b=4500s/mm2) and 30 independent gradient directions were performed on a normal postmortem Rhesus macaque brain. DMRI coronal slices were oriented to be consistent with coronal slices in histology12 (brainmaps.org). DMRI parameters were: In-plane resolution: 0.6×0.6mm FOV=100×100×72mm, in plane imaging matrix=166×166, slice thickness=2mm, TR/TE=2100/77.8ms, NSA=24, 2 repetitions for each b-value. DTI and DKI fitting (Fig 1 left panel): After correction current distortion of eddy and affine registration of diffusion weighted images, diffusion tensor and kurtosis were fitted. Axial (AK), radial (RK) and mean kurtosis (MK) as well as fractional anisotropy (FA), axial (AD), radial (RD) and mean diffusivity (MD) (Fig 3A) maps were obtained. Quantification of soma and neurite densities from histological images: As shown in Fig 2A, for measuring soma density (SD), the Nissl-stained histology images of resolution 0.46 µm/pixel were blocked into segments of 512 × 512 pixels with each segment size of 0.24 × 0.24 mm. Each segment is converted to gray scale and threshold. SD is defined as number of contoured areas/ segment area in mm2. The calculated SD map agrees well with soma density from histology studies13. As shown in Fig 2B, for measuring neurite density (ND) based on histological image, a structure tensor was computed for every pixel in the histological image14. Pixels with Anisotropy Index (AI) > 0.6 were classified as fiber structure. The neurofilament stained images were blocked into segments of 512 × 512 pixels with each segment size of 0.24 × 0.24 mm. In each blocked segment, the ratio of the area classified as fiber structure to the blocked area was defined ND. Histology-MRI registration and cortical segmentation: Neurofilament histology slice was converted to grayscale and affine registered to b0. ND map was registered to b0 using the same transformation.SD map was directly affine registered to b0. Cortical areas were segmented based on intensity and overlapping regions on b0 and histology. The segmentation results are shown in Fig.3B. Random forest (RF) regression to estimate soma and neurite densities: RF regression was implemented in Scikit-learn15. The cortical masks were applied to AK, RK, MK, FA, AD, RD, MD, SD, and ND maps and each voxel in the cortical mask served as a training sample. A RF regressor with max-depth=7, number of estimators=1000, max-number of features=5, and mean squared error (MSE) loss was used to predict SD. For predicting ND, max-depth=7, number of estimators=1000, max-number of features=3 and MSE was used. Model performance was evaluated using five-fold cross-validation, and average feature importance were extracted.Results
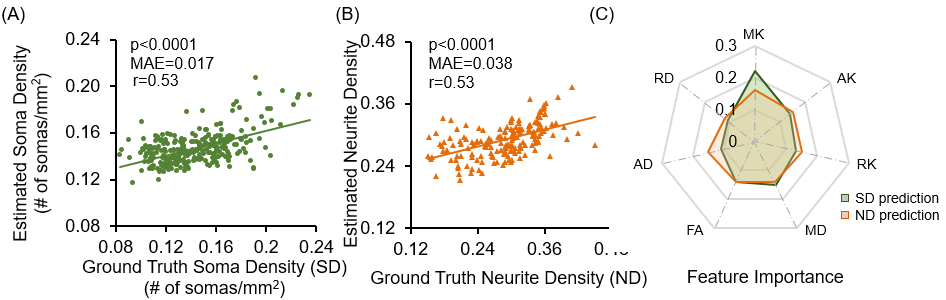
Fig 4 shows estimation results in one validation set. Both the estimated SD (Fig 4A) and the ND(Fig 4B) correlate significantly with ground-truth values. (P<0.0001, Pearson correlation coefficient r=0.53 and r=0.53 respectively). Across five folds, the average mean absolute error (MAE) for predicting soma density is 0.02×10⁴ somas/mm2, with average r=0.46 for correlation between predicted and ground truth soma density. The MAE for predicting neurite density is 0.04, with average r=0.49 for the correlation. Fig. 4C shows the feature importance. DKI-derived MK ranks the first in feature importance in estimating both soma and neurite densities. For estimating ND, AD, AK, RK also have high importance.Discussion and Conclusion
We have built a machine learning based method to infer cortical soma and neurite densities directly from dMRI measures. To the best of our knowledge, this is the first study estimating cortical histological measures using machine learning of a variety of dMRI-derived measurements, filling the gap between MRI contrasts and cell densities quantified from histology. DMRI-derived metric maps (Fig 3) demonstrate high resolution and high SNR to delineate microstructure of the cerebral cortex, despite relatively smaller size of macaque brains compared to that of human brains. DKI measures in general achieved higher feature importance than DTI measures, consistent with previous studies9. Furthermore, highest importance of MK in both SD and ND predictions shows it as a good candidate for inputs to more advanced modeling. The relatively high feature importance of axial and radial measures (AD, AK, RK) for predicting ND is consistent with the fibrous structure of neurites and serves as a feature-engineering step for future, more advanced analytical and machine learning models. This study can be further improved by adopting better MRI-histology registration and larger datasets. Our study demonstrates the possibility for potentially paradigm-shifting data-driven virtual histology in Alzheimer’s disease with dMRI.Acknowledgements
This study is funded by NIH MH092535, MH092535-S1 and HD086984.References
1. Stanisz, G. J., Wright, G. A., Henkelman, R. M., & Szafer, A. (1997). An analytical model of restricted diffusion in bovine optic nerve. Magnetic Resonance in Medicine, 37(1), 103-111.
2. Jensen, J. H., Helpern, J. A., Ramani, A., Lu, H., & Kaczynski, K. (2005). Diffusional kurtosis imaging: the quantification of non‐gaussian water diffusion by means of magnetic resonance imaging. Magnetic Resonance in Medicine: An Official Journal of the International Society for Magnetic Resonance in Medicine, 53(6), 1432-1440.
3. Zhou, X. J., Gao, Q., Abdullah, O., & Magin, R. L. (2010). Studies of anomalous diffusion in the human brain using fractional order calculus. Magnetic resonance in medicine, 63(3), 562-569.
4. Jespersen, S. N., Kroenke, C. D., Østergaard, L., Ackerman, J. J., & Yablonskiy, D. A. (2007). Modeling dendrite density from magnetic resonance diffusion measurements. Neuroimage, 34(4), 1473-1486.
5. Zhang, H., Schneider, T., Wheeler-Kingshott, C. A., & Alexander, D. C. (2012). NODDI: practical in vivo neurite orientation dispersion and density imaging of the human brain. Neuroimage, 61(4), 1000-1016.
6. Le Bihan, D., & Johansen-Berg, H. (2012). Diffusion MRI at 25: exploring brain tissue structure and function. Neuroimage, 61(2), 324-341.
7. Alexander, D. C., Dyrby, T. B., Nilsson, M., & Zhang, H. (2019). Imaging brain microstructure with diffusion MRI: practicality and applications. NMR in Biomedicine, 32(4), e3841.
8. Novikov, D. S., Fieremans, E., Jespersen, S. N., & Kiselev, V. G. (2019). Quantifying brain microstructure with diffusion MRI: Theory and parameter estimation. NMR in Biomedicine, 32(4), e3998.
9. Zhu, T., Peng, Q., Ouyang, A., & Huang, H. (2020). Neuroanatomical underpinning of diffusion kurtosis measurements in the cerebral cortex of healthy macaque brains. Magnetic Resonance in Medicine.
10. Song, S. K., Sun, S. W., Ju, W. K., Lin, S. J., Cross, A. H., & Neufeld, A. H. (2003). Diffusion tensor imaging detects and differentiates axon and myelin degeneration in mouse optic nerve after retinal ischemia. Neuroimage, 20(3), 1714-1722.
11. Song, S. K., Sun, S. W., Ramsbottom, M. J., Chang, C., Russell, J., & Cross, A. H. (2002). Dysmyelination revealed through MRI as increased radial (but unchanged axial) diffusion of water. Neuroimage, 17(3), 1429-1436.
12. Mikula, S., Trotts, I., Stone, J. M., & Jones, E. G. (2007). Internet-enabled high-resolution brain mapping and virtual microscopy. Neuroimage, 35(1), 9-15.
13. Carlo, C. N., & Stevens, C. F. (2013). Structural uniformity of neocortex, revisited. Proceedings of the National Academy of Sciences, 110(4), 1488-1493.
14. Budde, M. D., & Frank, J. A. (2012). Examining brain microstructure using structure tensor analysis of histological sections. Neuroimage, 63(1), 1-10.
15. Pedregosa et al Scikit-learn: Machine Learning in Python., JMLR 12, pp. 2825-2830, 2011.
Figures