3421
Effect of the training set on supervised-learning parameter estimation: Application to the Standard Model of diffusion in white matter
Ying Liao1, Santiago Coelho1, Jelle Veraart1, Els Fieremans1, and Dmitry S. Novikov1
1Radiology, NYU School of Medicine, New York, NY, United States
1Radiology, NYU School of Medicine, New York, NY, United States
Synopsis
Maximum likelihood estimation is challenging in multicompartmental models due to the degeneracy of the optimization landscape. As a result, machine learning (ML) methods are often applied for parameter estimation, interpolating the mapping of measurements to model parameters. Such mapping can essentially depend on the training set (prior), decreasing the sensitivity to the measurements, and yielding artificially “clean” maps. Here we quantify the effect of the training set on the Standard Model of diffusion in white matter as function of signal-to-noise ratio, in simulations and in vivo.
Introduction
Biophysical models1-7 of diffusion MRI (dMRI) have shown great promise in revealing tissue microstructure in white matter (WM). However, estimating parameters by maximum likelihood remains a difficult task due to the degeneracy8 of the optimization landscape. As a result, machine learning9 rises in popularity for its robustness in parameter estimation. Training is an essential step in machine learning, allowing the regressor to learn the mapping of measurements to model parameters in the presence of noise. In this study, we will show the effect of prior distribution used for regressor training on the parameter estimation both in simulation and in in-vivo data.Methods
Simulation: Standard model (SM)6,7 was employed for the generation of synthetic dMRI data. A polynomial regressor (up to order 3) was adopted to learn the mapping from the rotational invariants6,9 (up to $$$\ell=2$$$) of the synthetic dMRI data to SM parameters $$$x=\{f,\ D_{a},\ D_{e}^{\parallel},\ D_{e}^{\bot},\ p_2\}$$$. The acquisition protocol was the same as for the in-vivo data (see below). A distribution of parameters that mimics the in-vivo data was used as the test set, while the training set was a box-shaped distribution with the bounds moving in order to alter the mean of prior distribution $$$\mu_{x}^{p}$$$ for SM parameter $$$x$$$, as shown in Figure 1. For each SNR level, Rician noise was added both to the training set and to the test set. The mean of the prior distribution $$$\mu_{x}^{p}$$$ of a given SM parameter and the mean of its estimates $$$\mu_{x}^{e}$$$ over the test set were extracted. After that, a linear regression was performed for the mean of parameter estimates with respect to the mean of the prior, as shown in Figure 2, to estimate the sensitivity to the prior: $$$\partial\mu_{x}^{e}/\partial\mu_{x}^{p}$$$. Cross-terms $$$\partial\mu_{x}^{e}/\partial\mu_{y}^{p}$$$, i.e., sensitivity of parameter $$$x$$$ to the prior of parameter $$$y$$$, can be estimated similarly.In-vivo data: The in-vivo data came from a 30-year-old healthy female who was scanned on a Siemens 3T Prisma scanner. The protocol employed was 11 b0 images, 30 directions for b=250, 1000, 2000, 3000 s/mm2 each and 64 directions for b=5000, 7500, 9600 s/mm2 each. The data was first processed by DESIGNER10,11 for denoising, de-gibbsing, eddy correction and rician correction. Then the rotational invariants up to $$$\ell=2$$$ were derived for each shell and mapped to SM parameters by the pre-trained regressor. Each voxel was estimated independently through the regressor of a given SNR. The SNR of each voxel is derived by dividing mean b0 values by its noise level estimated from MP-PCA denoising11 within the DESIGNER pipeline. 5 ROIs (PLIC, ACR, SCR, PCR, SLF) were selected for the study because these WM ROIs share similar parameter distribution and are free from pulsation artifact or gibbs ringing as they are away from ventricles. Noise was added to the in-vivo data at different levels to demonstrate the effect of prior distribution on parameter estimation under different SNR. The same prior distribution was taken for in-vivo data as for the synthetic data.
Results
According to Figure 3, $$$\partial\mu_{x}^{e}/\partial\mu_{x}^{p}$$$ increases at low SNR, asymptotically approaching its maximal value of 1 (i.e., we are estimating solely the prior, being completely insensitive to the measurement). Specifically, for $$$p_2$$$ and $$$D_{e}^{\perp}$$$, the insensitivity to measurement occurs at about SNR=1 at $$$b=0$$$, while for $$$D_{e}^{\parallel}$$$, this happens already for SNR$$$\approx$$$10. As SNR rises, the slope decreases and plateaus roughly between SNR = 20 and 50 (the realistic experimental range), where the transition regime varies slightly between parameters. The lower the slope $$$\partial \mu_{x}^{e}/\partial \mu_{x}^{p}$$$, the less the estimation relies on the prior distribution, and the more faithful the estimator is to the measurement. The sensitivity to prior $$$\partial\mu_{x}^{e}/\partial \mu_{x}^{p}$$$ derived from in-vivo data, as shown in Figure 4, is similar to the values obtained from simulation in the same SNR regime, which confirms the effect that a shift of the mean of the prior $$$\mu_{x}^{p}$$$ will move the mean of the estimates $$$\mu_{x}^{e}$$$ in the same direction in a roughly linear manner. Figure 5 of in-vivo data further confirms the finding in simulation that the slope $$$\partial\mu_{x}^{e}/\partial\mu_{x}^{p}$$$ is a function of SNR and increases as SNR decreases. Polynomial regression with order lower than 3 has shown similar results, suggesting this effect might be universal in supervised-learning and independent of the specific form of a regressor.Conclusion
The prior distribution used for training the regressor will shift the parameter estimates and potentially lead to bias. This effect increases with decreasing SNR and is practically important for experimentally relevant SNR ranges. We believe this is an effect common in supervised-learning independent of the specific form of regressors. Caution needs to be taken in choosing the prior distribution and interpreting parametric maps in particular for low SNR as often observed in clinical research protocols.Acknowledgements
Research was supported by the National Institute of Neurological Disorders and Stroke of the NIH under awards R01 NS088040, National Institute of Biomedical Imaging and Bioengineering under awards R01 EB027075, and by the Hirschl foundation, and was performed at the Center of Advanced Imaging Innovation and Research (CAI2R, www.cai2r.net), a Biomedical Technology Resource Center supported by NIBIB with the award P41 EB017183.References
- Kroenke, C. D., Ackerman, J. J., & Yablonskiy, D. A. (2004). On the nature of the NAA diffusion attenuated MR signal in the central nervous system. Magnetic Resonance in Medicine: An Official Journal of the International Society for Magnetic Resonance in Medicine, 52(5), 1052-1059.
- Assaf, Y., Freidlin, R. Z., Rohde, G. K., & Basser, P. J. (2004). New modeling and experimental framework to characterize hindered and restricted water diffusion in brain white matter. Magnetic Resonance in Medicine: An Official Journal of the International Society for Magnetic Resonance in Medicine, 52(5), 965-978.
- Fieremans, E., Jensen, J. H., & Helpern, J. A. (2011). White matter characterization with diffusional kurtosis imaging. Neuroimage, 58(1), 177-188.
- Jespersen, S. N., Kroenke, C. D., Østergaard, L., Ackerman, J. J., & Yablonskiy, D. A. (2007). Modeling dendrite density from magnetic resonance diffusion measurements. Neuroimage, 34(4), 1473-1486.
- Zhang, H., Schneider, T., Wheeler-Kingshott, C. A., & Alexander, D. C. (2012). NODDI: practical in vivo neurite orientation dispersion and density imaging of the human brain. Neuroimage, 61(4), 1000-1016.
- Novikov, D. S., Veraart, J., Jelescu, I. O., & Fieremans, E. (2018). Rotationally-invariant mapping of scalar and orientational metrics of neuronal microstructure with diffusion MRI. NeuroImage, 174, 518-538.
- Novikov, D. S., Fieremans, E., Jespersen, S. N., & Kiselev, V. G. (2019). Quantifying brain microstructure with diffusion MRI: Theory and parameter estimation. NMR in Biomedicine, 32(4), e3998.
- Jelescu, I. O., Veraart, J., Fieremans, E., & Novikov, D. S. (2016). Degeneracy in model parameter estimation for multi‐compartmental diffusion in neuronal tissue. NMR in Biomedicine, 29(1), 33-47.
- Reisert, M., Kellner, E., Dhital, B., Hennig, J., & Kiselev, V. G. (2017). Disentangling micro from mesostructure by diffusion MRI: a Bayesian approach. Neuroimage, 147, 964-975
- Ades-Aron, B., Veraart, J., Kochunov, P., McGuire, S., Sherman, P., Kellner, E., ... & Fieremans, E. (2018). Evaluation of the accuracy and precision of the diffusion parameter EStImation with Gibbs and NoisE removal pipeline. NeuroImage, 183, 532-543.
- Veraart, J., Novikov, D. S., Christiaens, D., Ades-Aron, B., Sijbers, J., & Fieremans, E. (2016). Denoising of diffusion MRI using random matrix theory. Neuroimage, 142, 394-406.
Figures
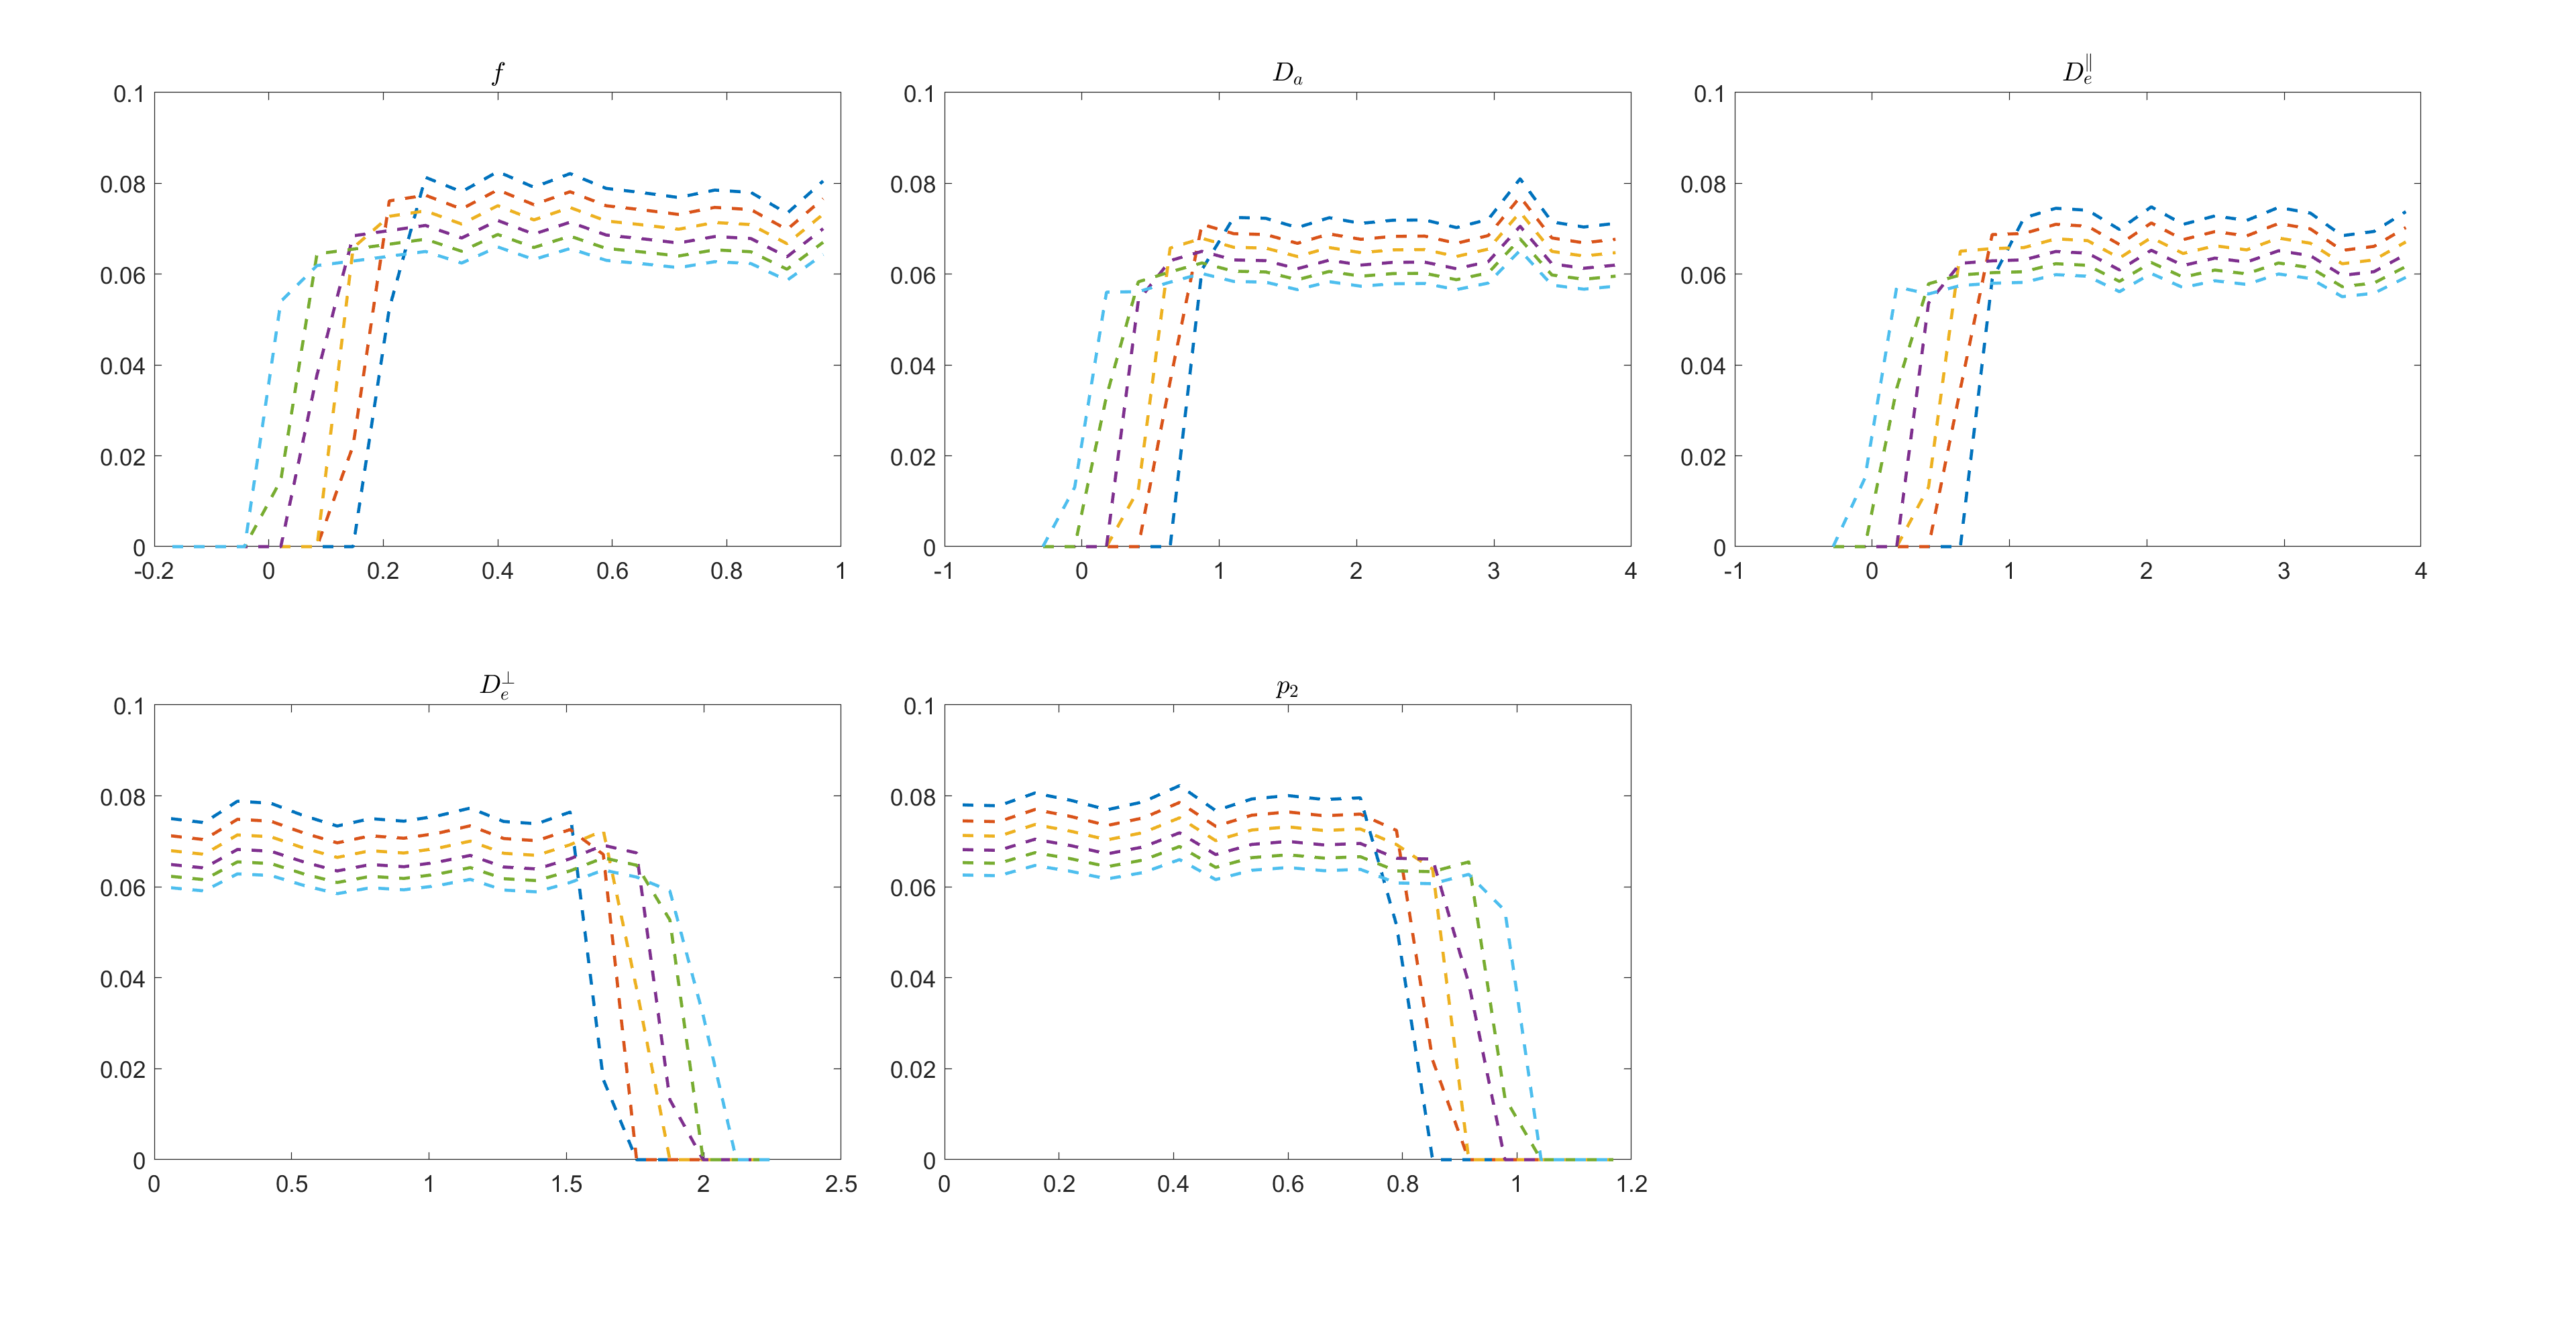
Figure.
1. Histogram of prior distribution. The mean of the prior shifts by moving
one bound of the box-shaped prior distribution while keeping the other bound
fixed. For each parameter, the entire change of the bound is 20% of the
physical range divided in 6 steps.
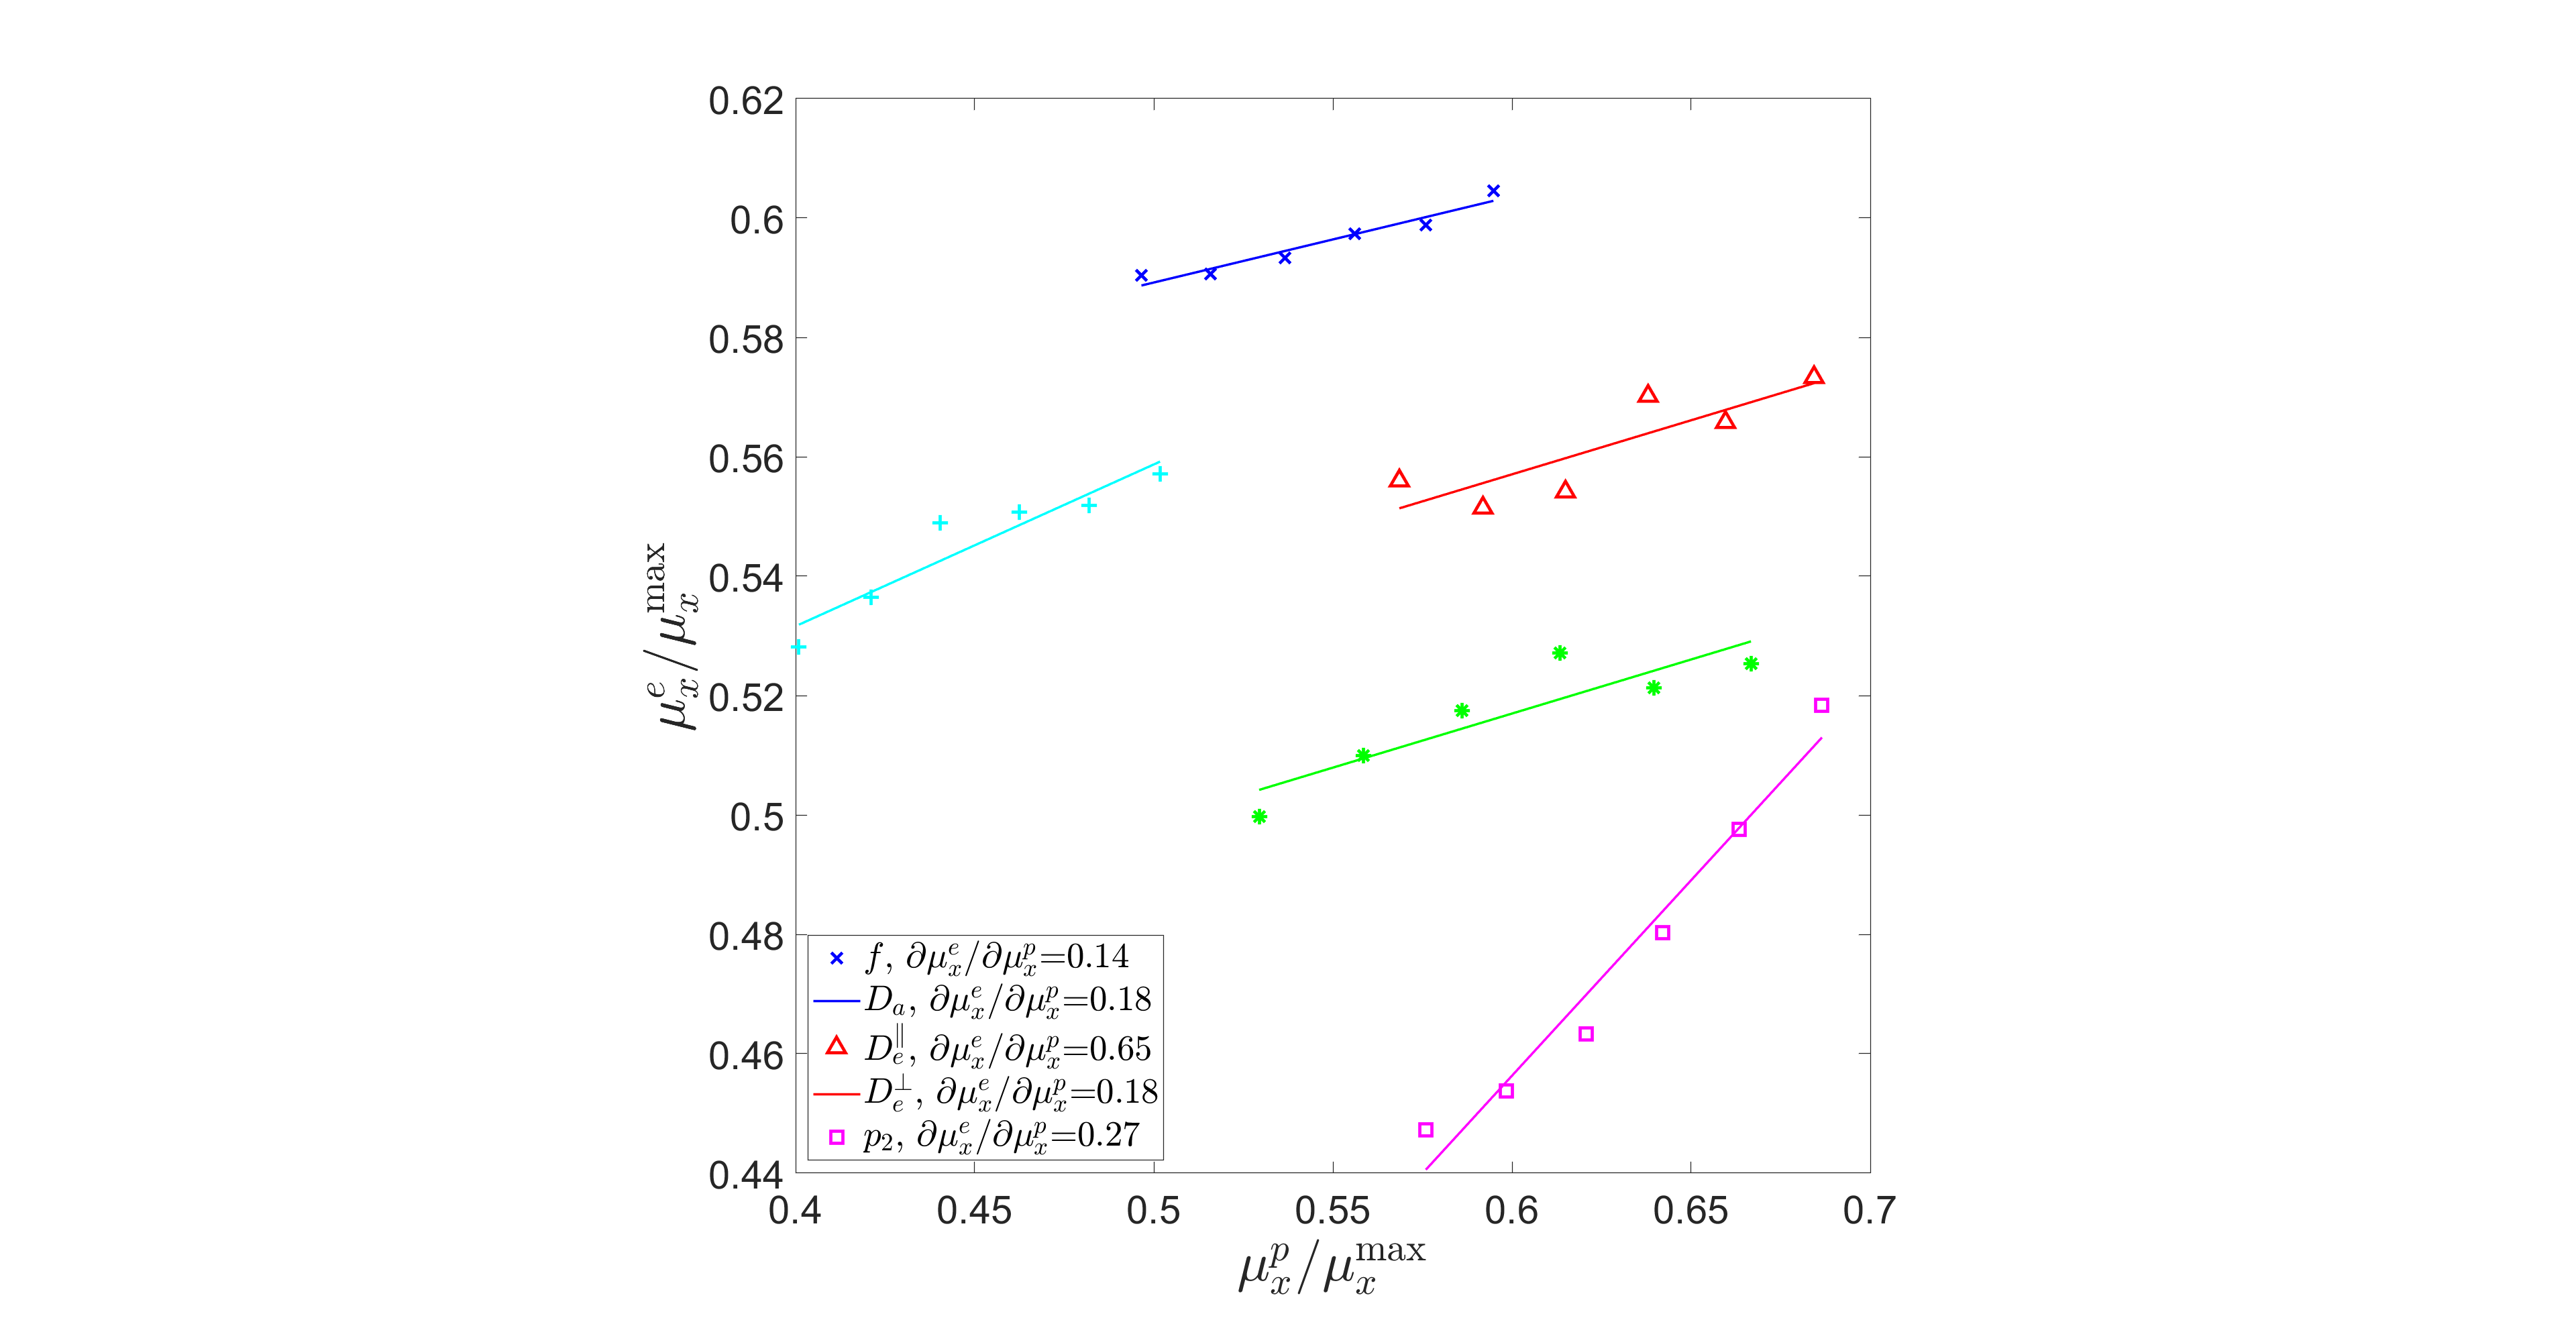
Figure.
2. Mean of the estimates $$$\mu_{x}^{e}$$$ versus mean of the prior $$$\mu_{x}^{p}$$$ in simulation with SNR=25. The mean of the
estimates $$$\mu_{x}^{e}$$$ moves as the mean of the prior $$$\mu_{x}^{p}$$$ moves.
After conducting a linear regression on each parameter, the slope $$$\partial\mu_{x}^{e}/\partial\mu_{x}^{p}$$$
is specified in the legend. The values of each parameter are normalized by their maximal values to make all parameters dimensionless.
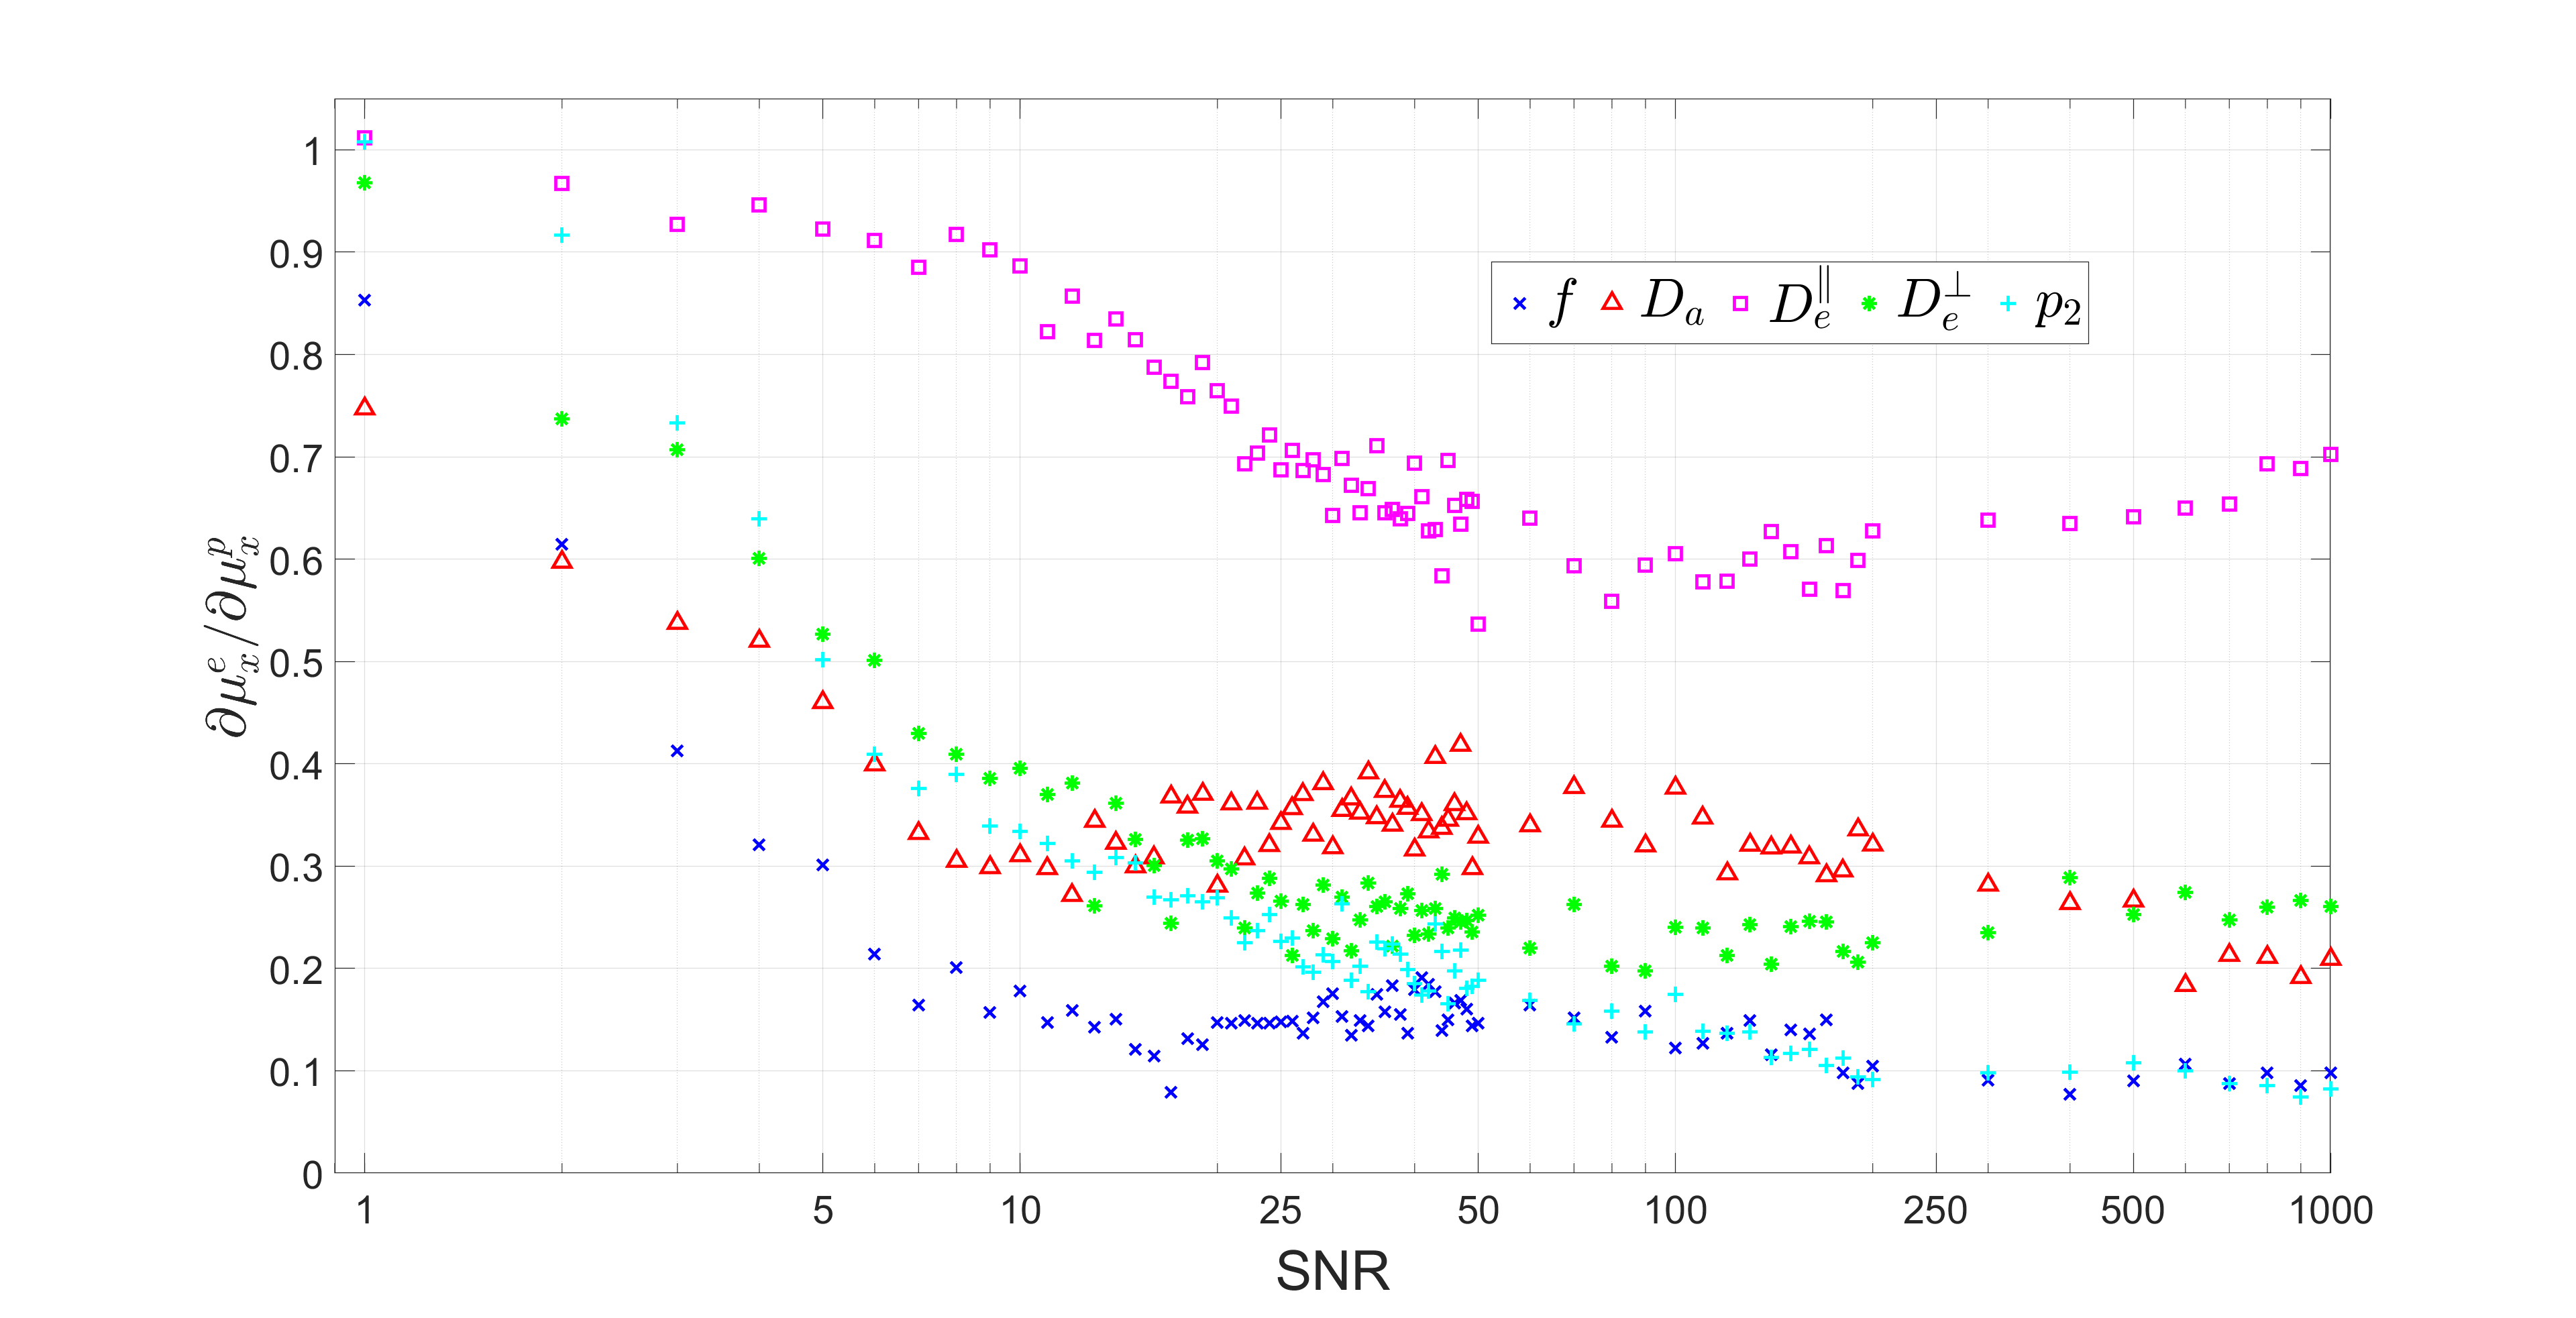
Figure.
3. Effect of prior distribution on parameter estimation of synthetic data.
The slope $$$\partial \mu_{x}^{e}/\partial\mu_{x}^{p}$$$ of linear regression
of parameter estimate mean $$$\mu_{x}^{e}$$$ with respect to the mean of prior distribution $$$\mu_{x}^{p}$$$ is plotted against SNR for each SM parameter. We see that the diffusivities are notably more sensitive to prior (and less to measurement) than $$$f$$$ and $$$p_2$$$.
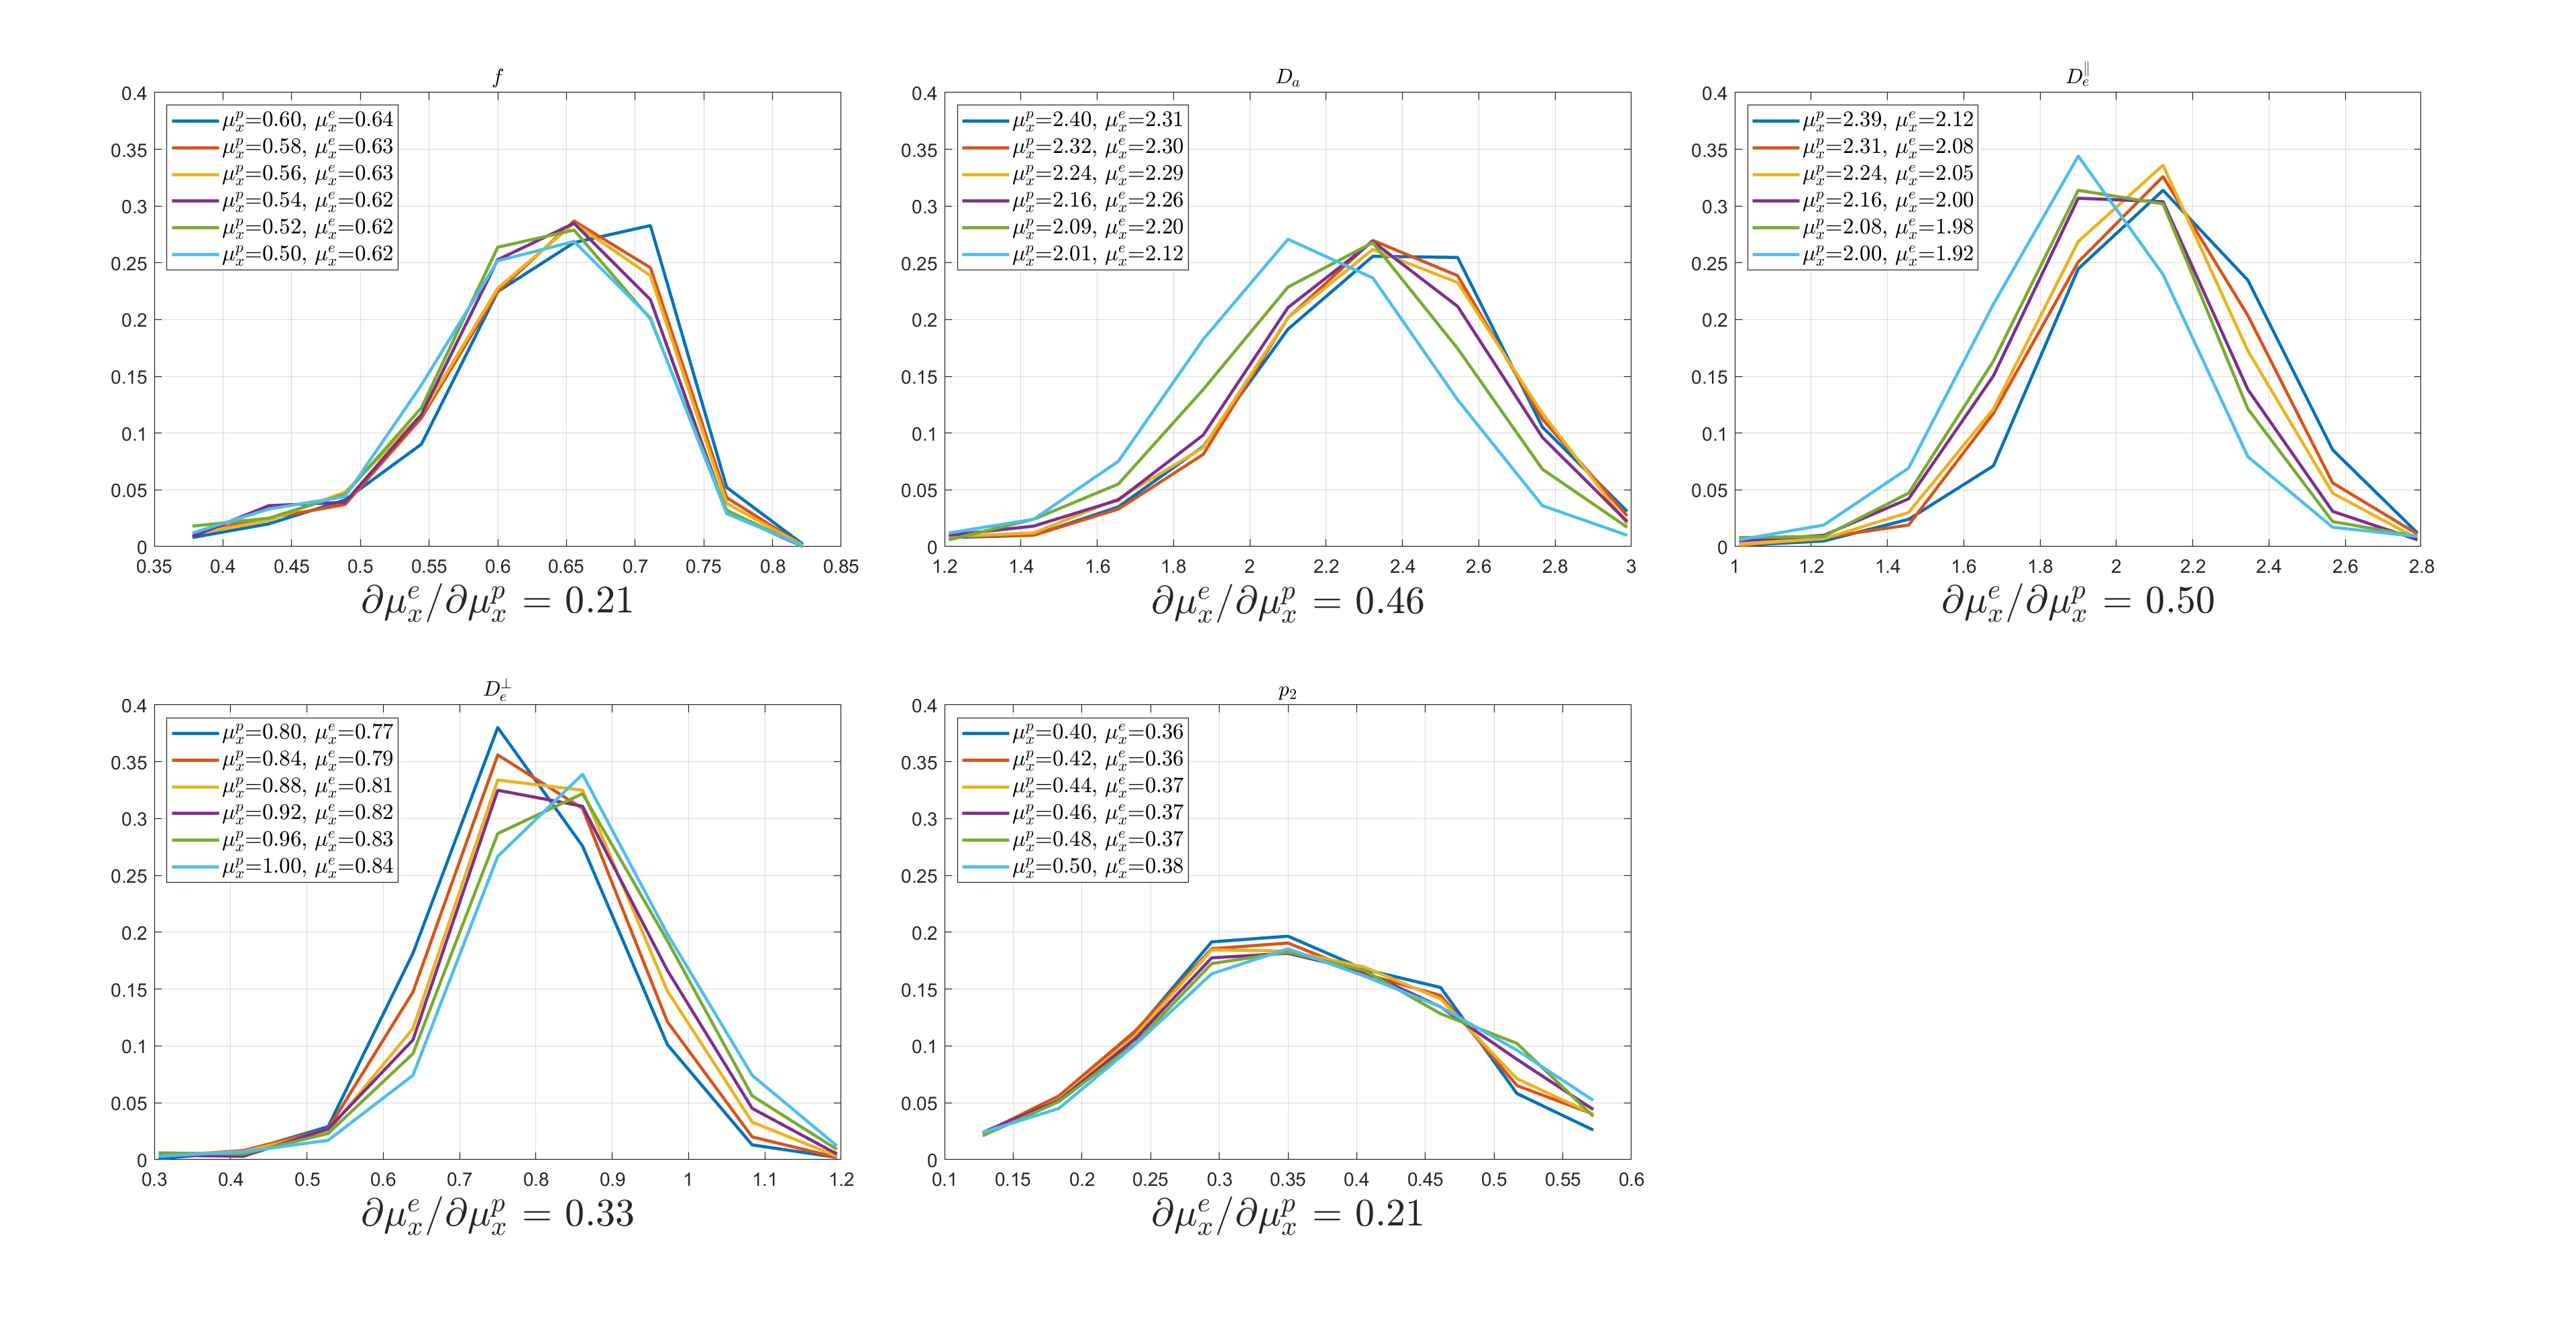
Figure.
4. Histogram of estimated parameters with different prior distributions for in-vivo data.
Histograms of each parameter estimated by polynomial regression trained by
different prior distributions are plotted for in-vivo data. Mean of the prior
distribution $$$\mu_{x}^{p}$$$ and the estimate mean $$$\mu_{x}^{e}$$$ of the
same parameter are provided in the legend for every SM parameter, while the slope $$$\partial\mu_{x}^{e}/\partial\mu_{x}^{p}$$$
is written under each subfigure.
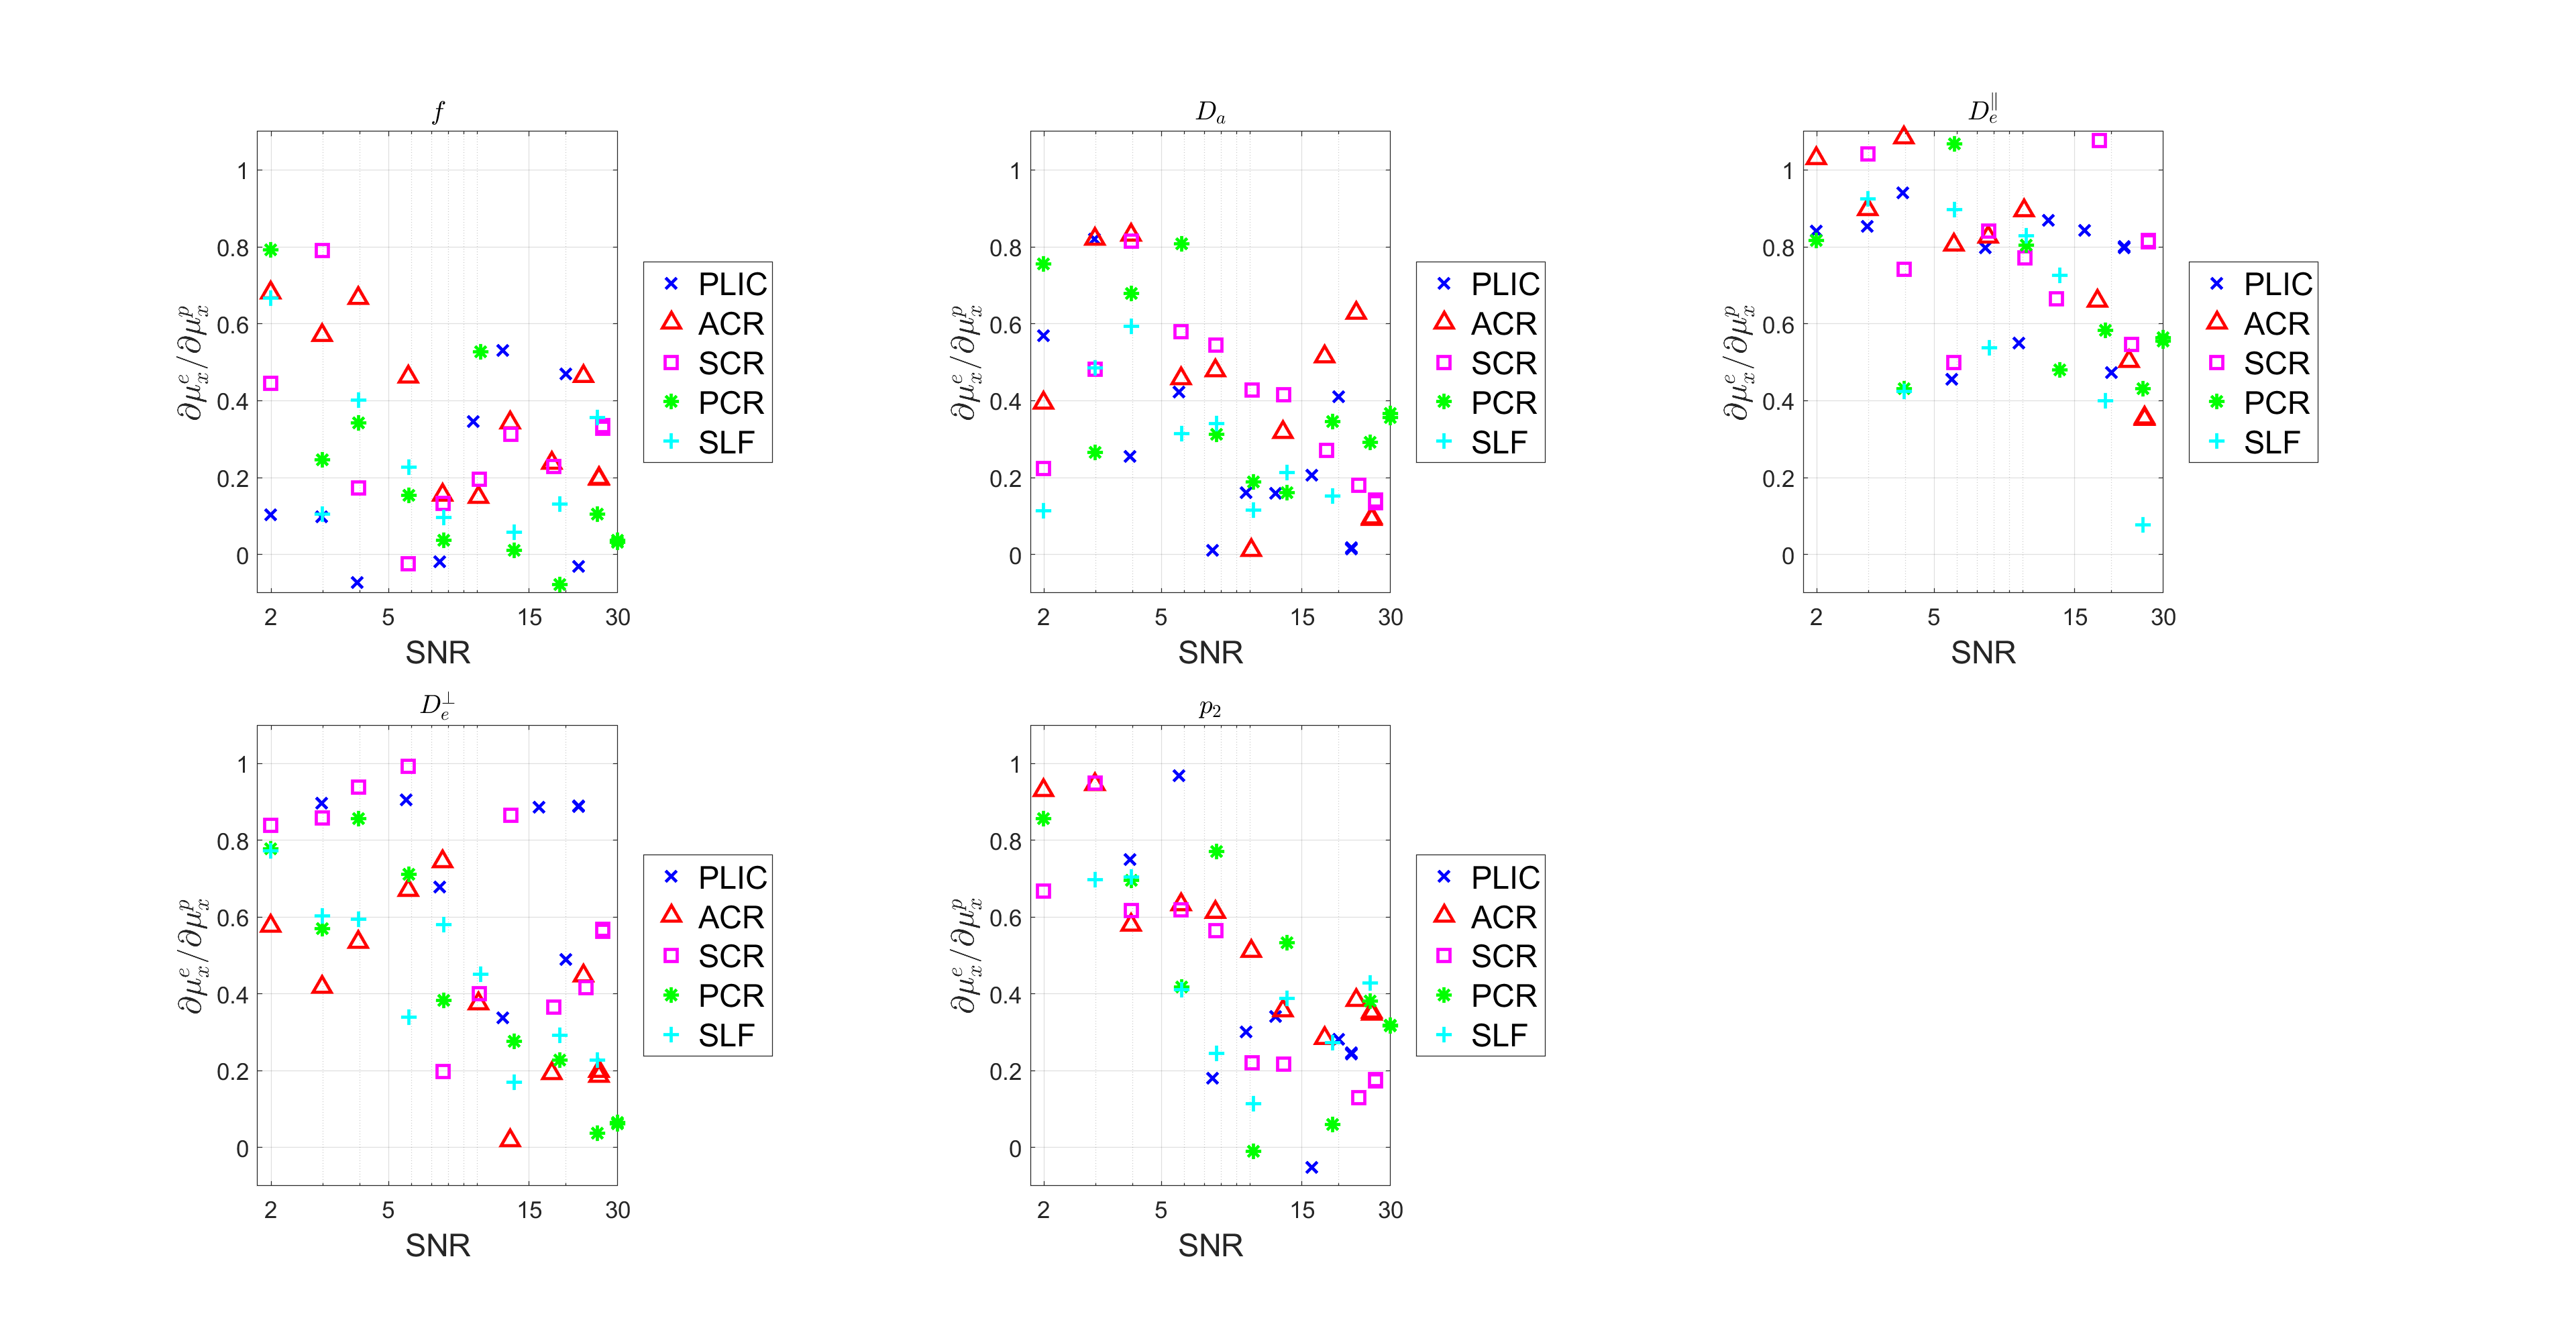
Figure.
5. Effect of prior distribution on parameter estimation for in-vivo data.
The slope $$$\partial\mu_{x}^{e}/\partial\mu_{x}^{p}$$$ is plotted against SNR for
each SM parameter. In each subfigure, one color corresponds
to an ROI specified in the legend on the right. The rightmost data point was
free from extra noise while the rest was added noise of different levels and
the mean of the SNR is extracted to represent the whole group.