3418
Microstructure size-distribution estimations with smooth and sharp non-uniform oscillating gradient spin-echo modulations1Departamento de Física Médica, Instituto Balseiro, Universidad Nacional de Cuyo, CNEA, San Carlos de Bariloche, Argentina, 2Centro Atómico Bariloche, CNEA, San Carlos de Bariloche, Argentina, 3Consejo Nacional de Investigaciones Científicas y Técnicas de Argentina (CONICET), San Carlos de Bariloche, Argentina, 4Instituto de Nanociencia y Nanotecnología, CNEA,CONICET, San Carlos de Bariloche, Argentina
Synopsis
Morphological changes related to neurological diseases occur at micrometer scales. Obtaining such information non-invasively opens new paradigms for clinical diagnosis. We use the Non-uniform Oscillating Gradient Spin-Echo sequence to estimate microstructure size-distributions with high sensitivity based on probing a signal “decay-shift” rather than a signal decay-rate. The “decay-shift” arises with sharp gradient modulations. As fast ramps are prohibitive in clinical diagnosis, we evaluate the method using sharp and smooth gradient modulations. We show using simulations and proof-of-principle experiments with phantoms that mimic axon-bundles, that optimal estimation of the underlying microstructure-size distribution is obtained either using sharp or smooth modulations.
Introduction
Diffusion-weighted magnetic resonance imaging (dMRI) is a promising technique for diagnosing neurodegenerative diseases at an early stage by quantifying non-invasively the brain microstructure. Obtaining such information in a non-invasive way will open new paradigms for clinical diagnosis.Microstructure sizes can be estimated from the dMRI signal. A Non-uniform Oscillating Gradient Spin-Echo (NOGSE) dMRI sequence was proposed for estimating microstructure size-distributions with high parametric sensitivity based on probing a signal “decay-shift” rather than a signal decay-rate1,2,3,4. This sequence also factors out gradient-sign switch imperfections, pulse errors and T2-relaxation weighting. We found that the signal “decay-shift” is manifested with sharp ramps for the gradient-sign switches. As fast ramps can be prohibitive in clinical diagnosis, we here assess the performance for estimating microstructure size-distributions using sharp and smooth gradient modulations. We show with numerical simulations and proof-of-principle experiments with phantoms that mimic axon-bundles, that optimal estimation of the underlying microstructure size-distribution can be attained either using sharp or smooth modulations. These results are therefore promising for being implemented in clinical scenarios.
Methods
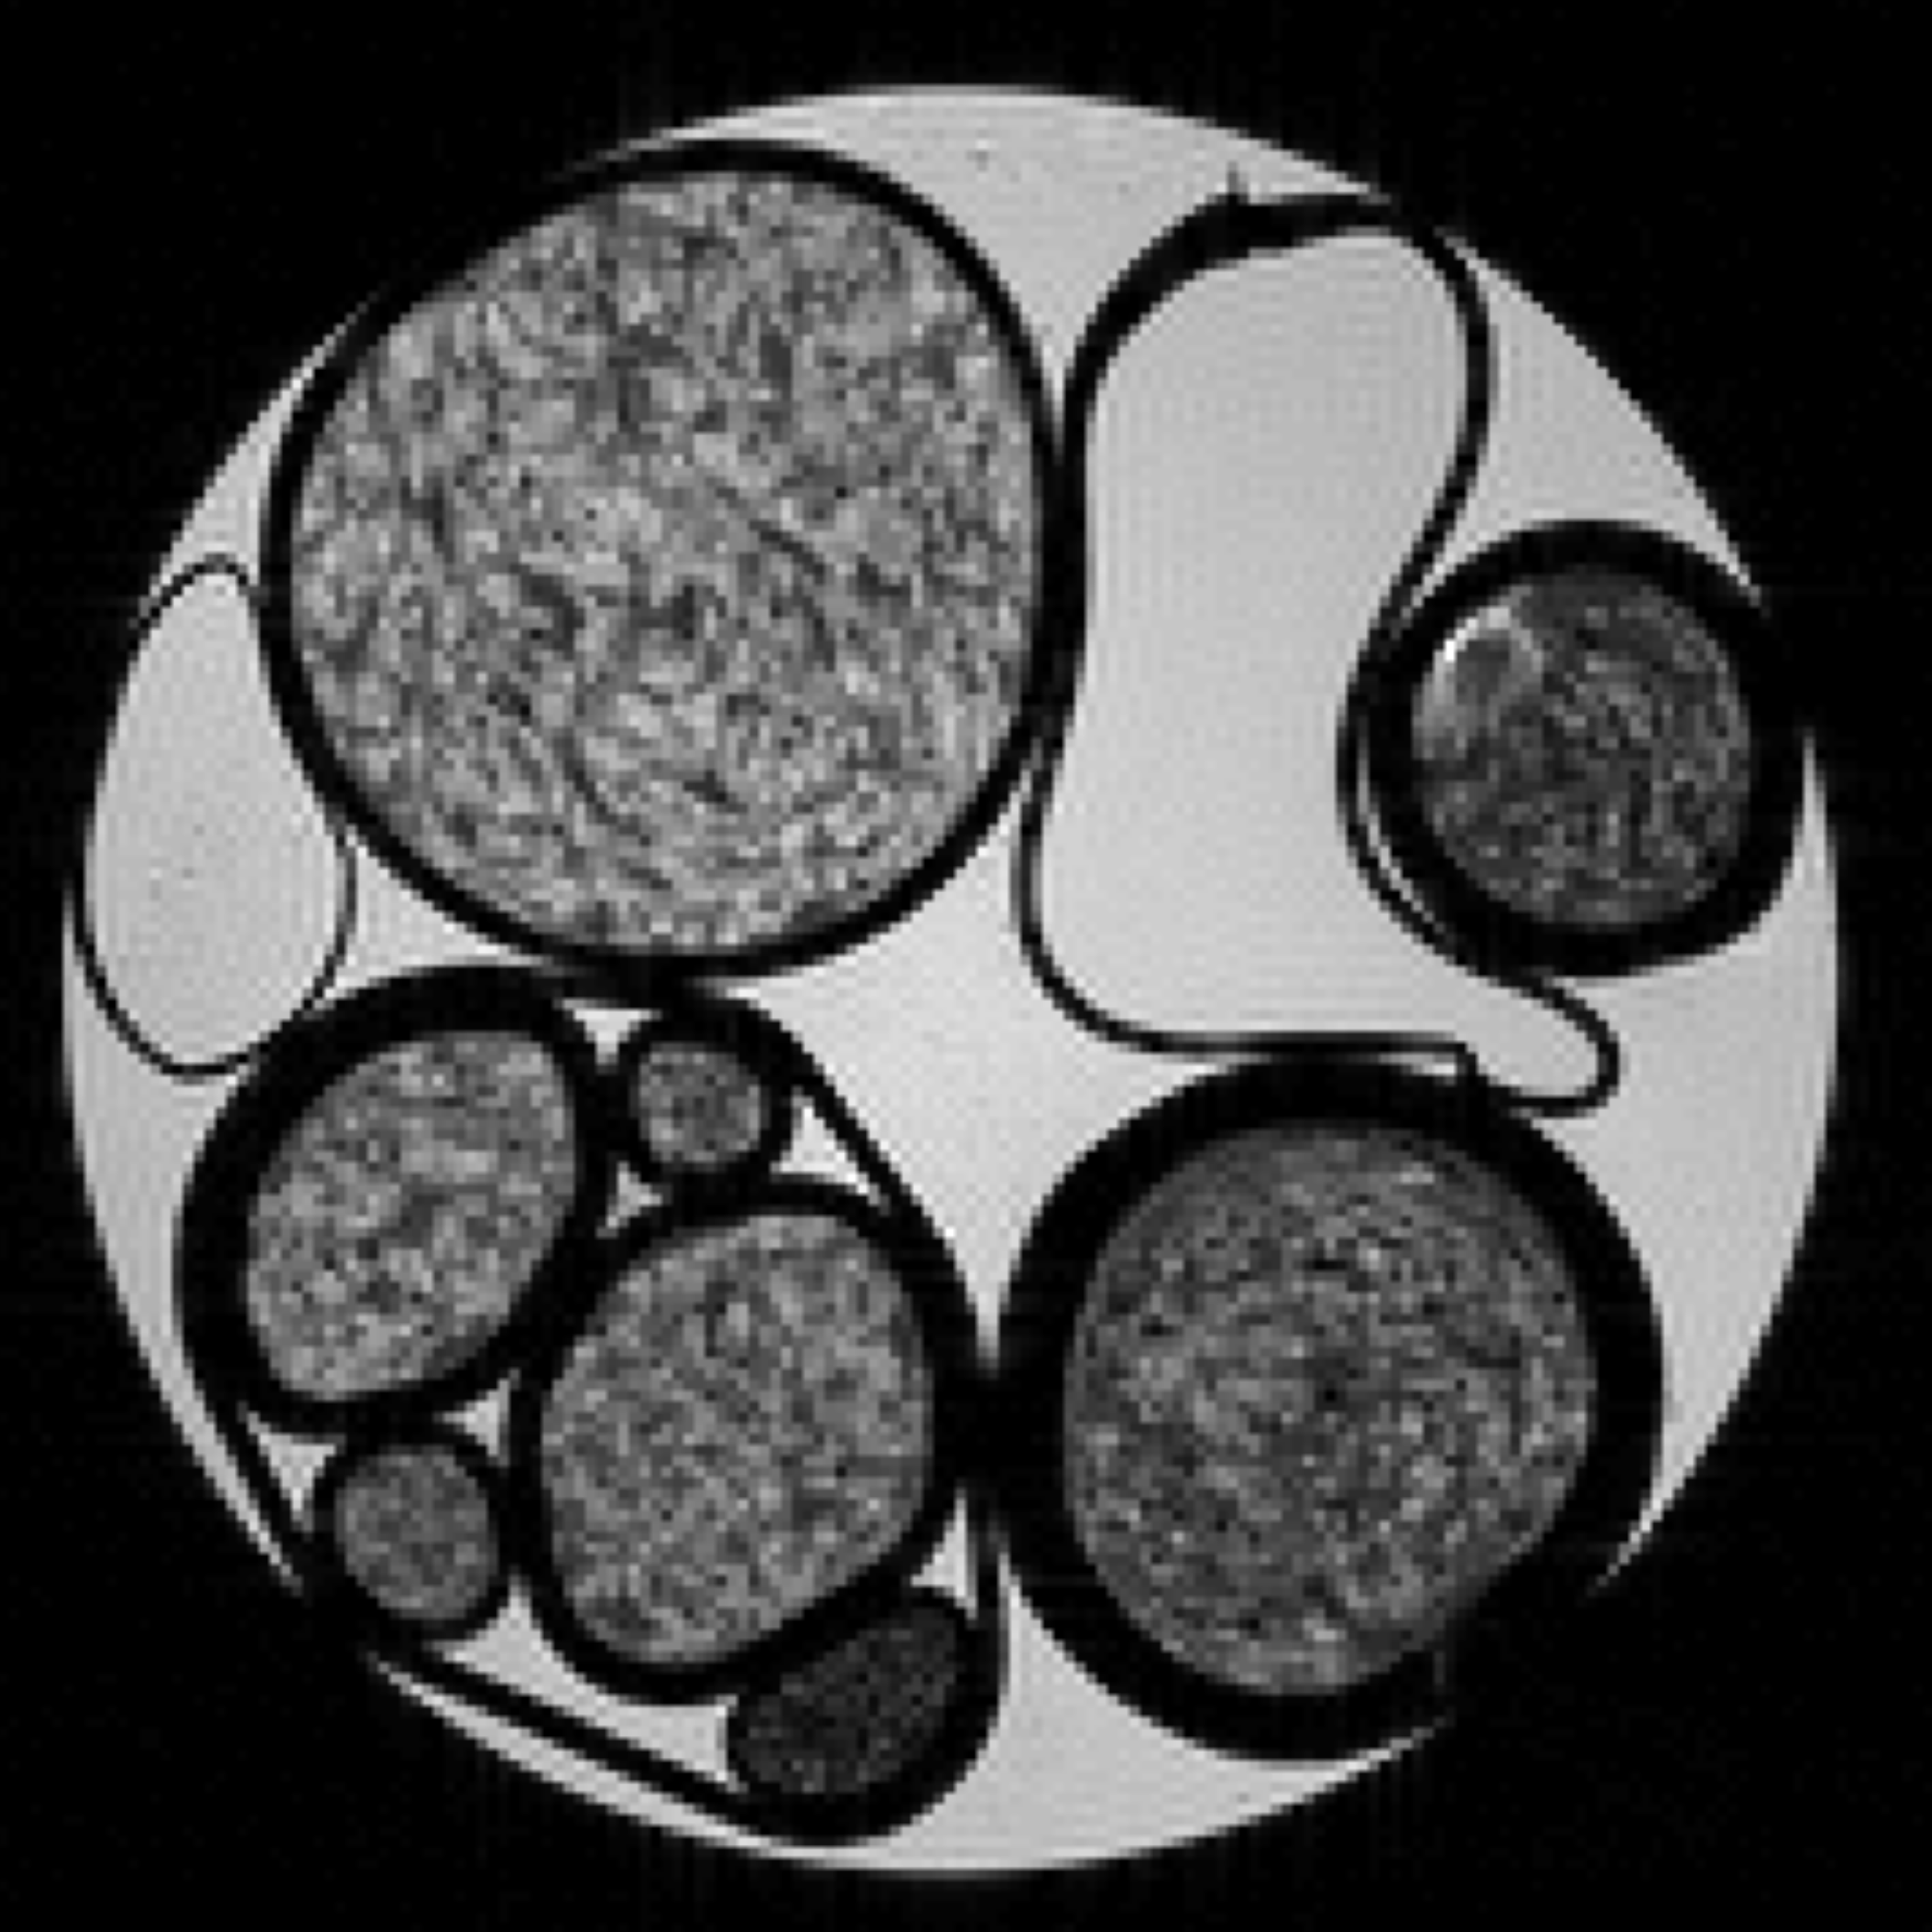
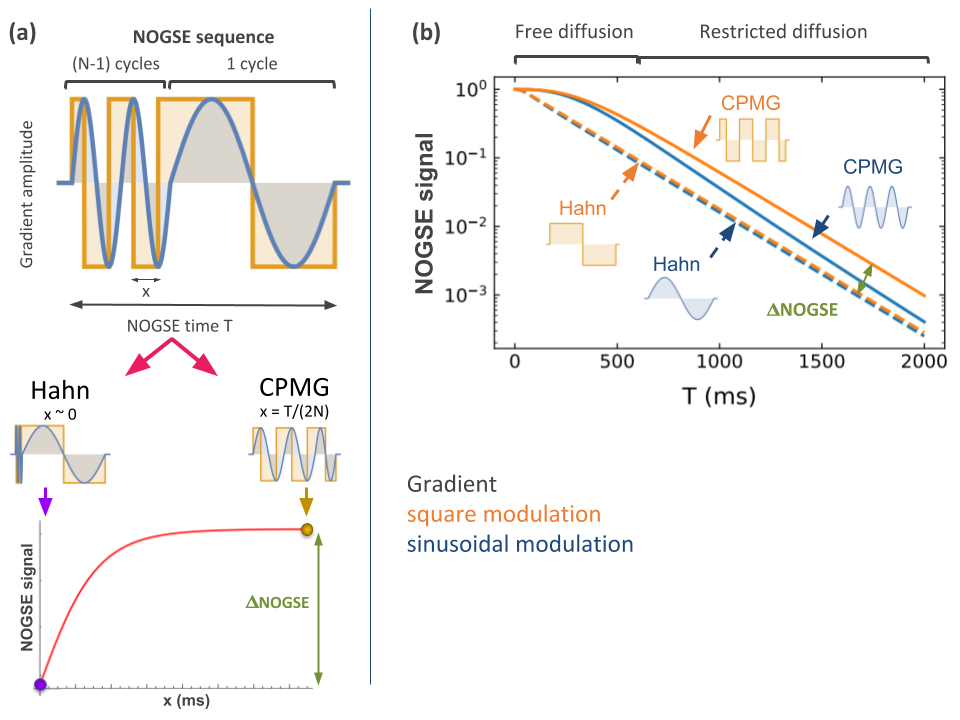
Phantom manufacturing. Axon bundles with size-distributions similar to those found in the white matter, were mimicked with home-made phantoms designed with aramid fibers (10 μm mean diameter). A transverse plane MRI of the phantom is shown in Fig. 1, where parallel aramid fibers bundles of different packing densities were prepared immersed in water.NOGSE MRI experiments were performed on a 9.4T Bruker NMR spectrometer with a Micro 2.5 probe. The sequence parameters are detailed in Fig. 2.a., were: Repetition-time=2T+20ms; in-plane resolution of 152×152 μm2; slice thickness of 1mm with 10 averages. Echo planar imaging encoding with 8 segments; 8 number of N-cycles; NOGSE-time T varied between 40ms-80ms; NOGSE-gradients were between 8G/cm and 44G/cm and were applied perpendicular to the main axis of the aramid fiber bundles, with a sinusoidal or trapezoidal NOGSE modulation.
Results and discussion
NOGSE signal and contrast. We compared sinusoidal with trapezoidal NOGSE sequences as paradigmatic cases for smooth and sharp modulations (Fig. 2).Signal “decay-shift”. Figure 2.b. shows the magnetization signal as a function of the diffusion time under a CPMG or Hahn gradient modulation with sinusoidal or squared gradient pulses. The transition from free to restricted diffusion is marked in the figure. For each type of modulation, the difference of signal amplitude between Hahn and CPMG sequences when the restricted effects dominate, gives a signal contrast ΔNOGSE of Fig. 2.b. This contrast provides quantitative information of the microstructure sizes1,2,3,4. The “decay-shift” marked with an arrow is manifested on ΔNOGSE when perfect gradient pulses are applied, i.e. instantaneous ramps for switching the gradient’ sign. The “decay-shift” is independent of the diffusion time T. However, if ramps are smooth, the “decay-shift” decreases as a function of T.
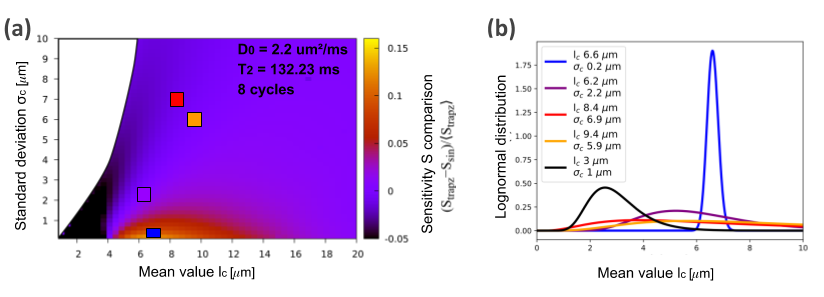
Smooth versus sharp gradient modulations. We consider restriction-size Lognormal distributions with mean value lc and standard deviation σc. Using information theory tools, we define an information gain (sensitivity) and compare the potential of estimating lc and σc using sharp or smooth ramps (Fig. 3.a). Within the yellow to red region, sharp modulation improves the gain, while in the black region smooth modulations improves it. Square dots represent the restriction-size distribution estimated from the aramida phantoms, and the reconstructed Lognormal distributions are shown in Fig. 3.b.
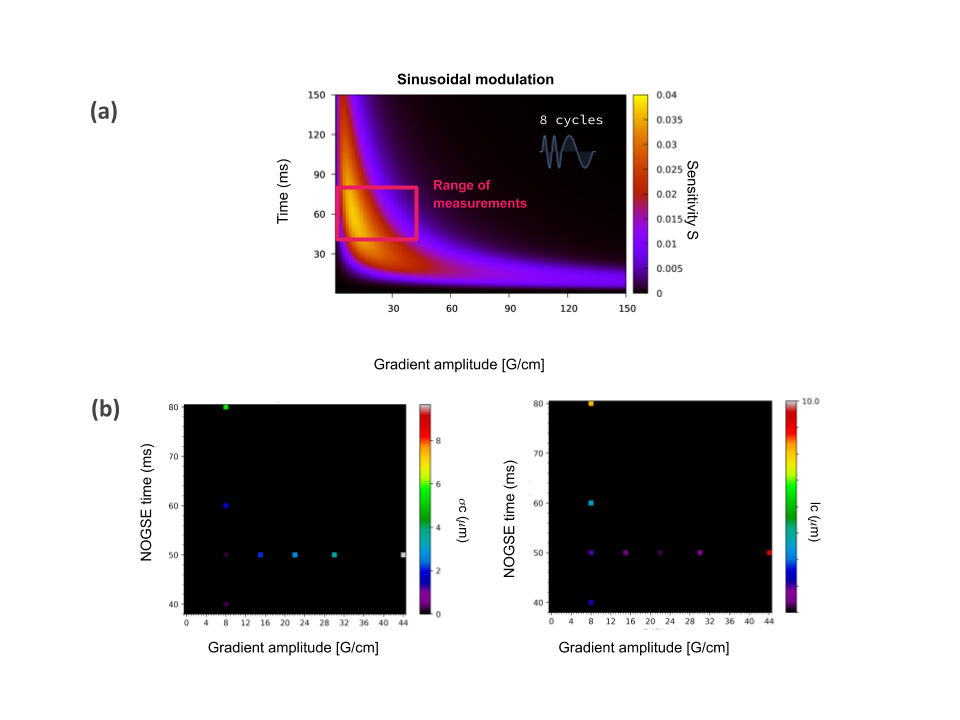
Figure 4.a shows a sensitivity map for a sinusoidal NOGSE modulation sequence. Figure 4.b shows the reconstructed restriction-size distribution for one of the phantoms for different sequence parameters. The lowest estimated values for lc and σc are obtained for the predicted optimal sequence parameters. The optimal values and determined restriction-size distribution are consistent with the predictions derived from the information gain approach. For long NOGSE diffusion times, T2-effects become relevant and the signal amplitude decreases, as well as for large gradient amplitudes, therefore there is an optimal gradient and NOGSE diffusion time for determining a given size-distribution. This result shows that smooth modulations with NOGSE can efficiently be used to determine restriction sizes.
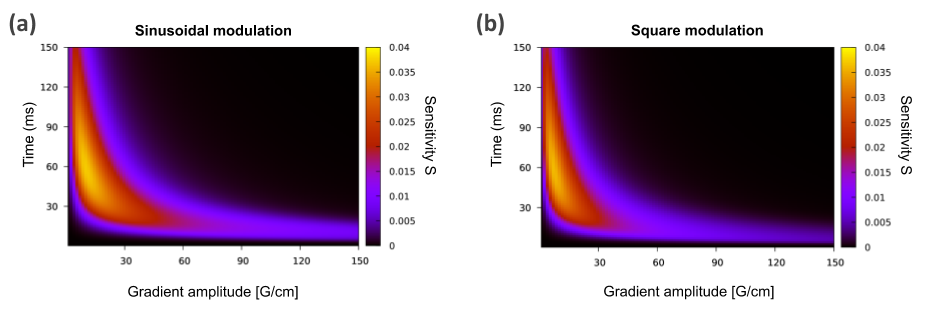
Within the region shown in Fig. 4.a, there is not a significant difference between using sharp or smooth modulations. This is demonstrated in Fig. 5 where the optimal sequence parameters are comparable as well as the information gain for both types of modulations.
Conclusion
We determined microstructural sizes of phantoms mimicking axon distribution using dMRI sequences. We used the NOGSE sequence that generates a signal contrast providing quantitative information of microstructural sizes based on a “decay-shift”. As we discovered that the NOGSE “decay-shift” is manifested with sharp gradient modulations, we assessed the factibility to exploit it also with smooth gradient modulations that are more compatible with clinical diagnosis. We demonstrated with information theory tools and the proof-of-principle experiments that smooth modulations can be used to estimate restriction-size distributions. Moreover, we have found that they have a comparable sensitivity and, for small restriction sizes, the smooth modulation outperformed the sharp modulations.These results are a step towards improving diagnostic tools based on quantitative imaging of tissue microstructure that might allow early stage diagnosis of illnesses associated with axon alterations in the white matter of the brain.Acknowledgements
This work was supported by CNEA, CONICET, ANPCyT-FONCyT PICT-2017-3447, PICT-2017-3699, PICT-2018-04333, PIP-CONICET (11220170100486CO), UNCUYO SIIP Tipo I 2019-C028, Instituto Balseiro.References
1. G. A. Álvarez, N. Shemesh, and L. Frydman. Phys. Rev. Lett. 111, 080404 (2013).
2. N. Shemesh, G. A. Álvarez, and L. Frydman. J. Magn. Reson. 237, 49 (2013).
3. N. Shemesh, G. A. Álvarez, and L. Frydman. PLoS ONE 10, e0133201 (2015).
4. M. Capiglioni, A. Zwick, P. Jimenez and G. A. Álvarez Non-invasive quantitative imaging of selective microstructure-sizes with magnetic resonance. arXiv:2006.02035 [physics.med-ph] (2020).
Figures