3415
Cumulant expansions for measuring restricted diffusion and water exchange1Department of Medical Radiation Physics, Lund University, Lund, Sweden, 2Department of Diagnostic Radiology, Lund University, Lund, Sweden, 3Russell H. Morgan Department of Radiology and Radiological Science, Johns Hopkins University School of Medicine, Baltimore, MD, United States, 4Lund University Bioimaging Center, Lund University, Lund, Sweden, 5Department for Medical Imaging and Physiology, Skåne University Hospital, Lund, Sweden, 6Department of Radiology, University of Michigan, Ann Arbor, MI, United States
Synopsis
Cell sizes and membrane permeability can be inferred by probing time–dependent diffusion due to restricted diffusion and water exchange. However, restriction and exchange have opposing effects on the diffusion weighted signal when varying the diffusion time, making it a challenge to disentangle the two phenomena. We explore the applicability of a unified theoretical framework that includes size and exchange in living cells by applying it to healthy and diseased human brain in vivo as well as a yeast phantom. Results highlight the potential of the framework for differentiating between healthy and abnormal tissue.
Introduction
Monitoring time-dependence with diffusion MRI provides a probe of microstructural features such as cell sizes and membrane permeability. 1,2,3 The physical processes that inform of the said features are restricted diffusion and water exchange, respectively. 4,5,6 Probing restriction and exchange is a non-trivial task because the two phenomena have opposing effects on the diffusion-weighted signal warranting a careful experimental design and analysis. 7 We previously proposed a unified theory, and accompanying experimental approach, to disentangle the two phenomena. 7 Herein, we adapt the experiments to the human brain, and apply the framework to map restriction and exchange in vivo, including healthy and tumour tissue.Theory
The restriction-exchange theory proposed by Nilsson et al. 7 employs a second-order cumulant expansion of the signal, that reads$$S(b) \approx S_0 \cdot \exp(-b\cdot E + \frac{1}{2}b^2 \cdot V \cdot [1 - k\cdot \Gamma]) \hspace{24pt} (1)$$
where $$$E = E_D + V_{\omega}\cdot E_R$$$ and $$$V = V_D + V_{\omega}\cdot C_{D,R} + V_{\omega}^2 \cdot V_R$$$. $$$E_D$$$ is the mean diffusivity for free diffusion, $$$E_R$$$ is the mean of the restriction coefficient, $$$R$$$. For a cylinder, $$$R = c\cdot d^4/D_0$$$ where $$$c = 7/1536$$$ 9, $$$d$$$ is the characteristic length (cylinder diameter) and $$$D_0$$$ is the bulk diffusivity. $$$V_D$$$ and $$$V_R$$$ denote the variance of $$$D$$$ and $$$R$$$, respectively, and $$$C_{D,R}$$$ is the correlation between $$$D$$$ and $$$R$$$. $$$\Gamma$$$ and $$$V_{\omega}$$$ are the exchange and restricting weighting 8,9, which constitute tools for experimental design. The representation in equation 1 has seven free parameters given by $$$m = \{S_0, E_D, E_R, V_D, C_{D,R}, V_R \}$$$.
Methods
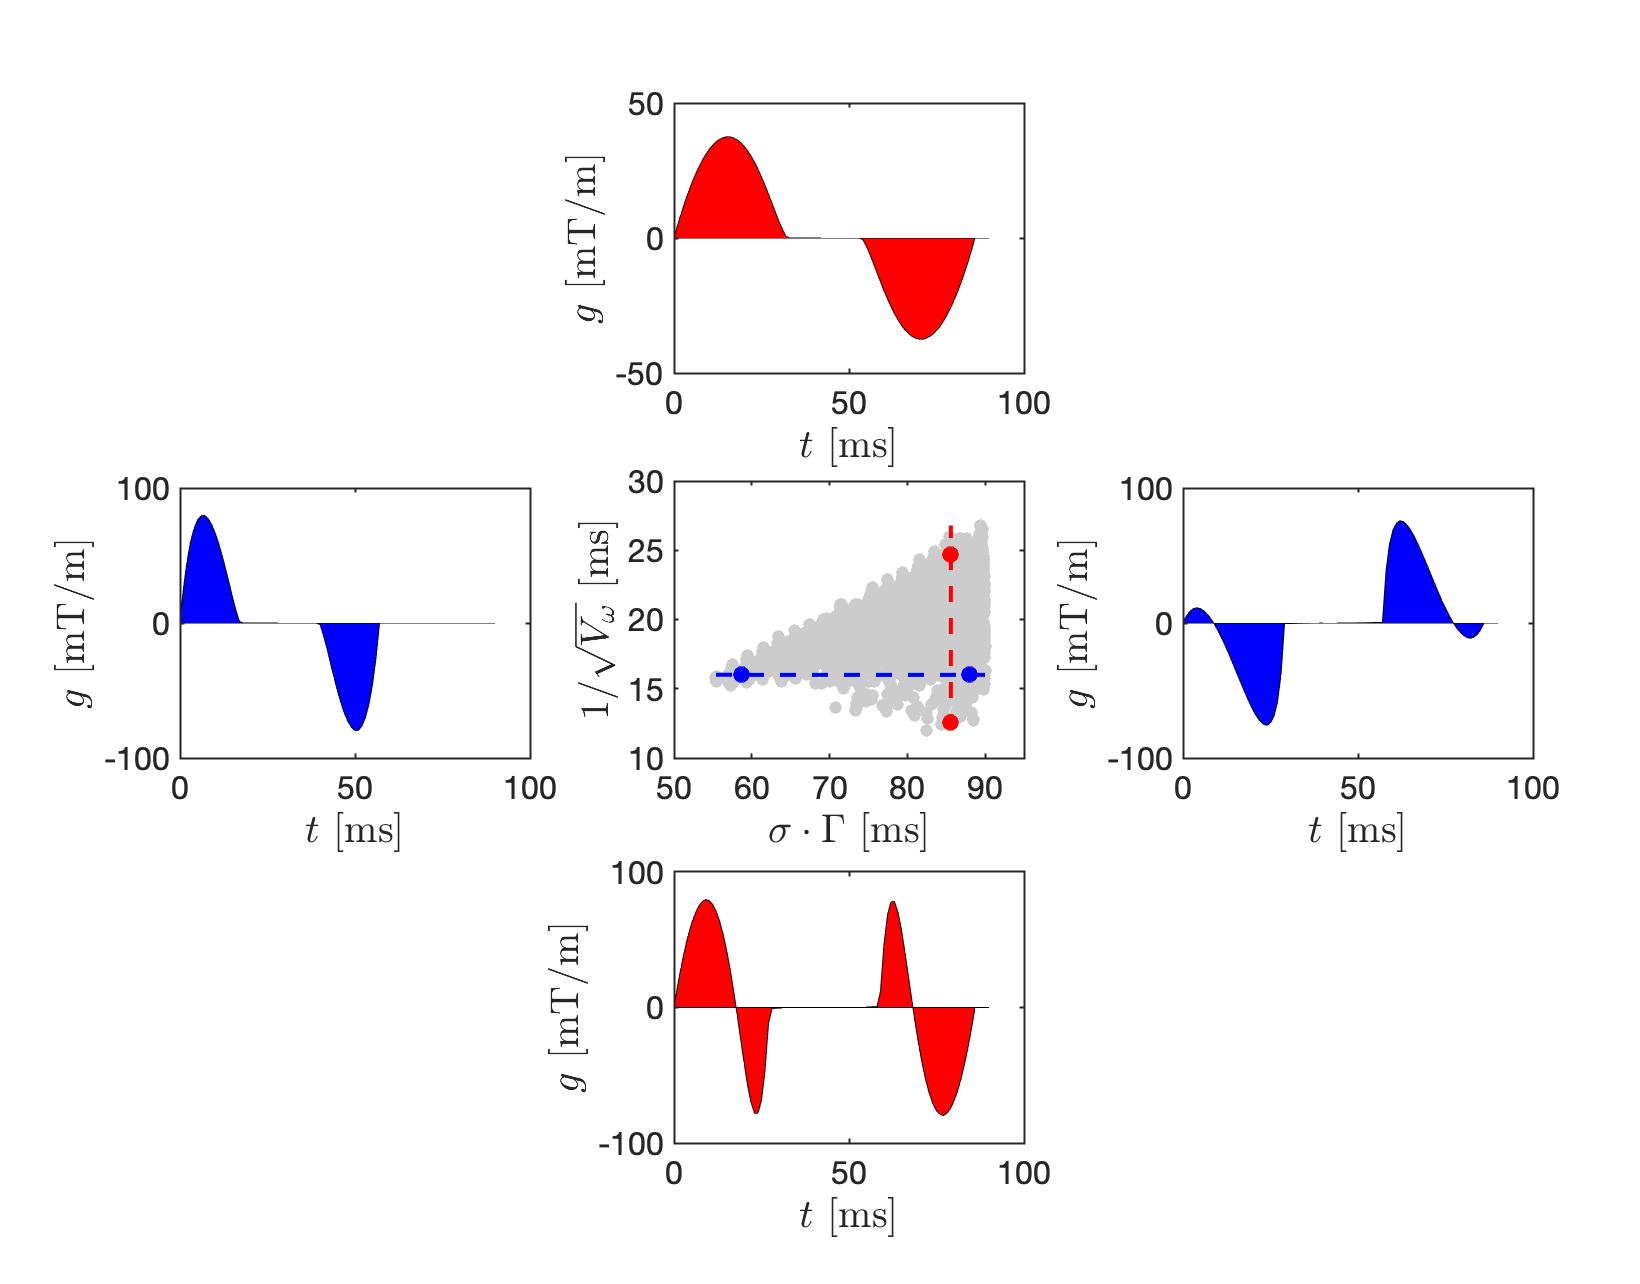
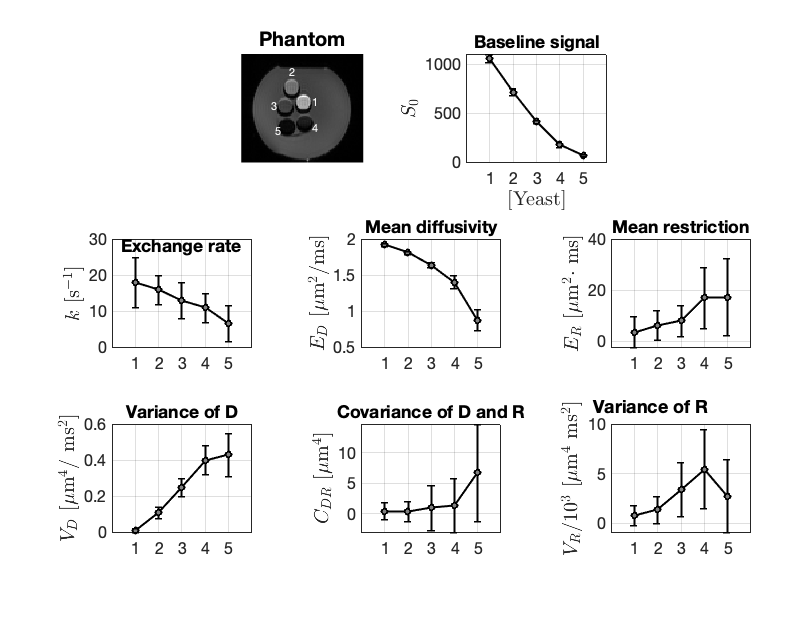
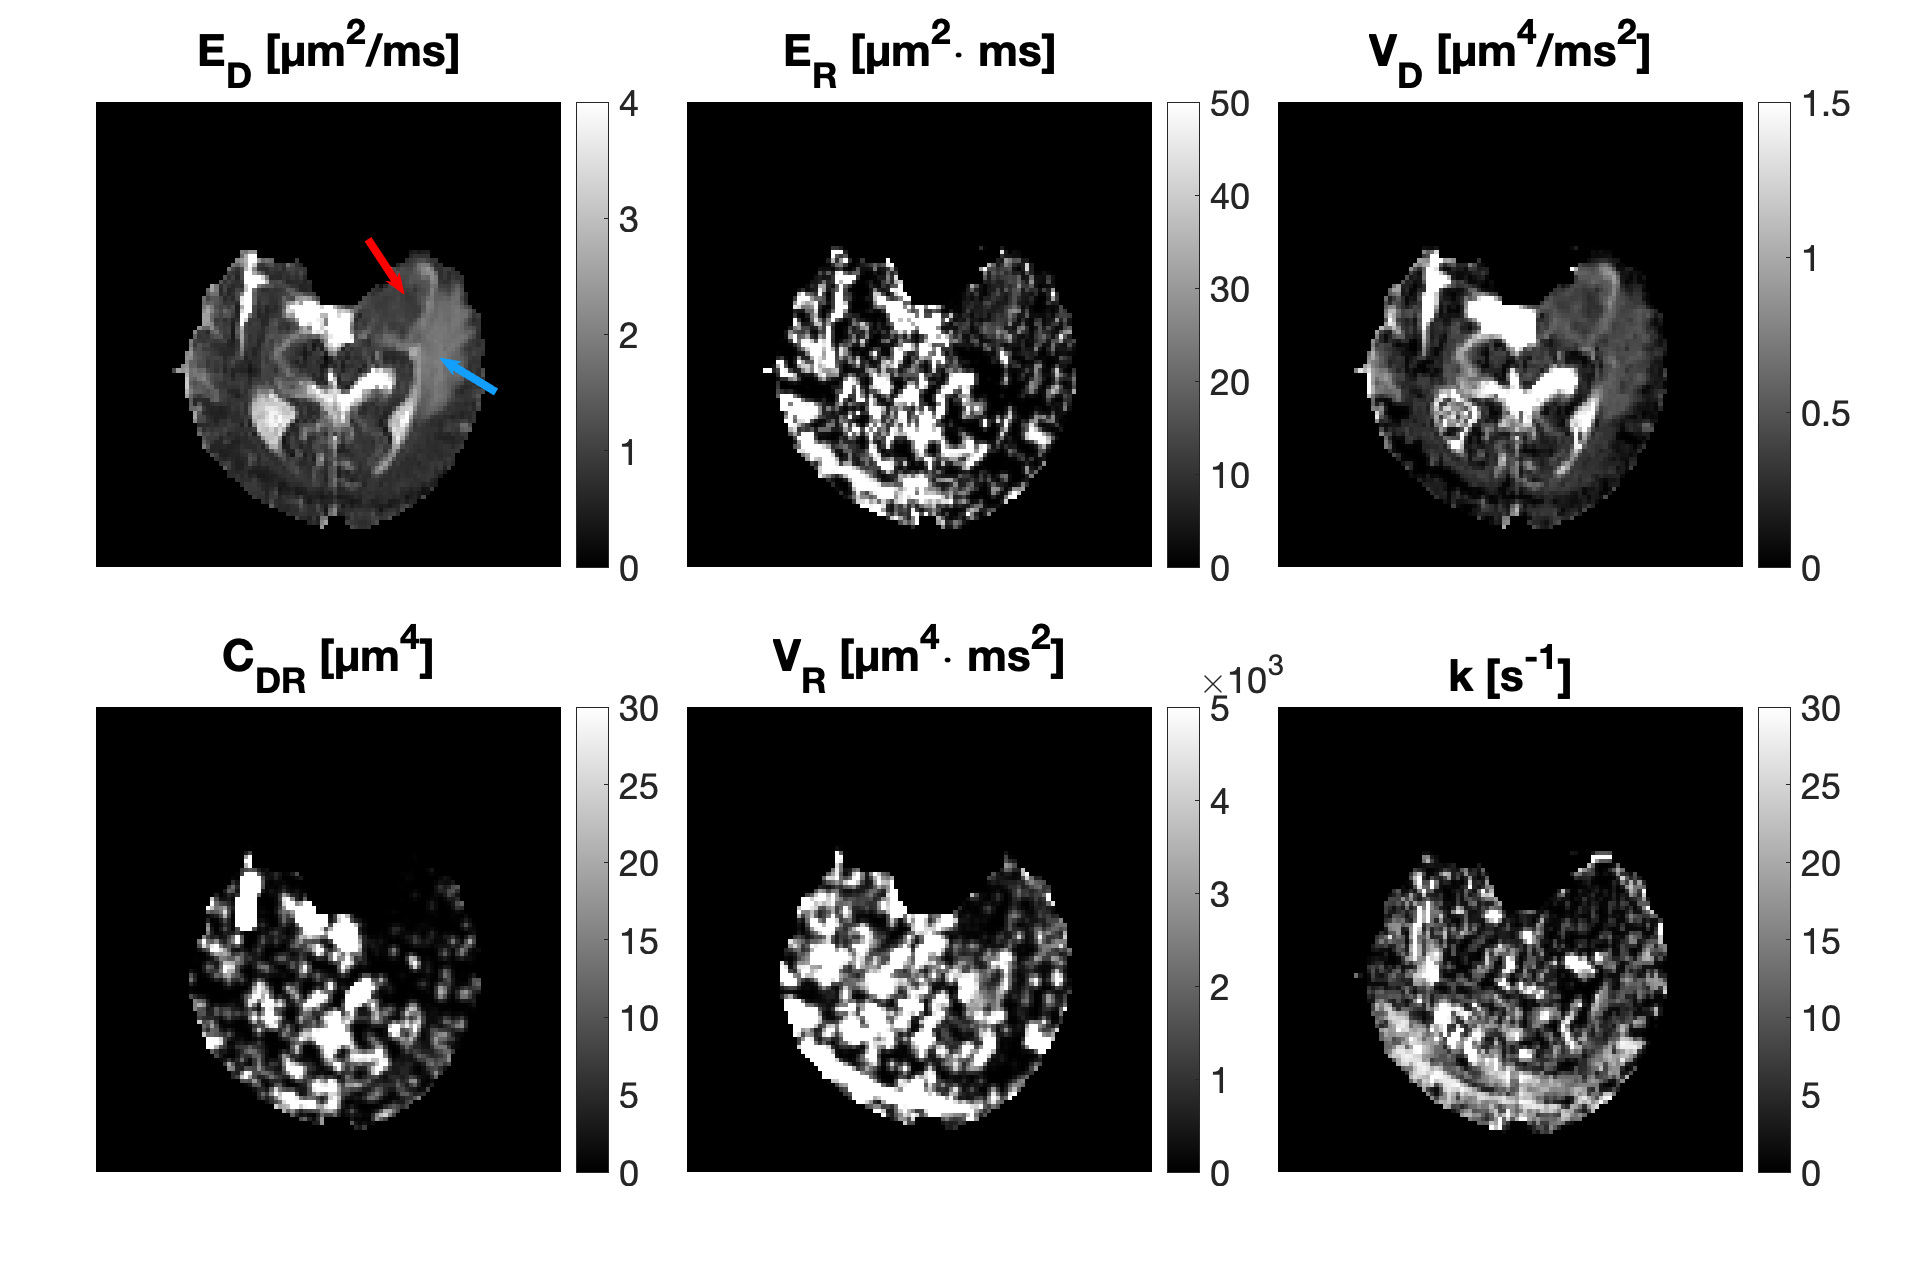
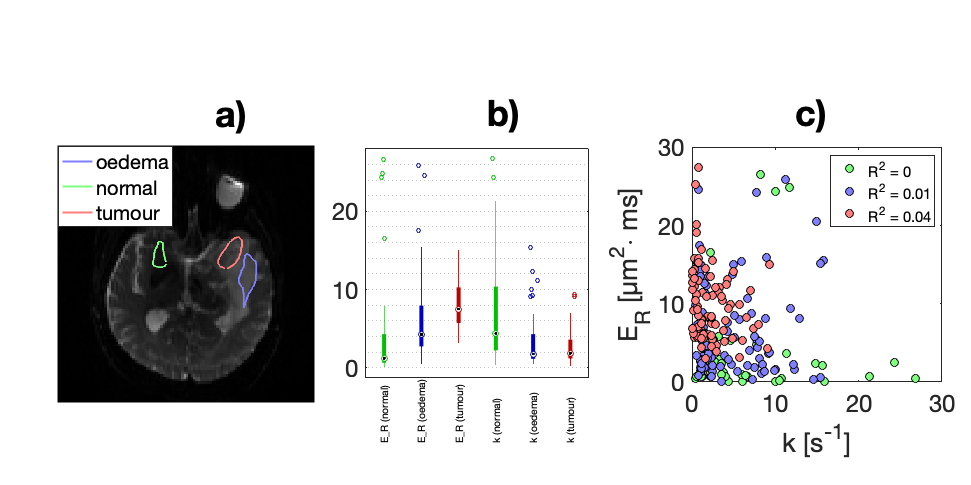
Data was acquired in a healthy volunteer, a meningioma patient, and a baker’s yeast phantom (at room temperature). Measurements were carried out on a 3T MRI Scanner (MAGNETOM, Prisma, Siemens Healthcare, Erlangen, Germany) using a prototype pulse-sequence 10 and acquisition protocol (Figure 1). Symmetric gradient waveforms were designed to expose exchange- and restriction-driven contrasts and their correlation. Imaging was performed using the following protocol: $$$TE = 110 \text{ ms}, TR = 3.2 \text{ s}, \text{strong fat suppression}, \text{resolution} = 2\times 2\times 5 \text{ mm}^3, b = [2, 0, 0] \text{ ms/}\mu\text{m}^2 \text{ and acquisition time} = 10 \text{ min}$$$.The meningioma was located in the temporal lobe. Yeast suspensions were prepared in five vials with linearly increasing yeast-to-water ratios from 1:1 to 5:1 by mass.Parameters were estimated voxel-by-voxel by fitting Eq.1 to the powder-averaged signal. In yeast, region of interests (ROIs) were placed in each vile in the fitted yeast data to determine the mean and standard deviation of the parameter estimates. In the patient, tissue abnormality was gauged by comparing parameters in tumour, normal appearing contralateral parenchyma, as well as the oedematous white matter around the tumour.
Results
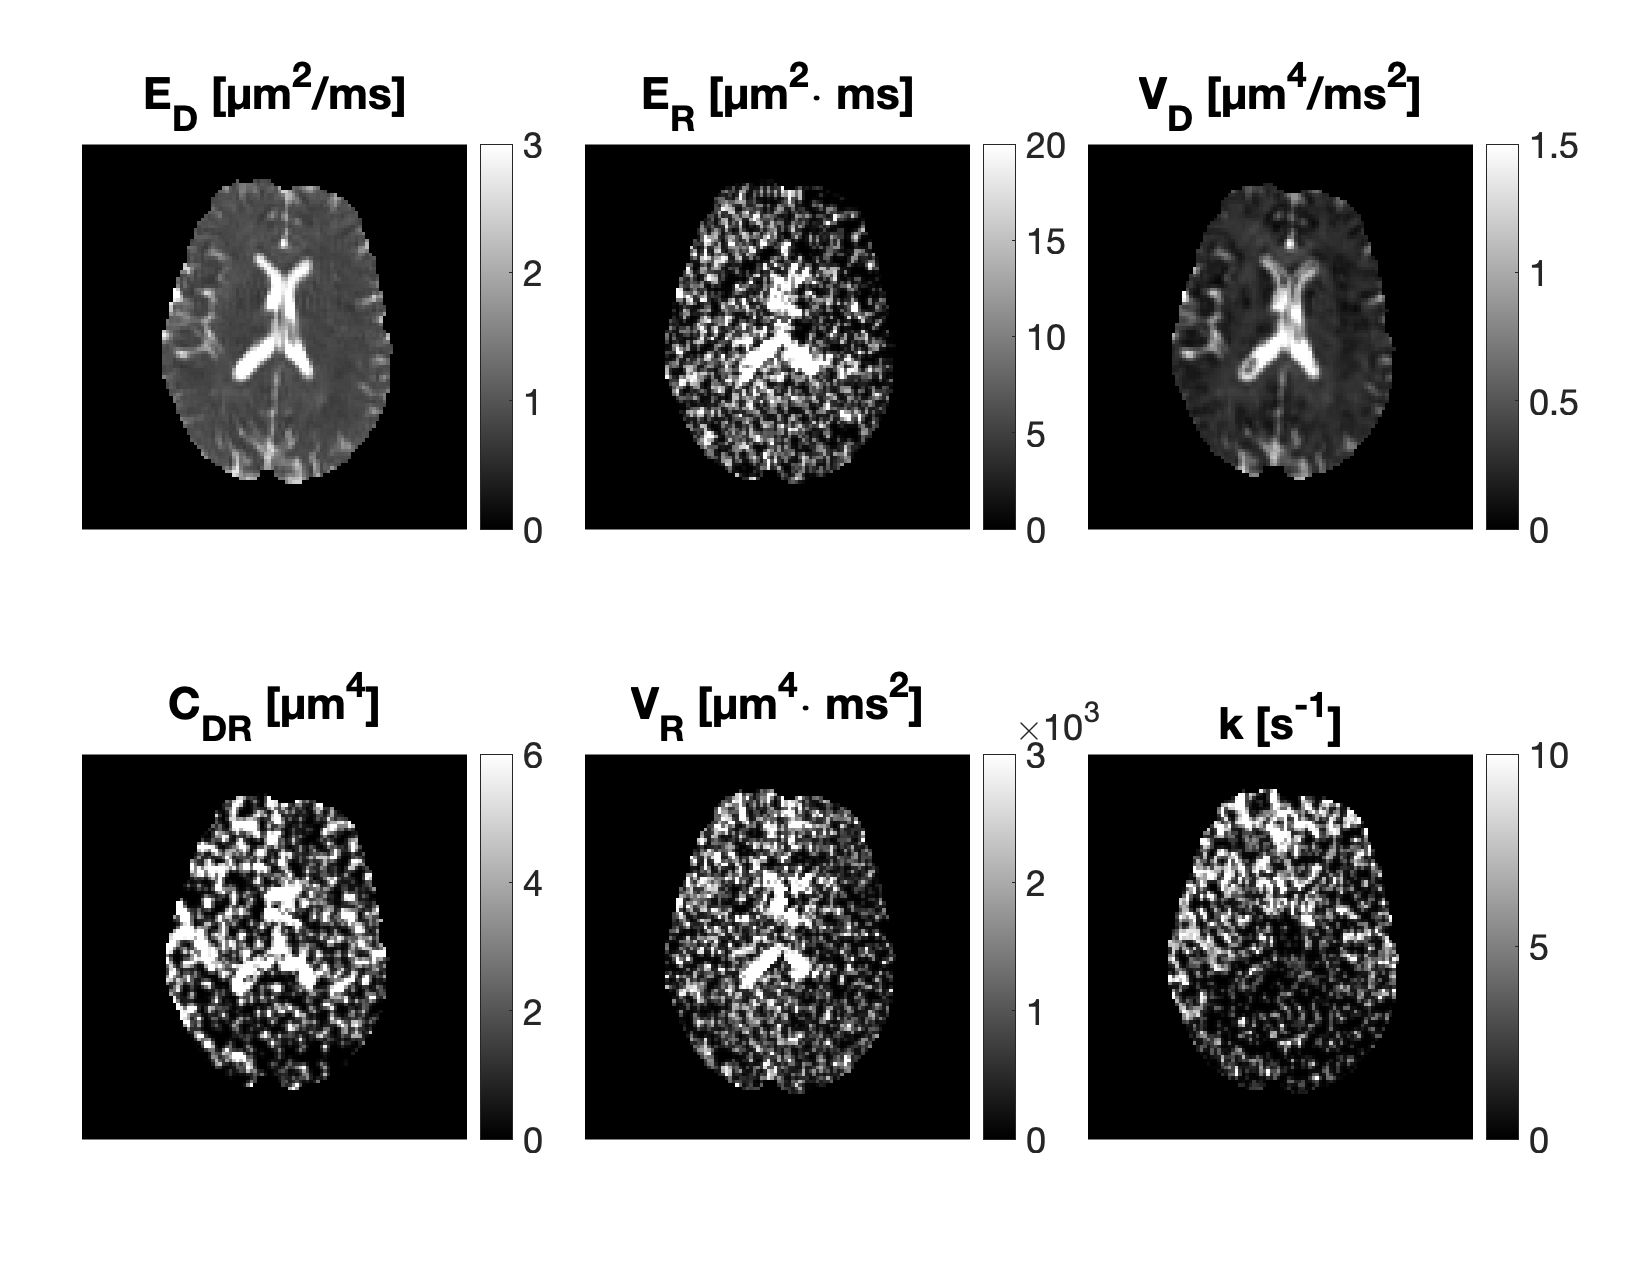
Figure 2 demonstrates that all parameters of our framework exhibit sensitivity to varying yeast cell density. We note that our measurements of exchange rate for the highest yeast cell density lie within a plausible range compared to previous reports. 11 Exchange rates in lower yeast densities are somewhat larger than literature values. Our estimates of $$$E_R$$$ give yeast cell diameters between 3 and 8 $$$\mu$$$m (using $$$R = c\cdot d^4/D_0 \text{ with } D_0 \in [0.1 \hspace{6pt} 1] \text{ } \mu\text{m}^2/\text{ms}$$$) which is in agreement with literature.12 Parametric maps obtained from the healthy volunteer are shown in Figure 3. The maps are considerably noisy. Figure 4 shows parametric maps from the meningioma patient. Despite the noise, the location of the tumour is reflected on the majority of the maps. The ROI analysis (Figure 5) shows a detectable contrast in exchange and restriction between normal and abnormal tissue. The lack of parameter correlation in Figure 5 suggests that independent microstructural information is obtained from the exchange rate and the restriction coefficient.Discussion
The phenomena of restricted diffusion and water exchange can be disentangled using a unified theoretical framework in combination with an acquisition protocol that independently probes the two effects. The results of our initial exploration indicate the potential of the method for quantification of restriction and exchange in vivo. We believe that our framework can enable the detection of pathology by providing information beyond what is accessible with the apparent diffusion coefficient. Nevertheless, the variation of $$$\Gamma$$$ and $$$V_{\omega}$$$ in the current protocol produces a subtle contrast, likely to be overpowered by noise. Worse still, noise-induced contrast can mimic contrast related to restriction and exchange. A solution would be to extend the range of $$$\Gamma$$$ and $$$V_{\omega}$$$ in our protocol, but this prolongs the echo time and reduces the SNR. Future work may alleviate this issue by super-resolution reconstruction and will focus on protocol optimisation and applying the framework to a larger number of subjects, to learn the nature and value of the parameters used herein.In conclusion, we have shown that
- Our previously proposed restriction-exchange framework can be used to probe restricted diffusion and water exchange in vivo.
- The framework potentially increases parameter estimate reliability by directly accounting for both restriction and exchange.
Acknowledgements
We thank Siemens Healthcare (Erlangen, Germany) for access to the pulse sequence programming environment.References
1. Stepišnik J. Time-dependent self-diffusion by NMR spin-echo. Physica B: Condensed Matter. 1993 May;183(4):343-350
2. Callaghan PT. A simple matrix formalism for spin echo analysis of restricted diffusion under generalized gradient waveforms. J Magn Reson. 1997;129(1):74-84
3. Kärger J. NMR self-diffusion studies in heterogeneous systems. Adv Colloid Interfac. 1985 Aug;23:129–148.
4. Yablonskiy D, Sukstanskii A. Theoretical models of the diffusion weighted MR signal. NMR Biomed. 2010 Aug;23(7):661-681.
5. Lasič S, Nilsson M, Lätt J, Ståhlberg F, Topgaard D. Apparent exchange rate mapping with diffusion MRI. Magn Reson Med. 2011;66(2):356-365
6. Nilsson M, Lätt J, van Westen D, et al. Noninvasive mapping of water diffusional exchange in the human brain using filter-exchange imaging. Magn Reson Med. 2013;69(6):1573-1581
7. Nilsson M, Westin CF, Brabec J, Lasic S, Szczepankiewicz F. A unified framework for analysis of time-dependent diffusion: numerical validation of a restriction-exchange correlation experiment. Proceedings of ISMRM. Montreal, QC, Canada. 2019
8. Ning L, Nilsson M, Lasiˇc S, Westin C, Rathi Y. Cumulant expansions for measuring water exchange using diffusion MRI. J Chem Phys. 2018 Feb;148(7):074109.
9. Nilsson M, Lasiˇc S, Drobnjak I, Topgaard D, Westin C. Resolution limit of cylinder diameter estimation by diffusion MRI: The impact of gradient waveform and orientation dispersion. NMR Biomed. 2017 Jul;30(7):e3711
10. Szczepankiewicz F, Sjölund J, Ståhlberg F, Lätt J, Nilsson M. Tensor-valued diffusion encoding for diffusional variance decomposition (DIVIDE): Technical feasibility in clinical MRI systems. PLoS ONE. 2019;14(3):e0214238
11. Karunanithy G, Wheeler RJ, Tear LR, Farrer NJ, Faulkner S, Baldwin AJ. INDIANA: An in-cell diffusion method to characterize the size, abundance and permeability of cells. J Magn Reson. 2019;302:1-13
12. Zakhartsev M, Reuss M. Cell size and morphological properties of yeast Saccharomyces cerevisiae in relation to growth temperature. FEMS Yeast Res. 2018;18(6):10.1093/femsyr/foy052
Figures