3414
Detection of alterations in water transport across the cell membrane by filter-exchange spectroscopy1Department of Nuclear Medicine, Technical University of Munich, School of Medicine, Klinikum rechts der Isar, Munich, Germany
Synopsis
Filter-Exchange Spectroscopy (FEXSY) is performed using a double-diffusion magnetic resonance pulse sequence, which encodes information dependent on transmembrane water exchange. Permeabilized baker’s yeast cells were examined with a FEXSY sequence and trypan blue staining. Upon permeabilization with isopropanol, TritonX-100 and sonication, the AXR value of yeast cells increased and trypan blue staining verified the membrane permeabilization. In presence of low isopropanol concentration, a progressive increase of the AXR value was observed, which stopped after isopropanol removal. No differences were detected in the trypan blue staining over time, in presence and in absence of isopropanol.
Purpose
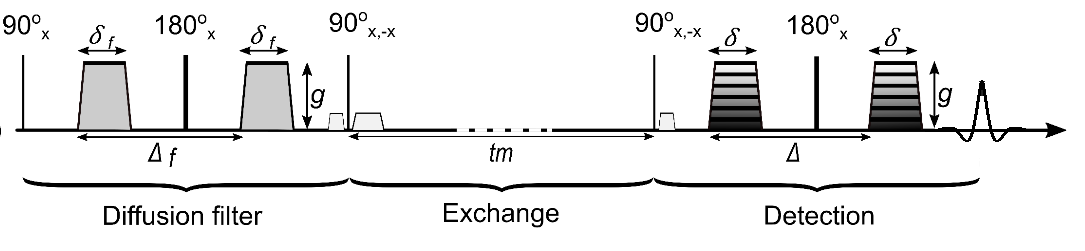
Water permeability of the plasma membrane plays a key role in cell vitality1. Filter-exchange spectroscopy (FEXSY) is a dual diffusion-weighted MR sequence (Figure 1) which detects transmembrane water exchange by using the diffusion properties of water molecules in different microenvironments, quantified by the so-called apparent exchange rate (AXR)2, 3, 4. The aim of this work is to use FEXSY for the quantification of relative changes in cell membrane permeability caused by different permeabilization strategies in vitro.Methods
PhantomsBaker’s yeast cells were treated with the following methods to enhance water exchange across the cell membrane:
1. Organic solvent:
a. 1g yeast cells was shaken gently at 15.6°C with 20ml isopropanol solutions (20%, 25%, 30%) containing PBS5,6 and washed.
b. 1g yeast cells was stirred for 10min with 16.6ml DPBS (no calcium, no magnesium, ThermoFisher) while 3.4ml isopropanol was added on top. The suspension was centrifuged and measured directly after the supernatant removal. After 4 hours the pellet was washed and measured again.
2. Detergent:1g yeast cells was mixed with 10ml 0.4% Triton-X100 solutions containing PBS6, 7 for 15min and 12.50h at 26°C, and then washed.
3. Ultrasonication:3ml yeast suspension (2:1 yeast: water) were sonicated continuously (cycle 1) at 30W/cm2 (UP200S, Hielscher Ultrasound Technology), 21°C for several sonication times (0 – 30min)8.
Microscopy
Viability assessment of the treated baker’s yeast cells was performed on 10μL of each sample with an optical microscope (Olympus BH2) and trypan blue staining.
MR measurement
All experiments were performed on a 7T small animal MRI scanner (Agilent/GE/Bruker) using a 1H solenoid coil (Rapid Biomedical). Acquisition parameters included: diffusion filter at b-value of 2043s/mm2, diffusion encoding at 8 b-values of 59 to 1511s/mm2, mixing times (tm) of 14.5 to 404.5ms, echo time 21.7ms, recovery time 3570ms (time between the third 90°-pulse and the first 90°-pulse of the next acquisition). All measurements were performed at scanner room temperature (15.5 ± 1.0°C).
Data analysis
The water spectral peak intensities were fit to equation 1 to calculate the ADC value for each mixing time. The AXR and filter efficiency (σ) values were calculated according to Equations 2 and 3.
Eq. 1: S(b, tm) = Sf(tm)exp(-b·ADC'(tm)),
Eq. 2: ADC'(tm) = ADC[1-σ·exp(-AXR·tm)],
Eq. 3: σ=1-[ADC'(0)/ADC],
where Sf(tm) is the signal intensity before the application of the detection module and ADC’(tm) the filtered ADC for each mixing time.
Results and Discussion
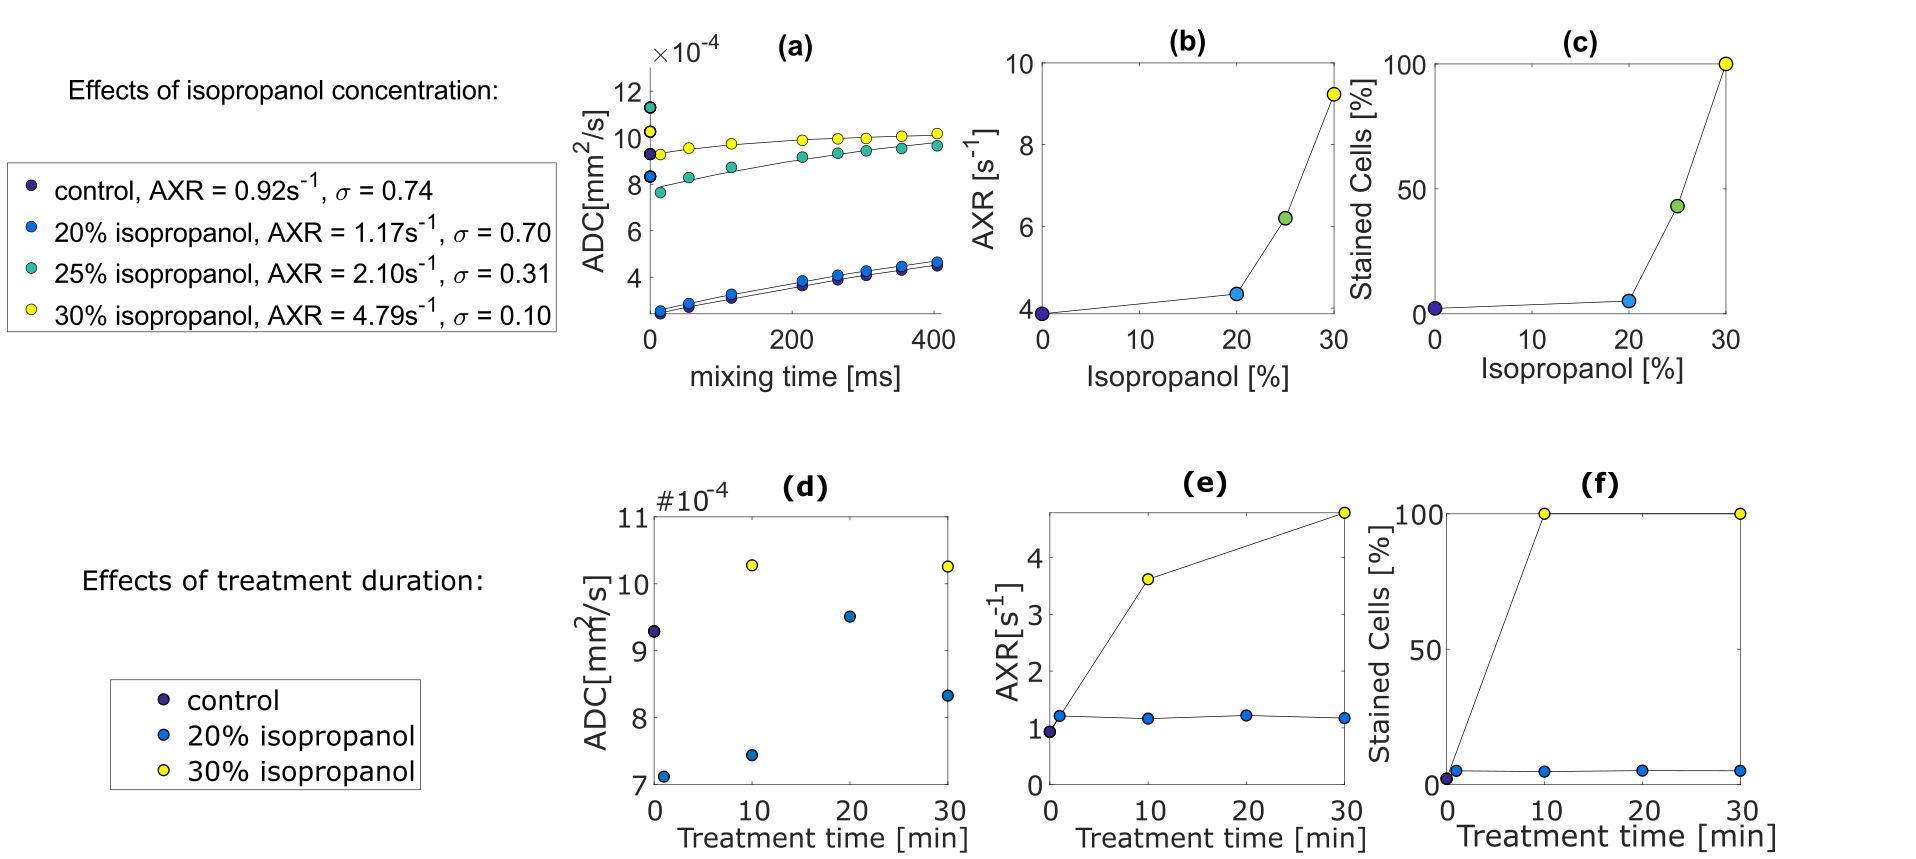
1. Permeabilization by organic solventThe AXR values of phantom 1a increased with isopropanol concentration, consistent with the trypan blue staining results (Figure 2abc). For 20% isopropanol, AXR and stained cells % were independent of treatment duration (Figure 2ef). However, for 30% isopropanol, AXR increased between 10 and 30 minutes, although both samples were 100% stained.
The filter efficiency (σ) (Figure 2a) decreases with the increasing transmembrane water permeability, indicating reduced diffusion restriction after breakdown of the cell membrane. Because isopropanol penetrates cell membranes quickly, treatment duration does not strongly influence early time point treatment effectiveness (<30 min).
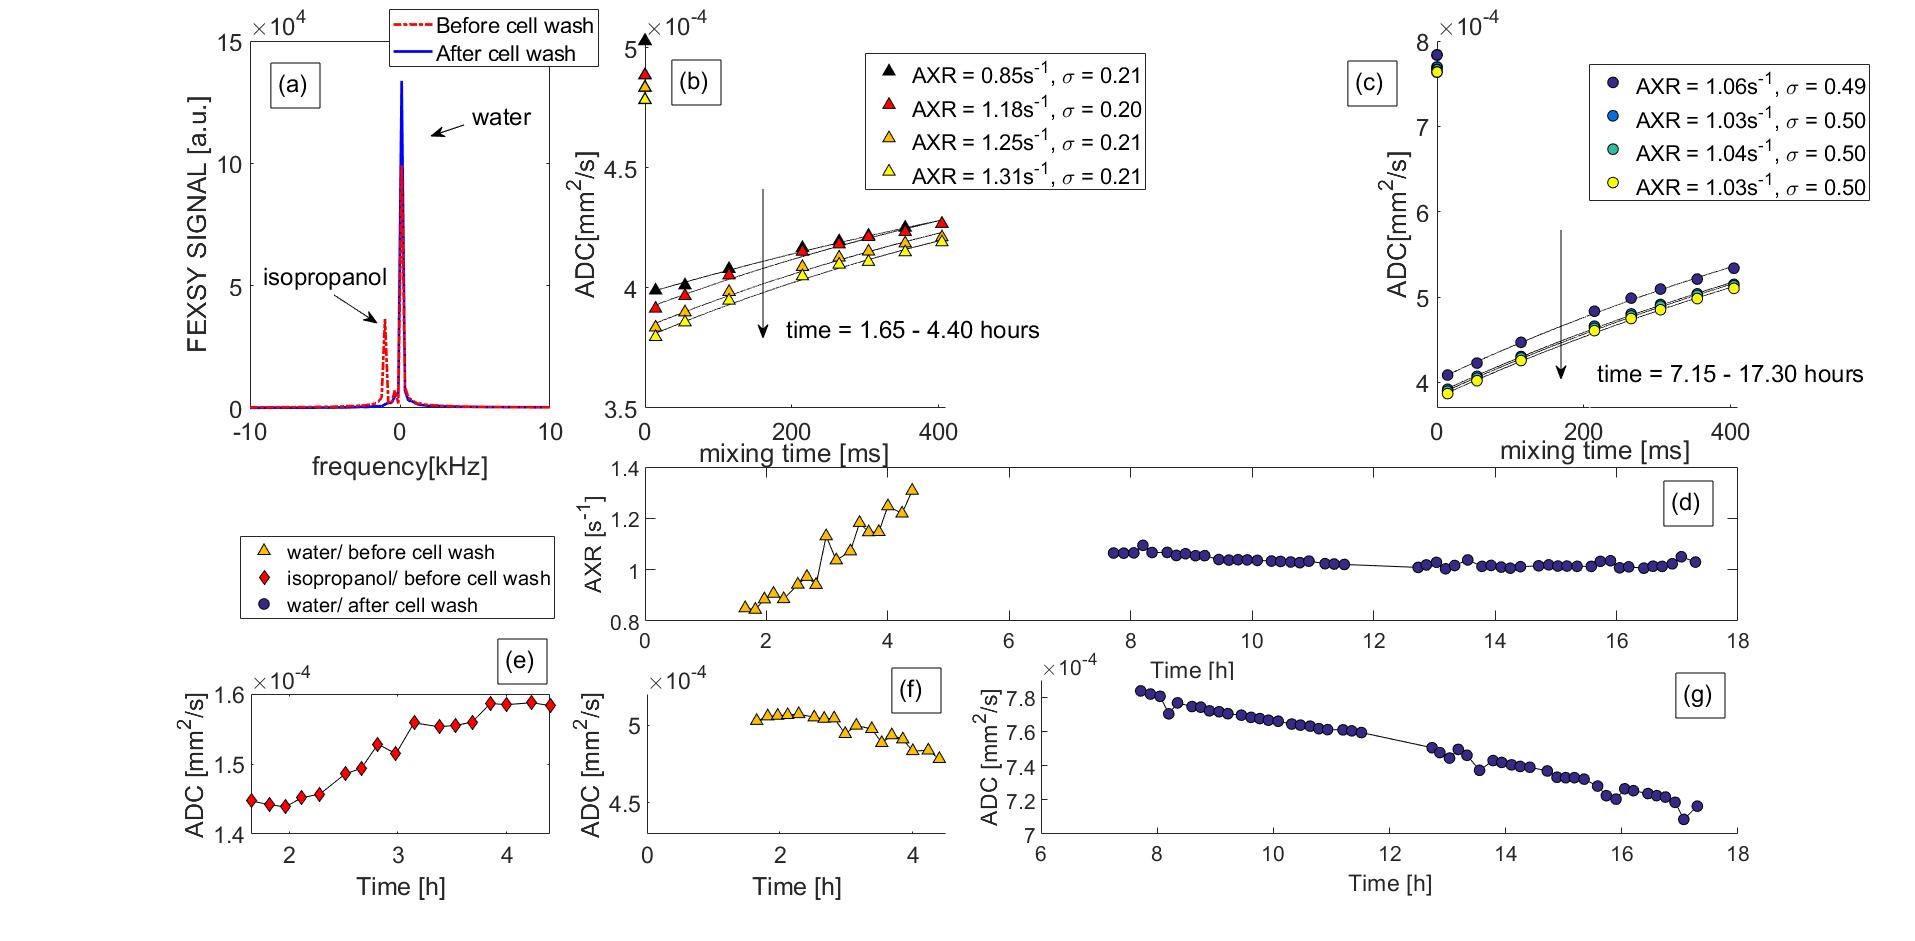
The AXR values of phantom 1b increase over time in presence of isopropanol whereas its AXRs were almost constant after the cell wash (Figure 3bd). No changes in filter efficiency (σ) (Figure 3bc) or trypan blue stained cells (2.4% and 2.9% before cell wash at first and last measurement) were detected along with the AXR increase.
Isopropanol is miscible with water, but, when concentrated and in contact with a salt solution like DPBS, creates a separate layer. Thus, cells are only briefly exposed to and take up isopropanol during the stirring and centrifugation. After remaining extracellular isopropanol is removed with the supernatant, water flows into and isopropanol out of the intracellular space until osmotic equilibrium is reached9. This is consistent with low water AXR shortly after pellet preparation (<4 h) and its increase over time and with increased isopropanol ADC (Figure 3e). In parallel, water ADC reduces over time, as a result of the sedimentation process (Figure 3fg).
2. Permeabilization by a Triton-X100
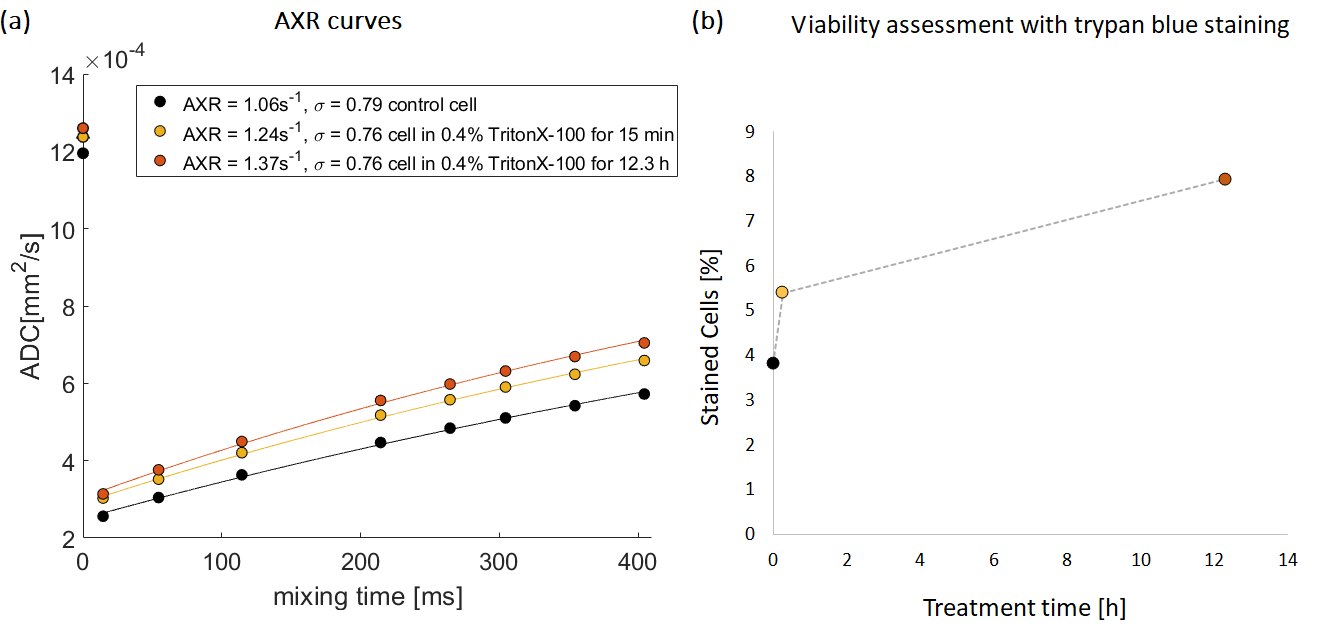
After 15min and 12.50h of Triton-X100 treatment, the AXR of the yeast suspensions increased by 17% and 29%, respectively, ADC values increased by 3.5% and 5.4% and the percentage of stained cells from 3.8% (untreated) to 7.9% (12.50h of treatment) (Figure 4ab).
3. Permeabilization by sonication
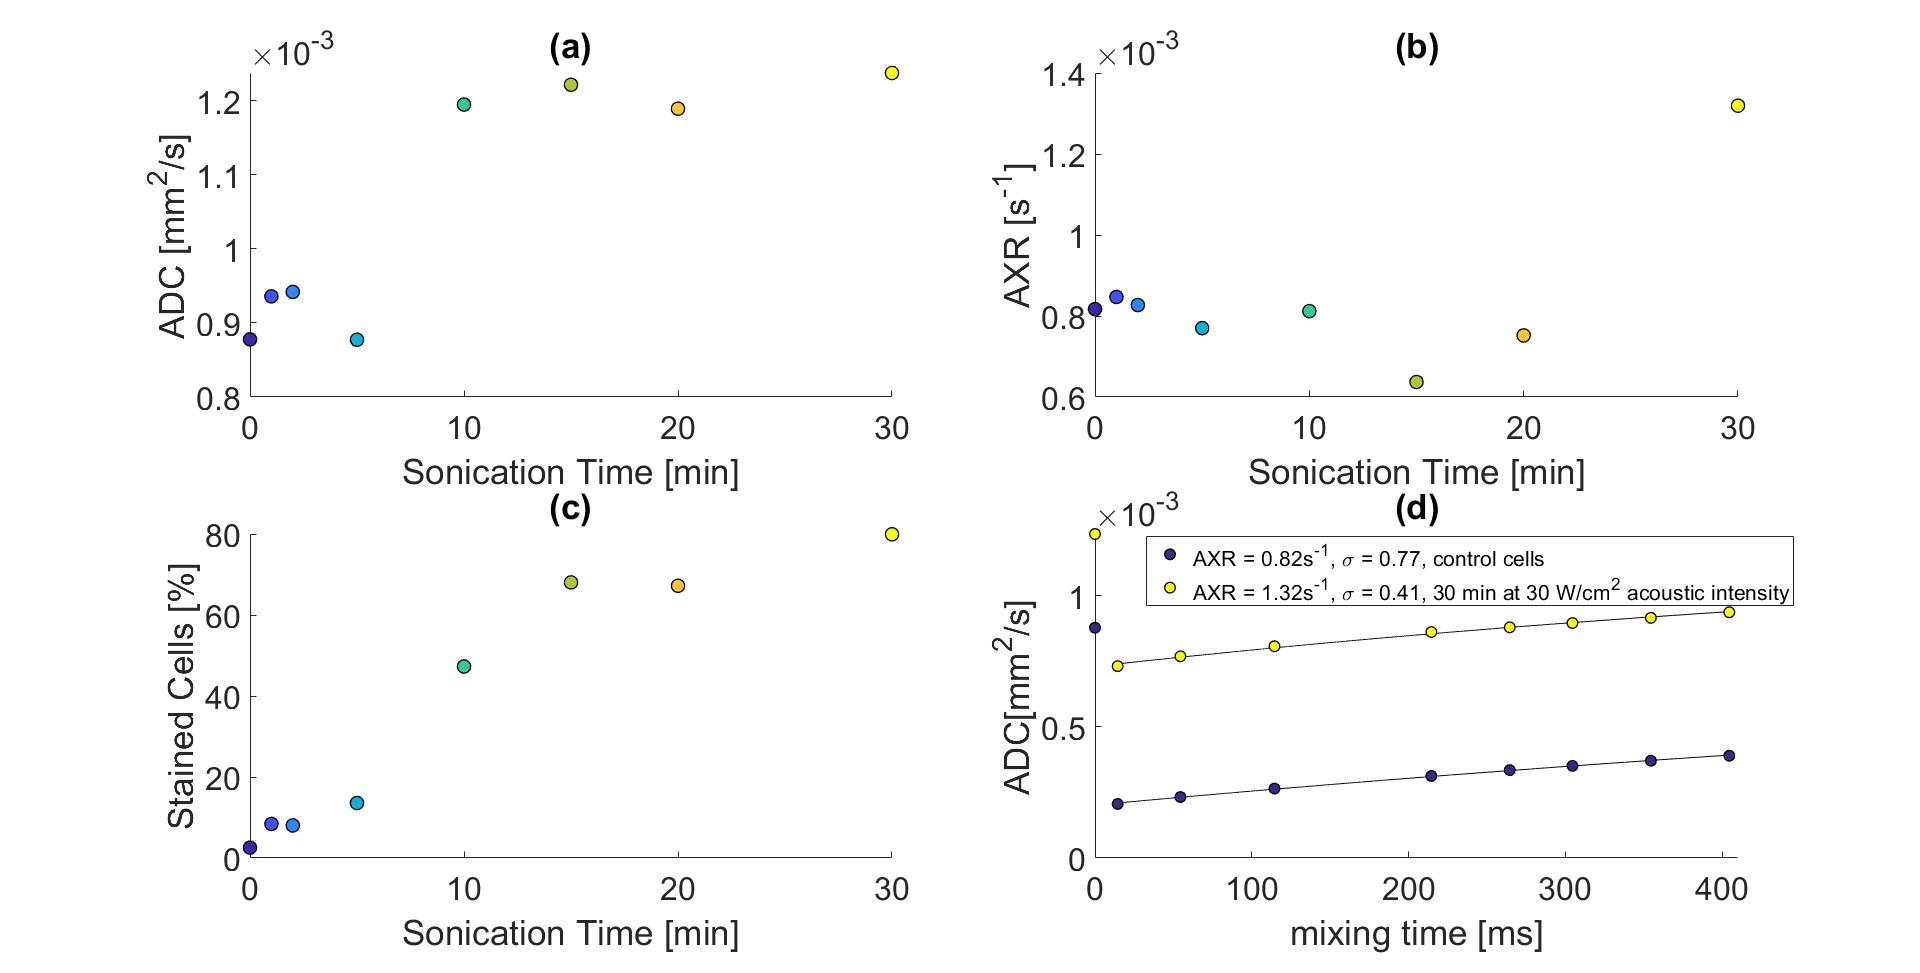
After sonication (30 W/cm2) for >=10min, yeast suspension ADC increased by 36%, whereas AXR increased by 61% only after 30min (Figure 5ab). Trypan blue stained cells percentage showed increases after 10min (Figure 5c). Tao W. et al.8 have shown that the ultrasonic disruption begins with yeast cell wall breakdown and continues with cell membrane damage.
Variation of control cells' AXR values between the different experiments is presumably related to differences in sample preparation.
Conclusion
FEXSY measurements of baker’s yeast cells permeabilized by isopropanol, TritonX-100 and sonication treatment show an increase of the AXR, which is confirmed by an increase in trypan blue staining. AXR also increased without increase in trypan blue staining due to net water flux through the cell membrane triggered by osmotic imbalance. Consequently, FEXSY detects alterations of the water transport across the living cells membranes.Acknowledgements
The present work was supported by the Deutsche Forschungsgemeinschaft (DFG, German Research Foundation – 391523415, SFB 824).References
1. Galluzzi L, Vitale I, Aaronson SA, et al. Molecular mechanisms of cell death: recommendations of the Nomenclature Committee on Cell Death 2018. Cell Death Differ. 2018;25(3):486–541.
2. Nilsson M, Lätt J, Westen D, et al. Noninvasive mapping of water diffusional exchange in the human brain using filter-exchange imaging. Magn Reson Med. 2013; 69(6): 1573–1581.
3. Lasič S, Nilsson M, Lätt J, et al. Apparent exchange rate mapping with diffusion MRI. Magn Reson Med. 2011; 66(2):356-65.
4. Aslund I, Nowacka A, Nilsson M, et al. Filter-exchange PGSE NMR determination of cell membrane permeability. Magn Reson Med. 2011; 66(2):356-65.
5. Trawczyńska I, Miłek J, Sylwia JK. Effect of temperature, consentration of alcohols and time on baker’s yeast permiabilization process. Technical Sciences. 2018; 21(3), 195–206.
6. PBS preparation according to https://www.cusabio.com/m-296.html#a13
7. Shailasree S, Nagajyothi B, Santhoor G. B, al. Preparation of detergent permeabilized Bakers’ yeast whole cell catalase. Process Biochemistry. 1990; 34(4):349–354.
8. Tao W, Xiao Y, Antuo H, et al. Ultrasonic disruption of yeast cells: Underlyingmechanism and effects of processing parameters. Innovative Food Science & Emerging Technologies. 2005; 28: 59-65.
9. Reuss L. Water transport across cell membranes. Wiley Online Library. 2012.
Figures