3413
Temperature and Concentration Dependence of PVP Phantom Diffusion1Radiology, University of Michigan, Ann arbor, MI, United States
Synopsis
This study investigates temperature and concentration dependence of apparent diffusion coefficient (ADC) for aqueous solutions of polyvinylpyrrolidone (PVP). Our objective is to report accurate diffusion values for PVP in the scanner room temperature range. We performed ADC measurements of PVP (0-50% concentration) with K40 polymer moiety at multiple room temperatures while simultaneously measuring internal phantom temperature using an MRI-compatible optical thermometer. To reduce measurement bias, we also performed “gradient calibration” of each physical gradient channel using water ADC at 0oC. Our results are consistent with Arrhenius model for water ADC dependence on temperature and PVP concentration.
Introduction
Diffusion weighted imaging (DWI) offers a non-invasive tool that evaluates the self-diffusion of water in biological tissues. Widespread implementation of quantitative DWI in clinical studies at different sites and systems demands quality control assessments for apparent diffusion coefficient (ADC) accuracy and comparability. DWI phantoms based on polyvinylpyrrolidone (PVP) solutions in water have been regularly used to validate this quantitative technique providing mono-exponential DWI signal decay with increasing b-value [1]. The accuracy of the water ADC in PVP phantoms depends on solution sustainability and temperature that has not been studied extensively [2]. As such, the goal of this study is to investigate the temperature dependence of different PVP concentrations in the scanner room temperature range.Materials and Methods
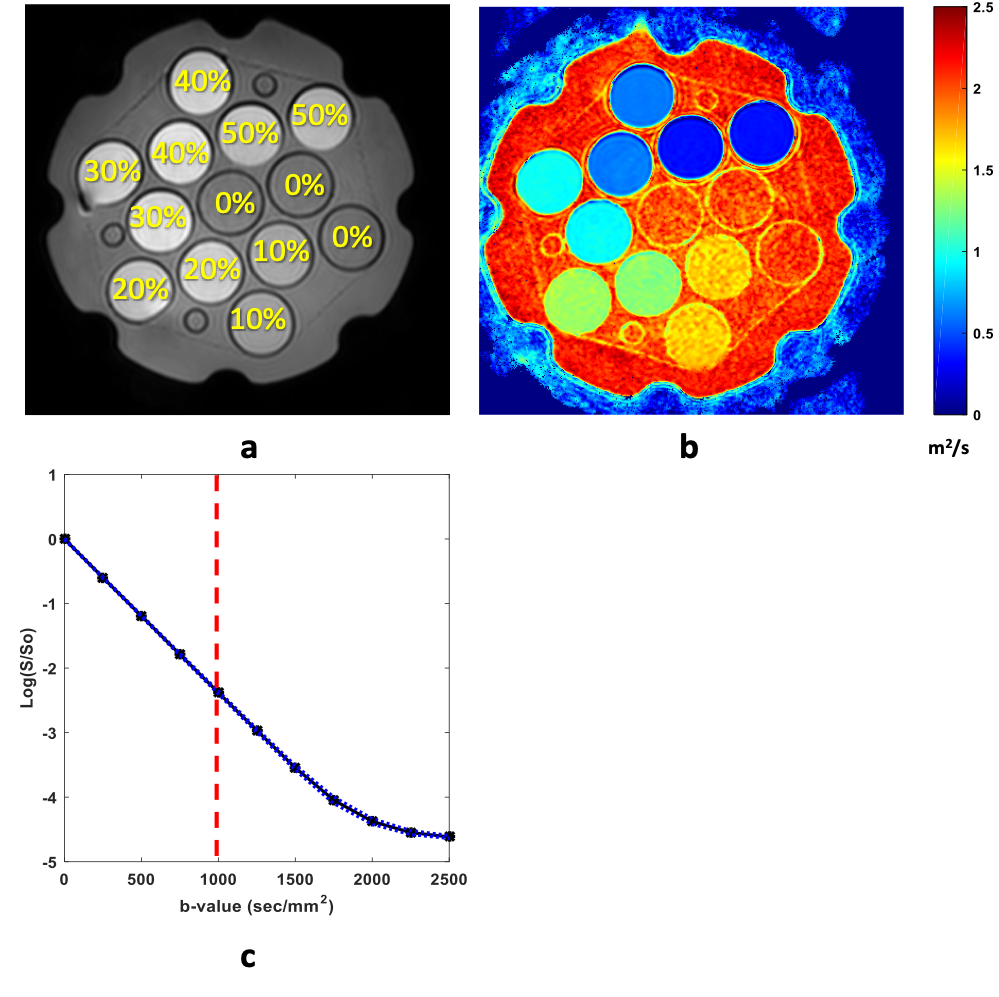
A commercial DWI phantom containing PVP-concentrations from 10% to 50% (w/w) made with K40 polymer was used [1]. DWI scans with (b=0:250:2500) in 3 directions were acquired for 10 repeated dynamics and later averaged. MRI acquisition was performed on a clinical 3T scanner with the phantom positioned at magnet isocenter in the head coil. A “gradient calibration” step was performed for each physical gradient channel used to encode diffusion. For this calibration, a water tube held at 0oC surrounded by ice-water was utilized where the diffusion coefficient was assumed to be 1.099 x 10⁻³ mm2/s [3]. To calibrate ADC variations for the typical scanner room temperature range, scans were acquired at equilibrated temperatures of 19.5o, 22.5o, and 26.4o C. To document temperature stability, the phantom’s internal temperature was measured using an MRI-compatible optical thermometer with an accuracy better than ±0.1oC every 5 minutes during MR acquisitions.Results and Discussion
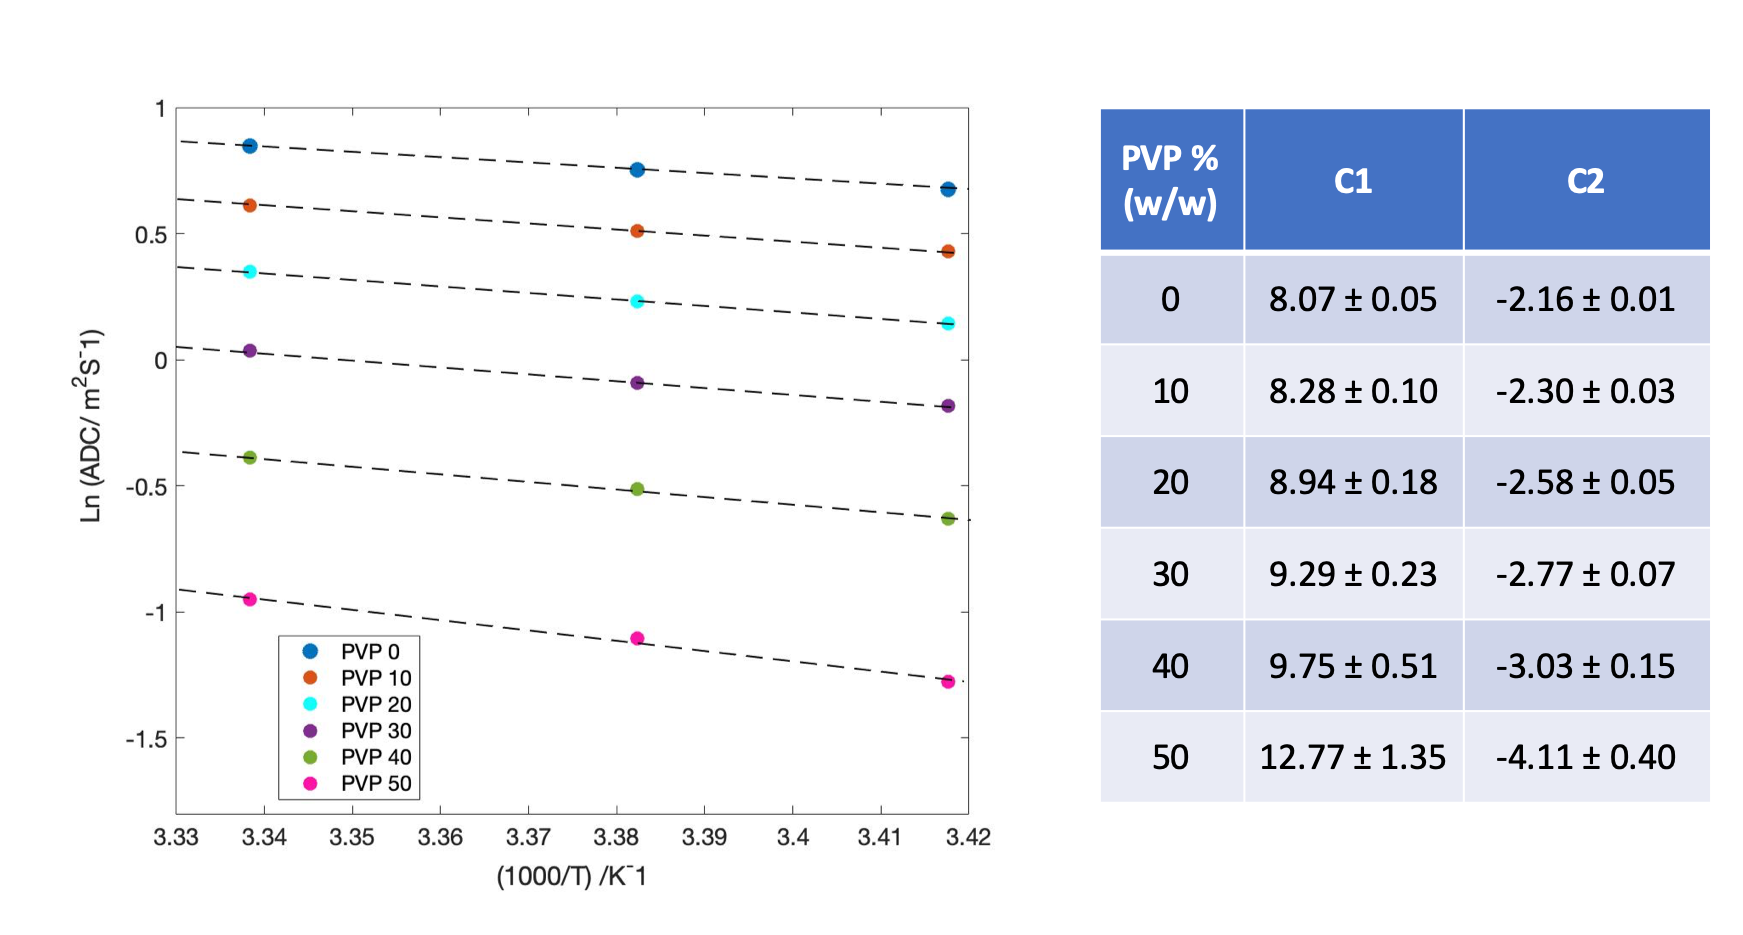
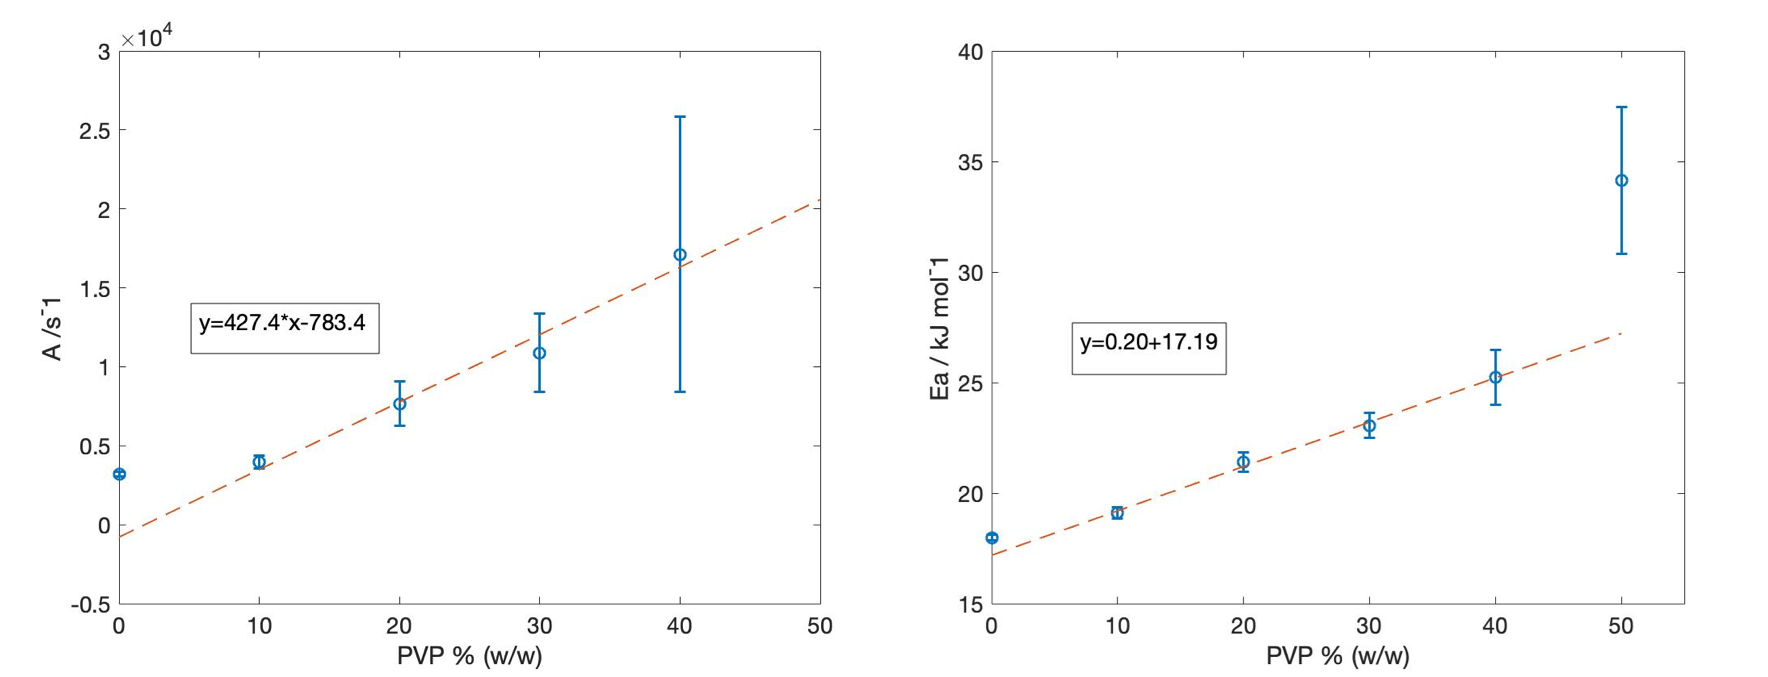
Figure 1 shows the middle slice of the phantom representing the position of each tube and its ADC value. Figure 1c displays the signal decay versus b-values for the water tube revealing noise floor bias at high b-values. To hold predicted bias <0.5%, maximum b-value used in analysis varied with %[PVP]: b-max = 1000, 1250, 1500, 2250, 2500, 2500 for [PVP] = 0, 10, 20, 30, 40, 50% respectively. Mean ADC values were extracted for ROIs inside each tube. As shown in figure 2 a linear dependence with temperature was observed for log-ADC of water at each PVP concentration following Arrhenius behavior, ADC=Aexp(Ea/RT) [2,3]. In this model, A and Ea are the collision frequency factor and activation energy respectively, and R is the gas constant. As such, a linear regression model was used to find C1 and C2 coefficients and their standard errors (Fig.2) for each PVP concentration based on the following equation: ln (ADC /m2s-1) = C1 + C2[1000/(T/K)]. Using C1 and C2, A and Ea for each PVP concentration were calculated and plotted in figure 3. As shown in figure 3, excluding 50% and 0% PVP outliers, A, and Ea were linearly dependent on the PVP concentration for the investigated temperature and PVP concentration range. Diffusion measurements reflect the effective displacement of water molecules allowed to move for a given time. Collisions with solute particles, hydrogen bonding, and the solution’s temperature can slow the water diffusion. Although temperature dependence is rarely relevant in tissue diffusion measurements due to efficient body temperature control, the effect in phantom reference standards such as PVP solutions has not been adequately investigated. This study provides accurate measurements for ADC values of PVP solutions over the range of typical scanner room temperatures. Linear fit coefficients reported for each PVP concentration can be used for temperature calibrations. Additionally, it was shown that increasing the PVP concentration between 10% and 40% in the phantoms impedes water diffusion such that the collision frequency factor and activation energy are increased linearly. The frequency factor scales linearly with PVP concentration, as expected, while activation energy is moderately increasing consistent with increased hydrogen bonding. The performed calibration and regression model would allow prediction of accurate ADC values for PVP phantoms of concentrations between 10% and 40% scanned at ambient room temperatures using the following equation: ADC=(427.4[PVP]-783.4) exp((0.2[PVP]+17.19)/RT)Acknowledgements
This work is supported by NIH Grants: U01CA166104, U24CA237683References
[1] Palacios et al., Towards Precision and Reproducibility of Diffusion Tensor Imaging: A Multicenter Diffusion Phantom and Traveling Volunteer Study. AJNR Am J Neuroradiol.38(3): 537–545, 2017.
[2] F. Wagner et al., “Temperature and concentration calibration of aqueous polyvinylpyrrolidone (PVP) solutions for isotropic diffusion MRI phantoms,” PLoS One.12 (6): 1–13, 2017.
[3] M. Holz, S. R. Heil, and A. Sacco, “Temperature-dependent self-diffusion coefficients of water and six selected molecular liquids for calibration in accurate 1H NMR PFG measurements,” Phys. Chem. Chem. Phys. 2 (20): 4740–4742, 2000.
Figures