3411
Normalization of Temperature Effects for Improved Quantitative Prostate Apparent Diffusion Coefficient (ADC) Imaging Across Multiple Sites1The University of Texas M.D. Anderson Cancer Center, Houston, TX, United States, 2Department of Imaging Physics, The University of Texas M.D. Anderson Cancer Center, Houston, TX, United States, 3Department of Abdominal Radiology, The University of Texas M.D. Anderson Cancer Center, Houston, TX, United States
Synopsis
Performing a standardized measurement of ADC requires maintaining a phantom temperature of 0oC. To expand quality assurance of ADC measurement on a network of scanners at room temperatures, a model for temperature dependence was applied as a correction factor. A diffusion phantom was scanned on 1.5T and 3T scanners at four locations using sequence parameters from a prostate protocol. With temperature of the phantom measured at each acquisition, ADC measurements on identically configured scanners exhibited reduced variance when normalized to modeled values. The use of the temperature model is potentially useful in developing a QA program for ADC measurements.
Introduction
Diffusion weighted imaging (DWI) is a key component of multiparametric prostate MRI with the quantitative apparent diffusion coefficient (ADC) values serving as an important clinical biomarker of prostate cancer. ADC values have been used to assess tumor aggressivity, guide targeted biopsy and predict therapeutic outcomes, thus the accuracy of quantitative ADC measurements is essential [1-5]. Quantitative ADC is dependent on a wide range of factors, which confounds the use of ADC for characterizing tumors when applied across multiple scanners. While ADC measurements within a protocol may be validated with the use of a standardized phantom, acquisition of these phantom measurements necessitates a phantom temperature of 0°C to eliminate the temperature dependence of ADC. This can be burdensome when validating ADC acquisitions as part of a quality assurance program for a large number of scanners at multiple sites. In this study, we investigated the feasibility of using a model for temperature dependence of ADC as a correction factor on measurements acquired at room temperature within a multiparametric prostate protocol on multiple MR scanners.Methods
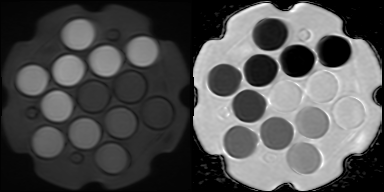
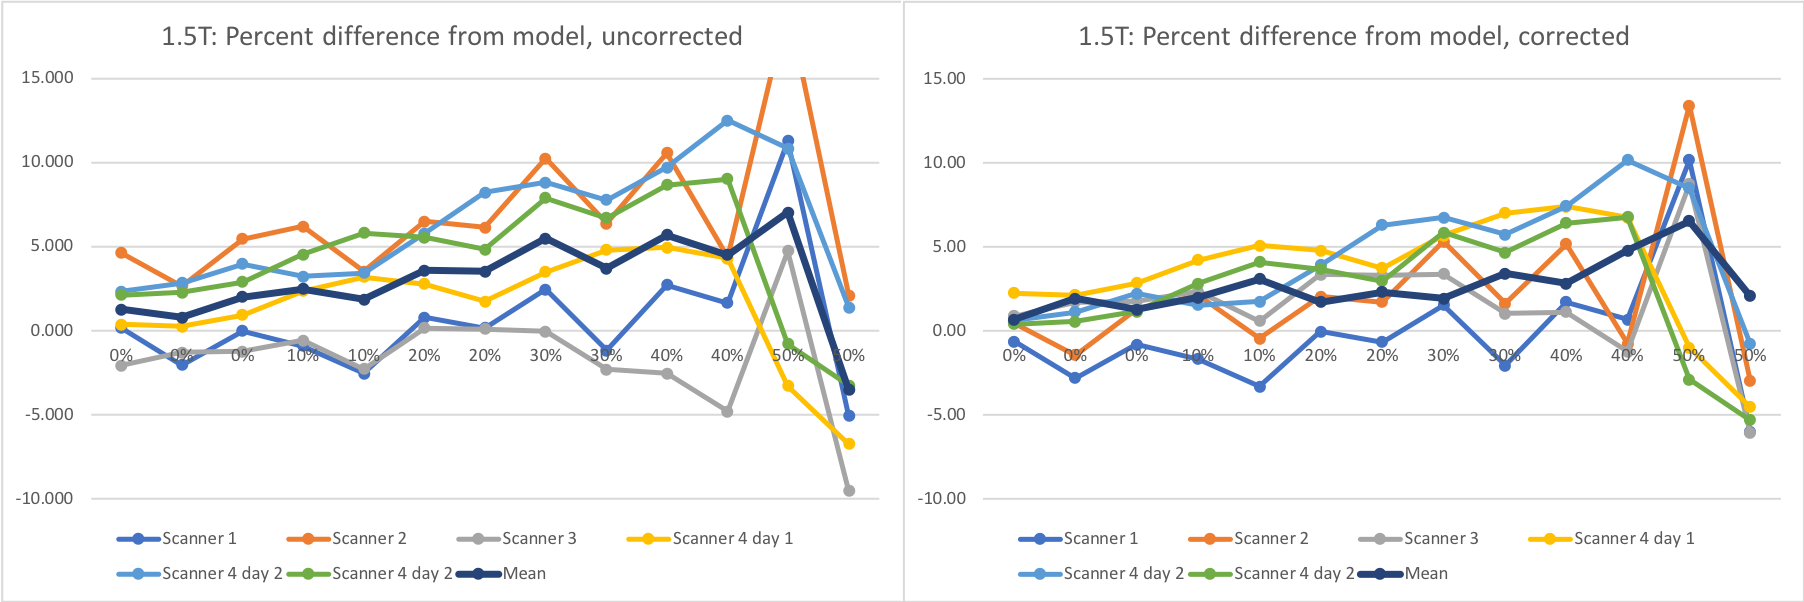
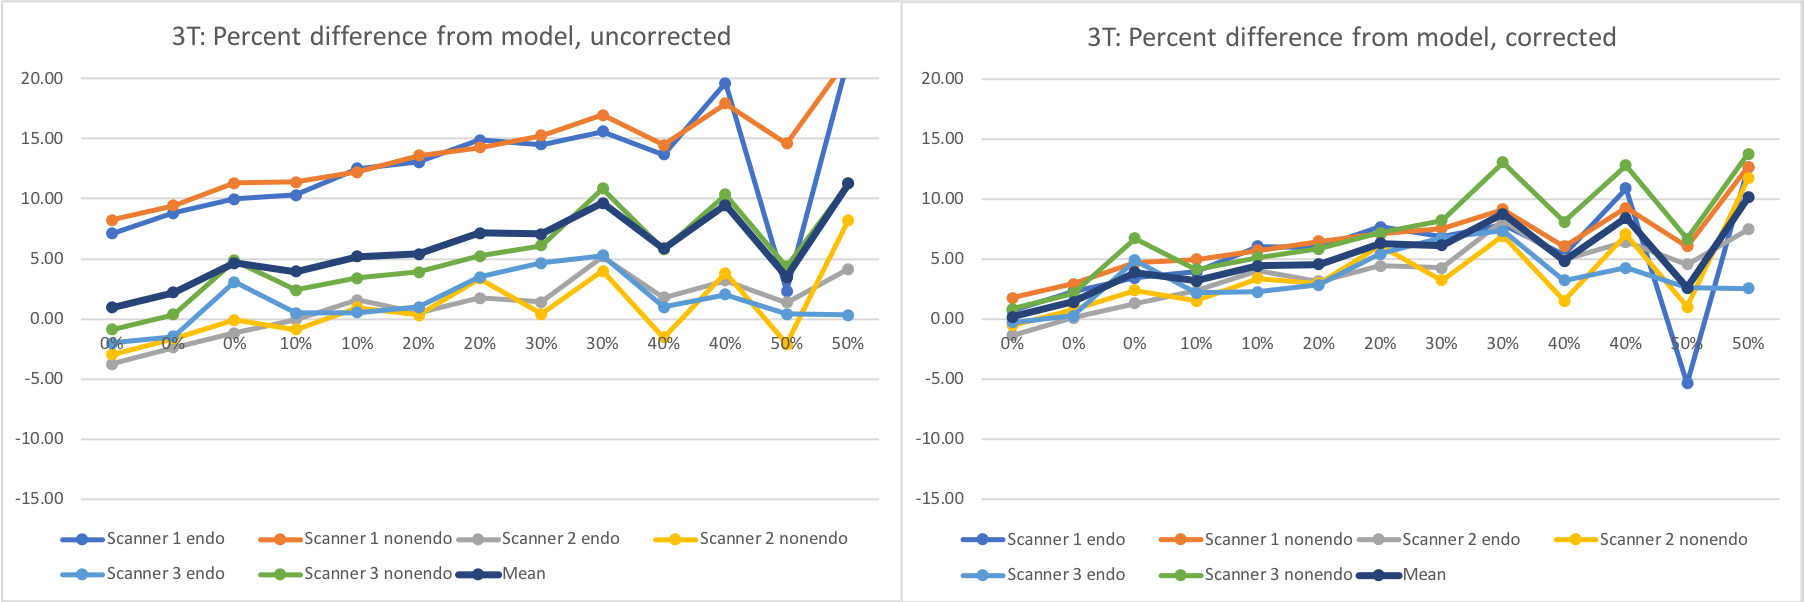
The NIST / QIBA diffusion standard phantom (QMRI, Boulder, CO) [6,7] includes 13 vials containing polyvinylpyrrolidone (PVP) at concentrations of 0%, 10%, 20%, 30%, 40%, and 50%. The vials exhibit decreasing levels of diffusion with increasing PVP concentration. This phantom was scanned on both 1.5 T MRIs (n=4, Aera, Siemens Medical Solutions, Erlangen, Germany) and 3T scanners (n=3, Skyra, Siemens Medical Solutions, Erlangen, Germany) at four different geographical sites within our institutional network. At each site, the phantom was filled with water and its temperature was adjusted with ice or warm water to match room temperature to within 0.5°C. The temperature of the water in the phantom was measured immediately before positioning and immediately after acquisition. The sequence acquired with this phantom was the small FOV diffusion weighted acquisition employed in our multiparametric prostate MR protocol. Sequence parameters were matrix=96x80, FOV=180mm, slices=30, thickness/gap =3mm/0mm, TR=5600-5700, TE=55-56, Partial Fourier=6/8, GRAPPA acceleration factor=2, b=(50,800)s/mm2, averages=(2,16). Given the incompatibility of endorectal coil use with this phantom, the phantom was positioned on a spine array coil and coronal slices were acquired, oriented orthogonal to the vials within the phantom. 3T scanners were also scanned with the DWI sequence from our non-endorectal protocol, which has FOV=200mm and matrix = 80x80. Repeated measurements were also made on one 1.5T scanner on a separate day.ADC values were measured within each of the vial of the phantom using ROIs of a fixed diameter of 2 cm. A model for ADC dependence of PVP on temperature for each vial concentration [8] was used to predict ADC values in our experiments. ADC is modeled with the exponential equation C1*exp(C2*T), where T is temperature and C1 and C2 are coefficients provided for each concentration. One set of calculations normalized the measured ADC values to predicted ADC at 20°C, while a second set of calculations normalized to predicted ADC using the individual temperatures measured for acquisition. For each set of normalized measurements, percent difference from predicted values was calculated, and the mean and standard deviation of those differences across scanners was compared for each vial.
Results
For PVP concentrations from 0% to 40%, the standard deviation of measured ADC across scanners ranged from 2.12% to 5.99% for 1.5T and 5.14% to 7.79% for 3T when all measurements were normalized to predicted ADC at 20°C. The standard deviation of the same measurements ranged from 0.21% to 4.87% for 1.5T and 1.12% to 3.13% for 3T when measurements were normalized to predicted ADC at their respective measured temperatures. While normalized ADC at 50% varied widely on a percent basis, measured ADC values generally trended higher than predicted ADC values with increasing concentrations.Discussion
This study confirms that ADC variance due to temperature can be reduced by applying a model for predicted ADC that takes temperature into account. By reducing or eliminating temperature as a factor, variances of ADC values may more accurately reflect variations in other factors, potentially establishing a simplified QA process for ADC measurements when employing a protocol across multiple scanners at multiple geographic sites. In this study, our analysis was applied separately to two system designs by the same vendor to avoid factors due to vendor or hardware configuration. While efforts were made to equalize the phantom water to room temperature, the room temperature was noted to fluctuate, possibly due to environmental air conditioning controls. Also, while water temperature was measured, measurements were not obtained directly from the embedded vials; hence it is unknown whether the temperature had fully equilibrated throughout the phantom. It was noted that temperature after acquisition was almost always slightly warmer than temperature measured before acquisition.Moreover, measured values obtained were higher than predicted values at higher PVP concentrations, suggesting the need for additional system testing to confirm whether this is trend is specific to these systems designs or if a correction to the model is needed. Future work will expand this analysis to other vendors and system designs.Acknowledgements
No acknowledgement found.References
1. Tamada T, Sone T, Jo Y, Yamamoto A, Ito K. Diffusion-weighted MRI and its role in prostate cancer. NMR Biomed. 2014 Jan;27(1):25-38. doi: 10.1002/nbm.2956. Epub 2013 May 27. PMID: 23712781.
2. Tamada T, Prabhu V, Li J, Babb JS, Taneja SS, Rosenkrantz AB. Prostate Cancer: Diffusion-weighted MR Imaging for Detection and Assessment of Aggressiveness-Comparison between Conventional and Kurtosis Models. Radiology. 2017 Jul;284(1):100-108. doi: 10.1148/radiol.2017162321. Epub 2017 Apr 10. PMID: 28394755.
3. Rosenkrantz AB, Meng X, Ream JM, Babb JS, Deng FM, Rusinek H, Huang WC, Lepor H, Taneja SS. Likert score 3 prostate lesions: Association between whole-lesion ADC metrics and pathologic findings at MRI/ultrasound fusion targeted biopsy. J Magn Reson Imaging. 2016 Feb;43(2):325-32. doi: 10.1002/jmri.24983. Epub 2015 Jul 1. PMID: 26131965.
4. Itou, Y. et al. Clinical utility of apparent diffusion coefficient (ADC) values in patients with prostate cancer: Can ADC values contribute to assess the aggressiveness of prostate cancer? J. Magn. Reson. Imaging 2011; 33: 167-172.
5. Stefanie J. Hectors, Sahar Semaan, Christopher Song, Sara Lewis, George K. Haines, Ashutosh Tewari, Ardeshir R. Rastinehad, and Bachir Taouli. Advanced Diffusion-weighted Imaging Modeling for Prostate Cancer Characterization: Correlation with Quantitative Histopathologic Tumor Tissue Composition—A Hypothesis-generating Study. Radiology 2018; 286(3): 918-928.
6. Boss MA. Multicenter study of reproducibility of wide range of ADC at 0°C. Chicago: RSNA; 2015.
7. Palacios EM, Martin AJ, Boss MA, et al. Toward precision and reproducibility of diffusion tensor imaging: a multicenter diffusion phantom and traveling volunteer study. AJNR Am J Neuroradiol 2017; 38:537–545.
8. Wagner F, et al. Temperature and concentration calibration of aqueous polyvinylpyrrolidone (PVP) solutions for isotropic diffusion MRI phantoms. PLOS ONE 2017; 12(6): e0179276.
Figures