3410
Assessment of the effects of cellular properties in tissue on ADC measurements by an experimental study1South China University of Technology, Guangzhou, China
Synopsis
The apparent diffusion coefficient (ADC) provided by diffusion-weighted magnetic resonance imaging (DW-MRI) has been used clinically for nearly three decades. Some hypotheses have been proposed to explain the change in ADC, including the change in membrane permeability, intracellular volume fraction (IVF), tortuosity of extracellular spaces, and intracellular diffusivity. However, no experimental study has been conducted to quantitatively assess the effects of these parameters on the ADC measurements. Experimental study is helpful to understand the biophysical mechanisms underlying the change in the ADC. Here, we designed a series of multi-parameter phantoms to conduct a quantitative experimental study.
Introduction
The apparent diffusion coefficient (ADC) provided by diffusion-weighted magnetic resonance imaging (DW-MRI) has been used clinically for nearly three decades.Some hypotheses have been proposed that the change in ADC is determined by the change in some cellular parameters in tissue, including membrane permeability1,2, intracellular volume fraction (IVF)1,3, tortuosity of extracellular spaces1,3, and intracellular diffusivity1,4. However, quantitative experimental study on the effect of these parameters on the ADC measurements has not been conducted. This study presents a series of phantoms with adjustable parameters to conduct a quantitative experimental measurement. Three phantom parameters (i.e., fiber permeability, volume fraction, and polyvinylpyrrolidone (PVP) concentration of the intra-fiber spaces) were used to characterize three cellular parameters (i.e., membrane permeability, intracellular volume fraction, and diffusivity), respectively.Methods
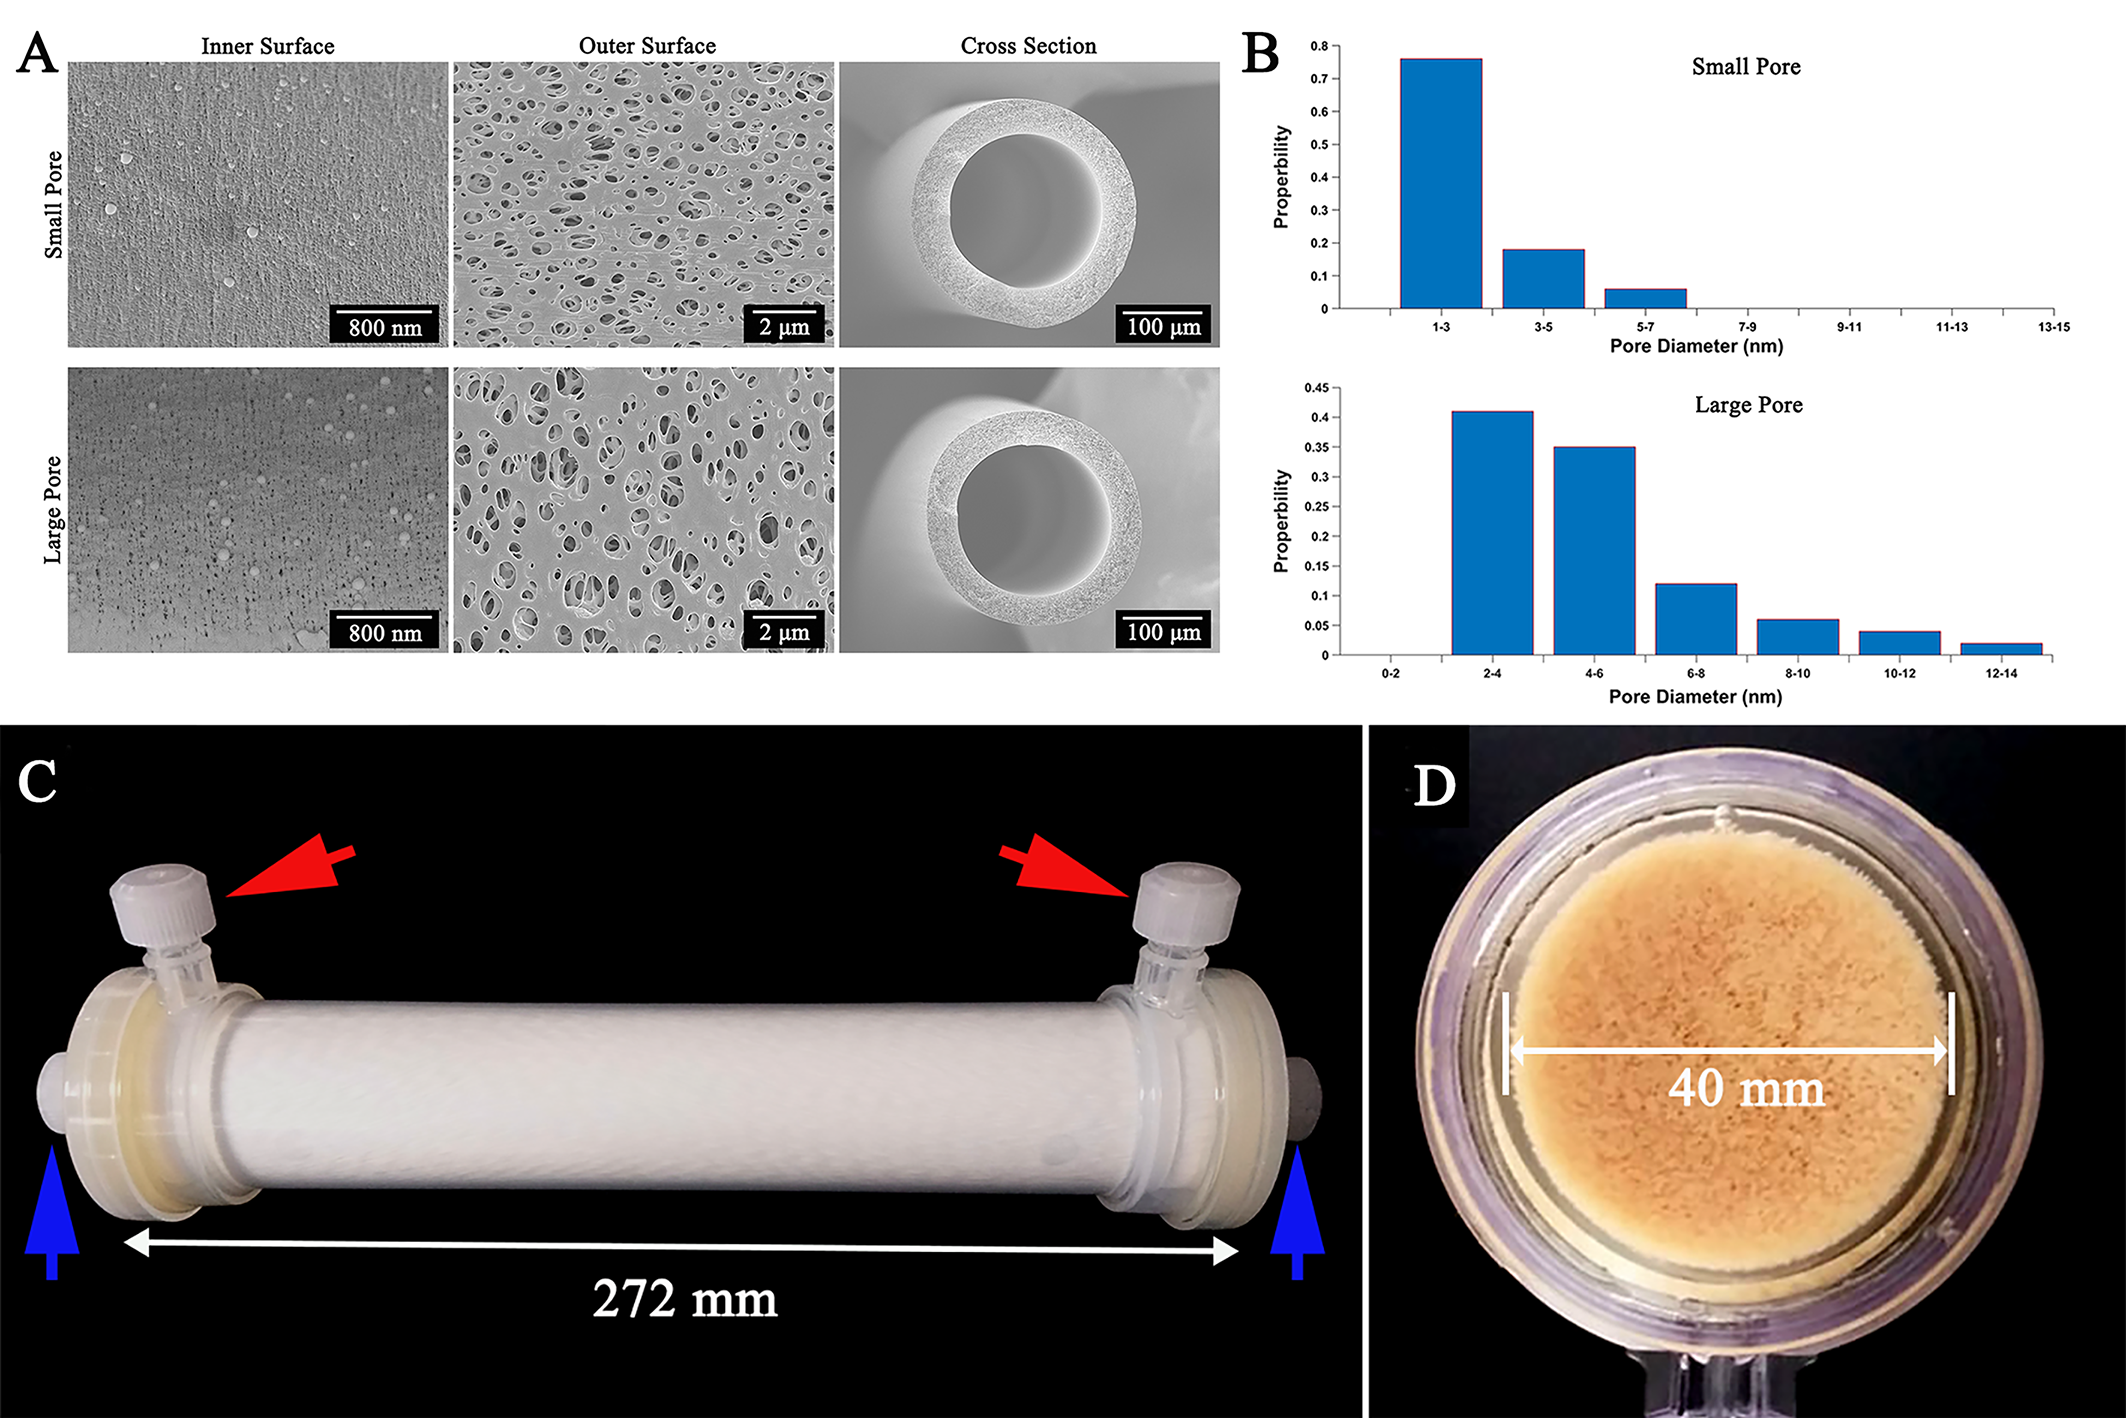
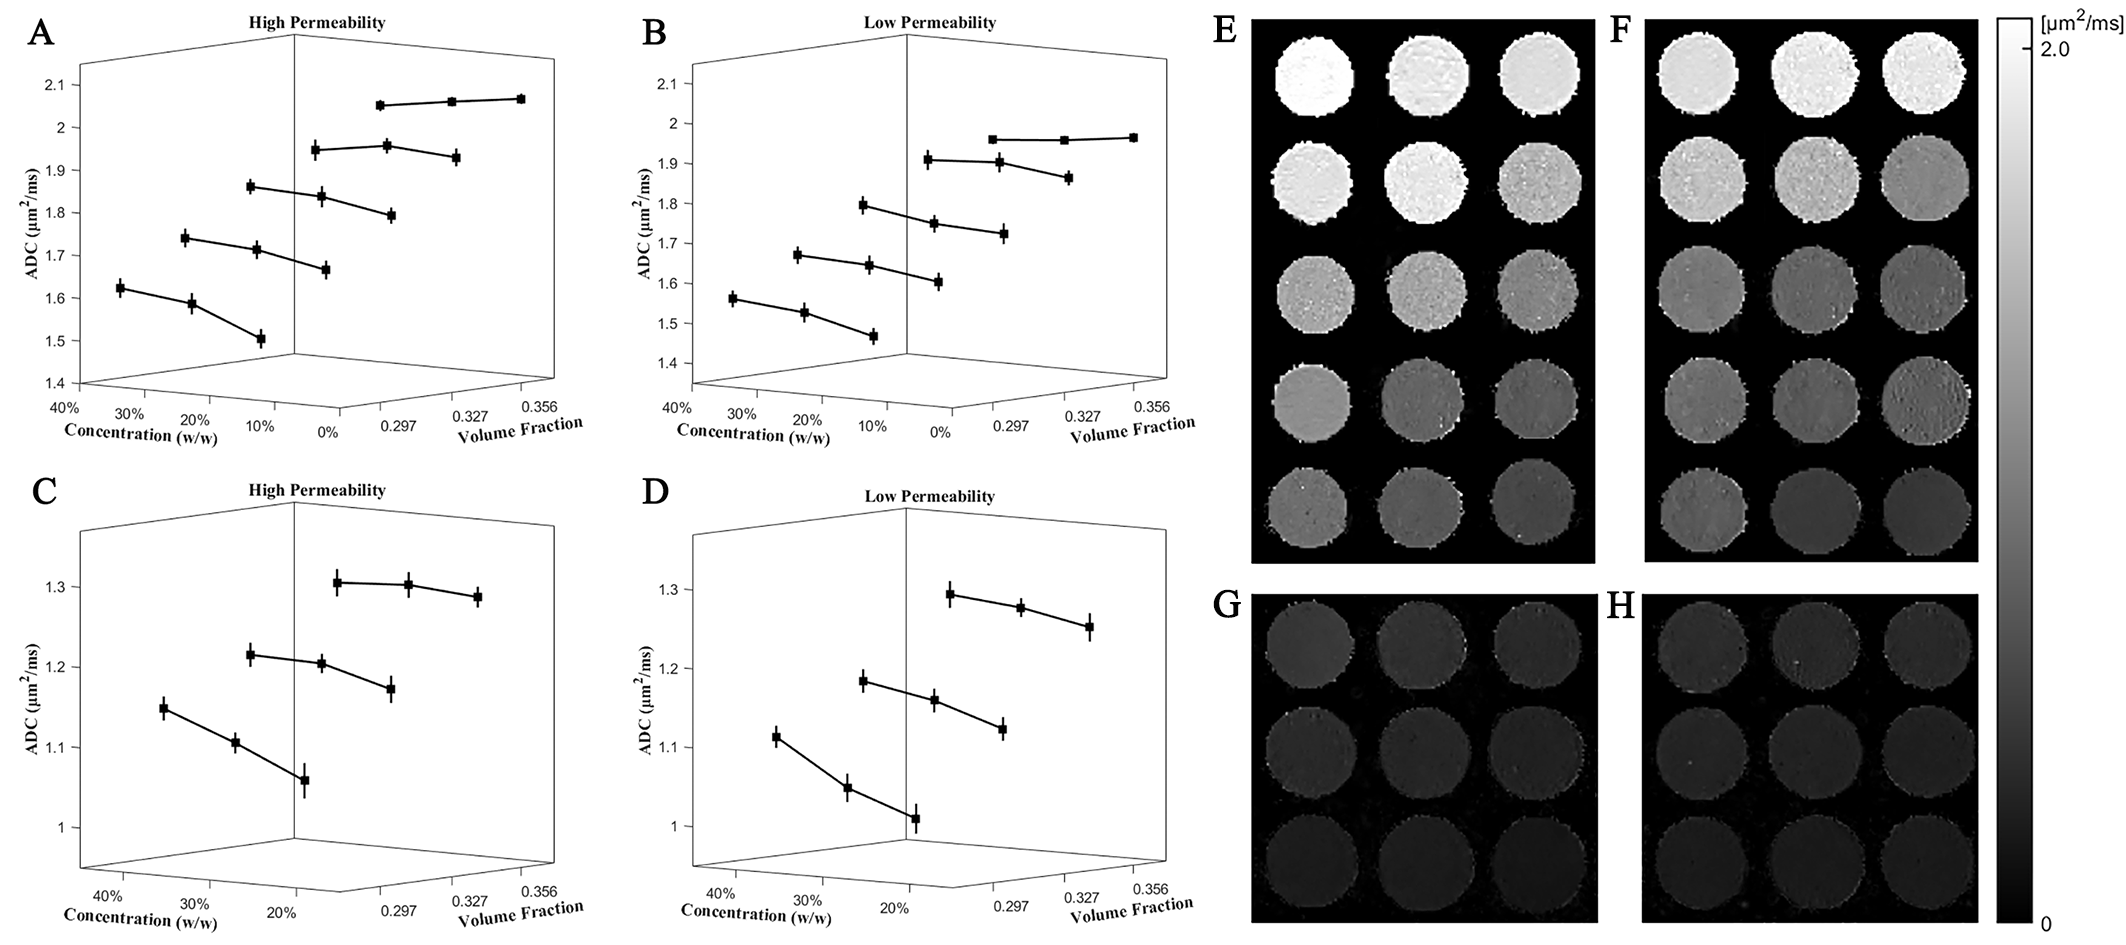
SEM Characterization of PES Fibers: Hollow polyethersulfone (PES) (Bain Medical, Guangzhou, China) fibers form the skeleton of the phantom. The inner surface, outer surface, and cross section of the PES fibers were imaged with a Merlin scanning electron microscope (SEM). To achieve different fiber permeabilities, two kinds of PES fibers with different pore diameters on the inner surface were obtained. Figure 1A shows the representative SEM images of two fibers. Figure 1B shows the pore diameter distribution on the inner surface. The mean pores diameters are approximately 2 and 5 nm. Two fibers have the same inner diameter and wall thickness, the values are 200 ± 10 and 40 ± 7 μm, respectively.Phantom Construction: Each phantom (Figure 1C) consists of three parts: PES fibers, housing (polypropylene, PP), and PVP filling solutions. To obtain different volume fractions of the intra-fiber spaces, three sets of fibers with different packing densities were selected to construct the phantoms. The calculated volume fractions were approximately 0.297, 0.327, and 0.356. PES fibers were inserted into the housing and tightly fixed in the housing using potting layers (Figure 1D). The filling process was performed with PVP (K30 with 58 kg/mol, Macklin, Shanghai, China) aqueous solutions made with distilled water. Five initial PVP solutions with 0%, 10%, 20%, 30%, and 40% (w/w) concentrations were prepared. Two phantom spaces were quickly filled with different PVP solutions. The different diffusivities were achieved by controlling the PVP concentration5. In Figure 2A, blue arrows point to the “inlet” and “outlet” of the intra-fiber spaces during filling. Red arrows mark similar locations for other spaces. We filled 48 phantoms. The 0% and 20% solutions respectively filled the inter-fiber spaces. At the 0% solution, five solutions respectively filled the intra-fiber spaces. At the 20% solution, the 20%, 30%, and 40% solutions filled the intra-fiber spaces.
Diffusion Weighted Imaging: DWI scans were performed on a 3T MRI system (BASDA MEDICAL, Shenzhen, China). A twice-refocused spin echo sequence was used for DWI acquisitions. The imaging parameters were as follows: diffusion weighted gradients were applied along three orthogonal gradient axes, axial field of view (FOV) = 180 mm, matrix = 144 × 144, slice thickness = 4 mm, slice separation = 1 mm, read bandwidth = 1500 Hz/pixel, 20 slices, b = 0 and 1000 s/mm2, repetition time (TR) = 2600 ms, echo time (TE) = 90 ms. All phantoms were immediately imaged after filling. The temperatures of the five initial PVP solutions and all phantoms were maintained prior to each scanning and reached the room temperature of approximately 22 ℃.
Results and Discussion
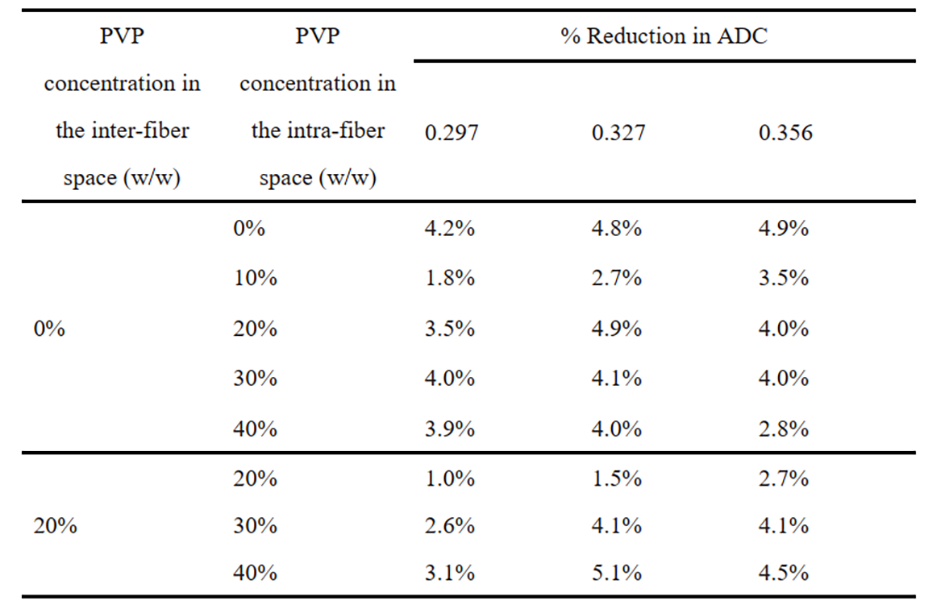
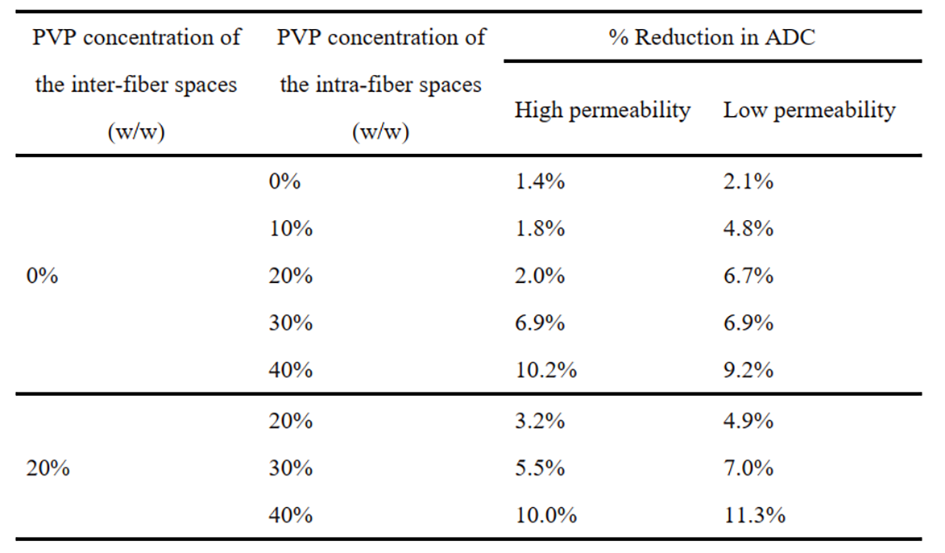
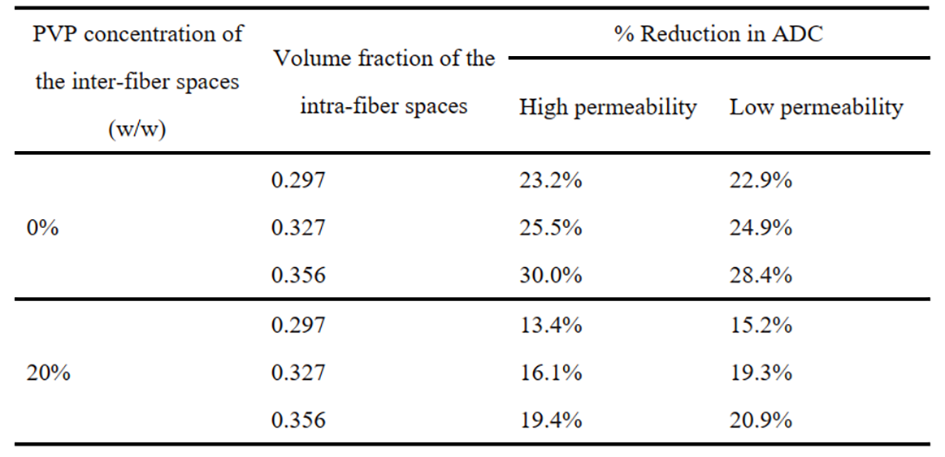
The measured ADC values for five initial solutions are 2.167 ± 0.016, 1.696 ± 0.029, 1.330 ± 0.032, 0.961 ± 0.026 and 0.643 ± 0.019 μm2/ms. These values are near the calculated ADC from the reported calibration curve5, which ensures that the phantom generates the ADC values within the biologically reasonable range6. Figure 2A-D show the ADC values of all phantoms. The ADC values range from 0.986 μm2/ms to 2.097 μm2/ms. The ADC value is small when the fiber permeability is low. Furthermore, the ADC decreases with the increase in volume fraction and PVP concentration of the intra-fiber spaces. Figure 2E-H show the representative parametric maps of the measured ADC values in Figure 2A-D. We further discuss the percentage decrease in ADC. The percentage decreases respectively were up to 5.1% (Table 1), 11.3% (Table 2), and 30.0% (Table 3) with the decreased fiber permeability (from 5 nm to 2 nm), increased volume fraction of the intra-fiber spaces (from 0.297 to 0.356), and increased PVP concentration of the intra-fiber spaces (up to 40% (w/w)). Clearly, the effect of the volume fraction of the intra-fiber spaces on the ADC measurement depends on the PVP concentration of the intra-fiber spaces, and vice versa. For instance, at the 30% (w/w) concentration of the intra-fiber spaces, the reduction in ADC caused by increase in the volume fraction of the intra-fiber spaces from 0.297 to 0.356 is less than 7%. However, at the 40% (w/w) concentration of the intra-fiber spaces, the reduction in ADC is up to 11.3% (Table 2).Conclusion
In this study, we presented a series of phantoms with adjustable parameters to quantitatively evaluate the effects of various cellular properties in tissue on the ADC measurements. This new phantom design provides a potential method for further understanding the biophysical mechanisms underlying the change in ADC.Acknowledgements
National Natural Science Foundation of China (grant number 61929101,61671229), National Key Research and Development Program of China (No. 2016YFC0100800, 2016YFC0100801), Science and Technology Program of Guangzhou, China (No. 201704020091), Science and Technology Program of Guangdong, China (No. 2017B020229004).References
1. Harkins KD, Galons JP, Secomb TW, Trouard TP. Assessment of the effects of cellular tissue properties on ADC measurements by numerical simulation of water diffusion. Magn Reson Med. 2009;62(6):1414-1422.
2. Warach S, Gaa J, Siewert B, Wielopolski P, Edelman RR. Acute human stroke studied by whole brain echo planar diffusion‐weighted magnetic resonance imaging. Ann Neurol. 1995;37(2):231-241.
3. Anderson AW, Zhong JH, Petroff OAC, et al. Effects of osmotically driven cell volume changes on diffusion‐weighted imaging of the rat optic nerve. Magn Reson Med. 1996;35(2):162-167.
4. Neil JJ, Duong TQ, Ackerman JJH. Evaluation of intracellular diffusion in normal and globally‐ischemic rat brain via 133Cs NMR. Magn Reson Med. 1996;35(3):329-335.
5. Wagner F, Laun FB, Kuder TA, et al. Temperature and concentration calibration of aqueous polyvinylpyrrolidone (PVP) solutions for isotropic diffusion MRI phantoms. PloS one. 2017;12(6):e0179276.
6. Helenius J, Soinne L, Perkiö J, et al. Diffusion-weighted MR imaging in normal human brains in various age groups. AJNR Am J Neuroradiol. 2002;23(2):194-199.
Figures