3409
A closer look at diffusion and fiber ODFs in a ground truth crossing fiber phantom
Steven H. Baete1,2, Patryk Filipiak1,2, Lee Basler3, Anthony Zuccolotto3, Ying-Chia Lin1,2, Dimitris G. Placantonakis4, Timothy Shepherd1,2, Walter Schneider3, and Fernando E. Boada1,2
1Center for Advanced Imaging Innovation and Research (CAI2R), NYU School of Medicine, New York, NY, United States, 2Center for Biomedical Imaging, Dept. of Radiology, NYU School of Medicine, New York, NY, United States, 3Psychology Software Tools, Inc., Pittsburgh, PA, United States, 4Department of Neurosurgery, Perlmutter Cancer Center, Neuroscience Institute, Kimmel Center for Stem Cell Biology, NYU School of Medicine, New York, NY, United States
1Center for Advanced Imaging Innovation and Research (CAI2R), NYU School of Medicine, New York, NY, United States, 2Center for Biomedical Imaging, Dept. of Radiology, NYU School of Medicine, New York, NY, United States, 3Psychology Software Tools, Inc., Pittsburgh, PA, United States, 4Department of Neurosurgery, Perlmutter Cancer Center, Neuroscience Institute, Kimmel Center for Stem Cell Biology, NYU School of Medicine, New York, NY, United States
Synopsis
High quality diffusion acquisitions are routinely used to study brain connectivity. In each voxel complex intra-voxel fiber crossings may be captured in Orientation Distribution Functions (ODFs). Direct comparison of ODFs calculated with different methods challenging due to a lack of ground truth. Here, we compare different q-space sampling schemes and ODF-reconstructions on a clinical 3T scanner for a known ground truth of crossing Taxons (textile water filled tubes). This comparison illustrates difficulties separating fibers crossing at less than 45° and estimating relative fiber bundle densities using conventional fiber peak identification. Use of more advanced methods is thus recommended.
Purpose
Diffusion acquisitions are routinely used to study white matter architecture and brain connectivity $$$\textit{in vivo}$$$ [1,2]. In each voxel the complex intra-voxel fiber crossings are captured in Orientation Distribution Functions (ODFs). ODFs can either be estimated (q-ball ODF, qODF [2]) or calculated directly (diffusion ODF or dODF) using Generalized Q-space Imaging (GQI [3]), Cartesian [4] or Radial DSI [5] from a sufficiently dense sampling of q-space. Using constrained spherical deconvolution (CSD) these ODFs can be transformed to fiber ODFs (fODF) with an estimated Fiber Response Function [6] - the prototypical expected response of a single fiber.A key step for successful tractography of white matter tracts is the correct representation of tract orientations. However, accurate fiber direction estimation is difficult due to the limited angular resolution of the diffusion acquisition and intrinsic ODF peak width [7,8] and most methods fail to detect fibers crossing at angles smaller than 30°-40° [6,7]. Direct comparison of ODFs calculated with different methods is further complicated due to a lack of ground truth. Here, we compare different q-space sampling schemes and ODF-reconstructions on a clinical 3T scanner for a known ground truth of crossing Taxons™ (textile water filled tubes [9]) in an anisotropic diffusion phantom.
Methods
Phantom: The phantom [9] contains several single and crossing Taxon fiber bundles in a single plane (Fig. 1a). The Taxons are square nylon fibers of 75x75$$$\,\mu\mathrm{m}$$$ containing 3578 microtubes with 0.8$$$\,\mu\mathrm{m}$$$ diameter (Fig. 1b). Taxons are glued together to ribbons (1000x75$$$\,\mu\mathrm{m}$$$) which are then stacked to obtain fixtures with single or crossing bundles using a routing machine with 15$$$\,\mu\mathrm{m}$$$ precision. Packing density is altered by introducing solid nylon fibers in the ribbons.Data: Diffusion datasets were collected in a single scan session (MAGNETOM Prisma, Siemens, Erlangen; 20-channel head coil; TE/TR$$$\,=\,74/8000\mathrm{ms}$$$, 2$$$\,\mathrm{mm}$$$ isotropic resolution, FoV$$$\,=\,180\,\mathrm{mm}$$$, 24 slices, PF 5/8) using a spin echo EPI sequence. Three q-space sampling schemes were acquired: HCP (3 shells, $$$b\,=\,1000, 2000, 3000\,\mathrm{s/mm^2}$$$ with 90 directions each distributed over the whole sphere, 20$$$b_0$$$, total 290 q-space samples), DSI (5 shells, half-sphere, $$$b_{max}\,=\,4000\,\mathrm{s/mm^2}$$$,18$$$b_0$$$, total 275 q-space samples) and RDSI (4 shells, $$$b\,=\,250, 1000, 2250, 4000\,\mathrm{s/mm^2}$$$, with 59 directions on each shell, identical for all shells, 16$$$b_0$$$, total 252 q-space samples). Images were denoised [10], intensity corrected (N4) and corrected for susceptibility, eddy currents and subject motion using FSL $$$\mathrm{eddy}$$$ [11]. ODFs were reconstructed using MrTrix3 (CSD[6]), DSIStudio (QBI[2], DSI[4], GQI[3]; compiled 1/24/20 [3]) and in-house Matlab code (RDSI [5]; https://bitbucket.org/sbaete/rdsi_recon/) as indicated in the flow chart in Fig. 2. For CSD the fiber response function was derived from an ROI containing single Taxons (Fig. 1a). Display with Matlab (Mathworks, Natick, MA).
Results and Discussion
Figure 3 displays ODFs (qODFs, fODFs and dODFs) of crossing Taxons reconstructed from the HCP, DSI and RDSI acquisitions. As expected the deconvoluted fODFs (CSD and multi-shell CSD) are sharper than the qODFs and dODFs. In the qODFs the underlying Taxon directions are hard to identify. On the other hand, in both the fODFs and dODFs, Taxon directions crossing at 90° and 45° are easily identified except in the multi-shell CSD. All reconstructions struggle with Taxons crossing at 30°. These 30° crossings are identified in some of the CSD voxels and the shape of most dODFs hints at multiple fibers. It is however not a given that conventional ODF-maxima fiber direction identification algorithms will correctly identify these fibers. Use of more advanced algorithms such as probabilistic estimation [12] or ODF-Fingerprinting [13], which utilizes all the information stored in the ODF-shape, are thus recommended.When observing the impact of Taxon bundle density (Figure 4) on ODFs, it is evident that the peaks indicating the 45° bundle relate to the bundle density. However, peak amplitudes do not accurately reflect the bundle density with all 45° bundle peaks smaller than the vertical bundle.
Conclusion
Direct comparison of different approaches to sample and interpret diffusion MRI measurements for tractography is hindered by lack of ground truth fiber information. In a phantom containing crossing Taxons, qODFs, fODFs and dODFs can be evaluated and compared. This comparison illustrates difficulties separating fibers crossing at less than 45° and estimating relative fiber bundle densities. Improvements in fiber identification by more advanced algorithms such as ODF-Fingerprinting will aid fiber tracking algorithms in accurately calculating brain connectivity. Future work will focus on a wider range of crossing fiber angles.Acknowledgements
This project is supported in part by the National Institutes of Health (NIH, R01-CA111996, R01-NS082436, and R01-EB028774). Phantom development of the fibers, fixtures, and routing of fiber paths is supported by NIH/NINDS R44-NS103729. This work was performed under the rubric of the Center for Advanced Imaging Innovation and Research (CAI2R, https://www.cai2r.net), a NIBIB Biomedical Technology Resource Center (NIH P41-EB017183).References
[1] Fernandez-Miranda, J.C. (2012). ‘High-definition fiber tractography of the human brain: neuroanatomical validation and neurosurgical applications’, Neurosurgery vol 71 pp 430–453. [2] Tuch, D.S. (2004), ‘Q-ball imaging’, Magn. Reson. Med., vol. 52, pp. 1358-72. [3] Yeh, F.C., 2010. Generalized q-sampling imaging. IEEE Trans Med Imaging 29(9), 1626-35. [4] Wedeen, V.J. (2005), ‘Mapping complex tissue architecture with diffusion spectrum magnetic resonance imaging’, Magn. Reson. Med., vol. 54, pp. 1377–1386. [5] Baete, S. (2016), ‘Radial q-Space Sampling for DSI’, Magn. Reson. Med. vol 76, pp. 769-780. [6] Tournier, J.-D. (2008), ‘Resolving crossing fibers using constrained spherical deconvolution: Validation using diffusion-weighted imaging phantom data’, NeuroImage, vol 42., pp. 617-25. [7] Jeurissen, B. (2013), ‘Investigating the Prevalence of Complex Fiber Configurations in White Matter Tissue with Diffusion Magnetic Resonance Imaging’, Human Brain Mapping, vol. 34, pp. 2747-66. [8] Barnett, A. (2009), ‘Theory of Q-ball Imaging Redux: Implications for Fiber Tracking’, Magn. Reson. Med., vol 62, pp 910-923. [9] Schneider, W. (2019), ‘Taxon anisotropic phantom delivering human scale parametrically controlled diffusion compartments to advance cross laboratory research and calibration’, Proc Intl Soc Mag Reson Med; 2019; Virtual. [10] Veraart, J. (2016), ‘Denoising of diffusion MRI using random matrix theory’, NeuroImage vol 142, pp394-406. [11] Jenkinson, M. (2012), ‘FSL’, NeuroImage, vol 62, pp782–790. [12] Behrens, T.E. (2007), ‘Probabilistic diffusion tractography with multiple fibre orientations: what can we gain?’, NeuroImage, vol 34, pp144-155. [13] Baete, S.H. (2019), ‘Fingerprinting Orientation Distribution Functions in diffusion MRI detects smaller crossing angles’, NeuroImage, vol 198, pp231-241.Figures
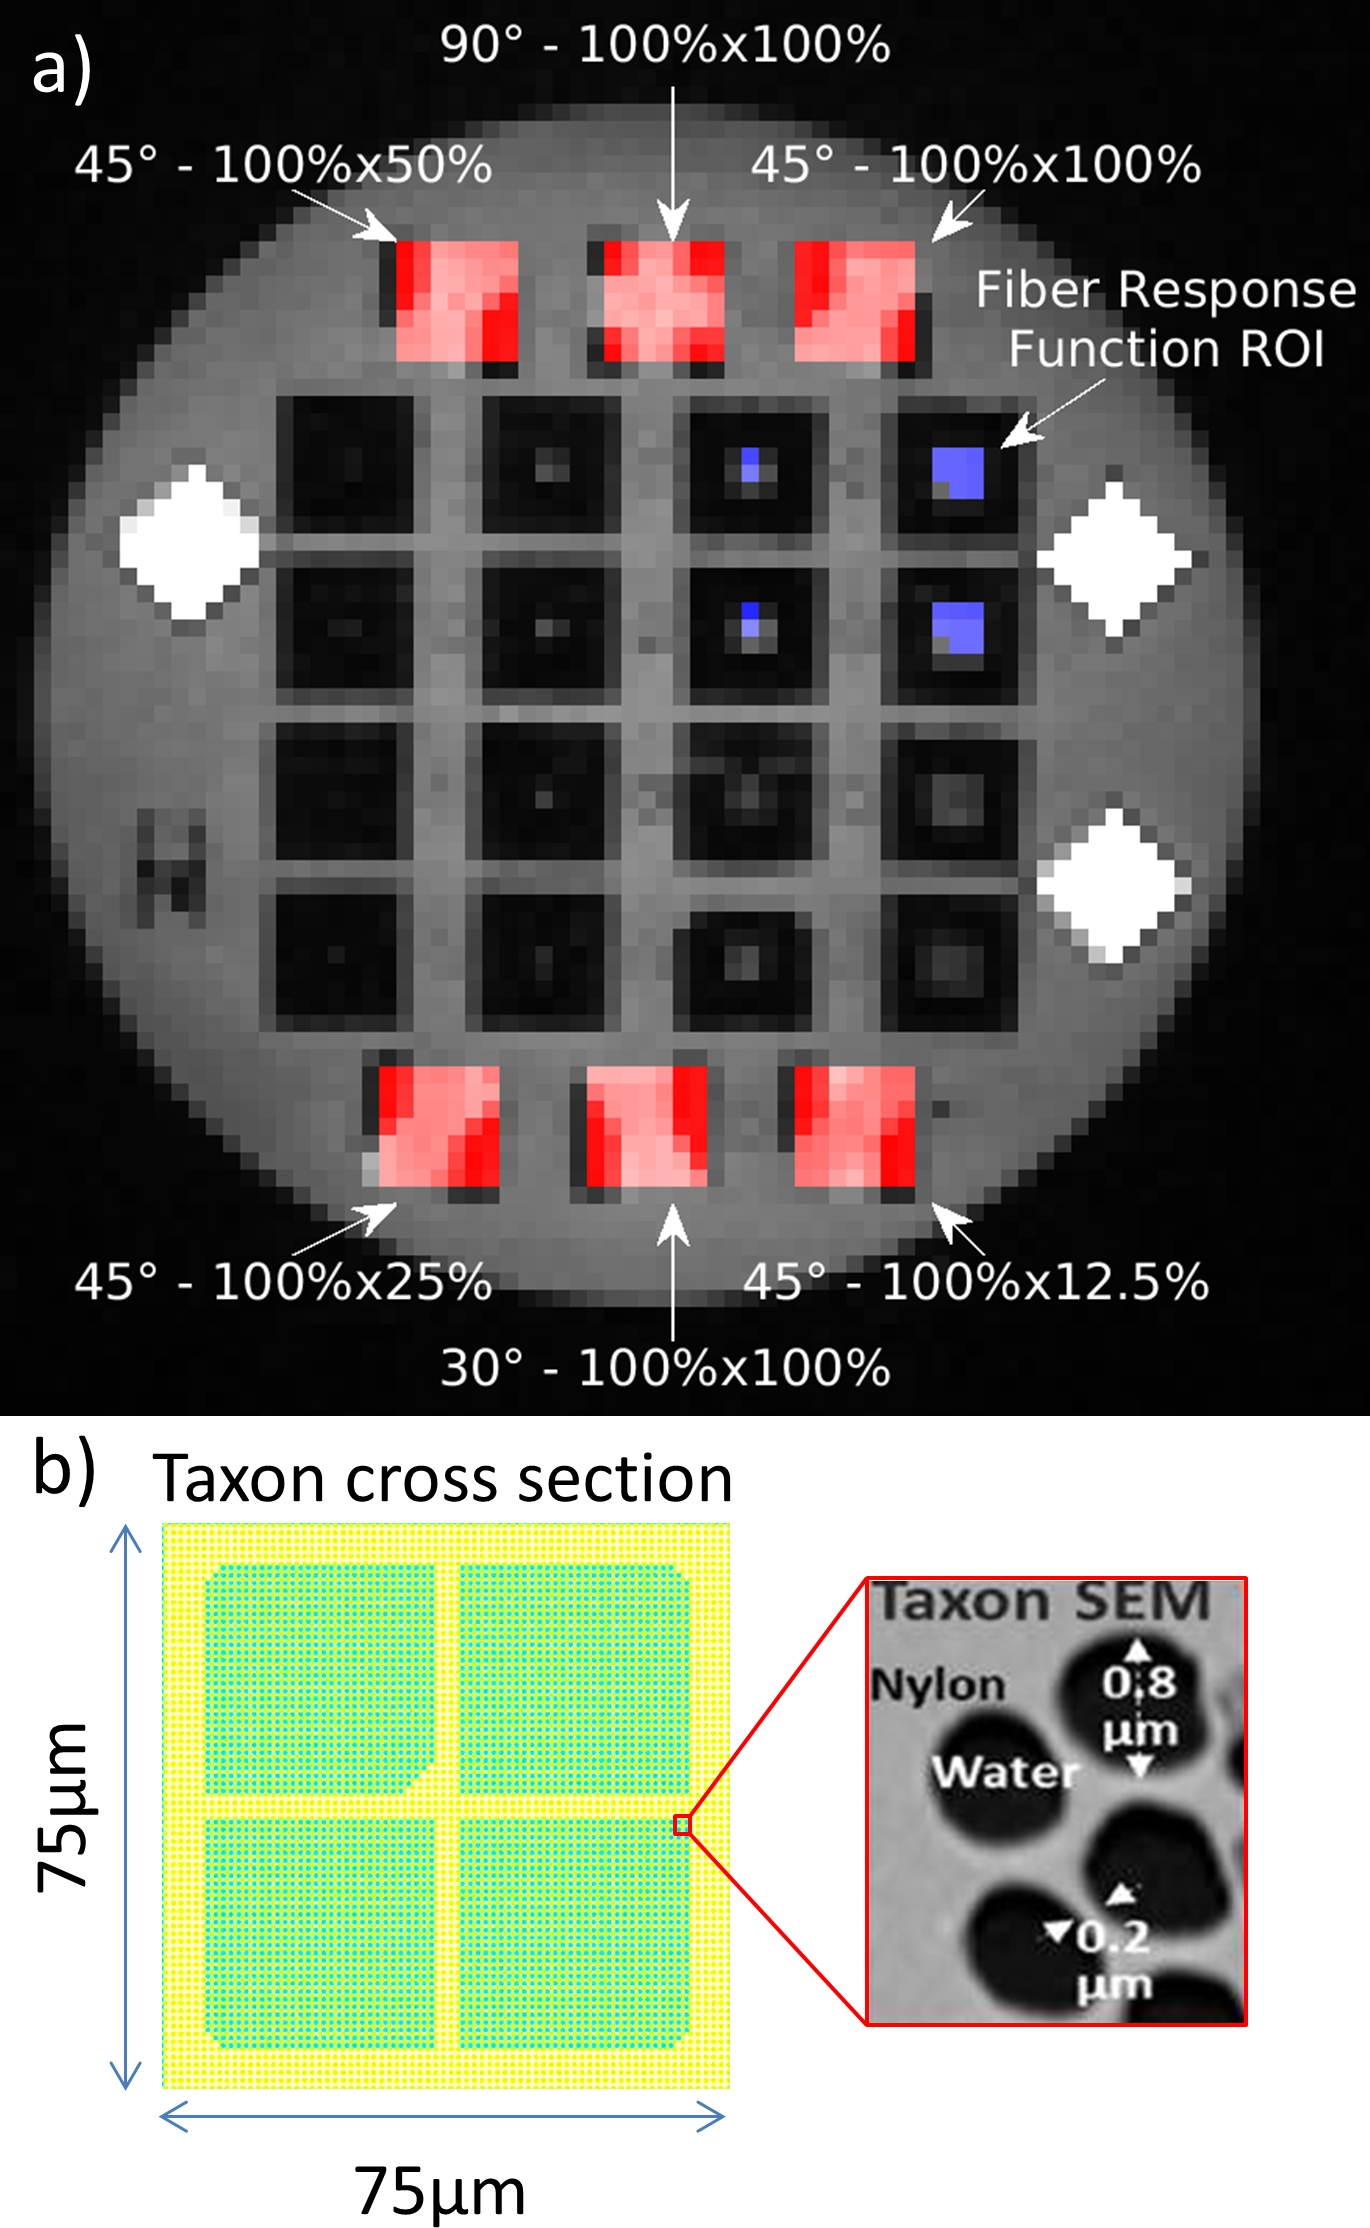
Figure 1: The anisotropic
diffusion phantom contains single and crossing bundles of Taxons™ (textile
water filled tubes [9] with 0.8 10-6 microtubes). a) T1-weighted image of the phantom layout. The ROIs used
in this work are indicated along with crossing fiber angles and taxon
densities. b) Taxon cross section schematic and SEM of Taxon detail.
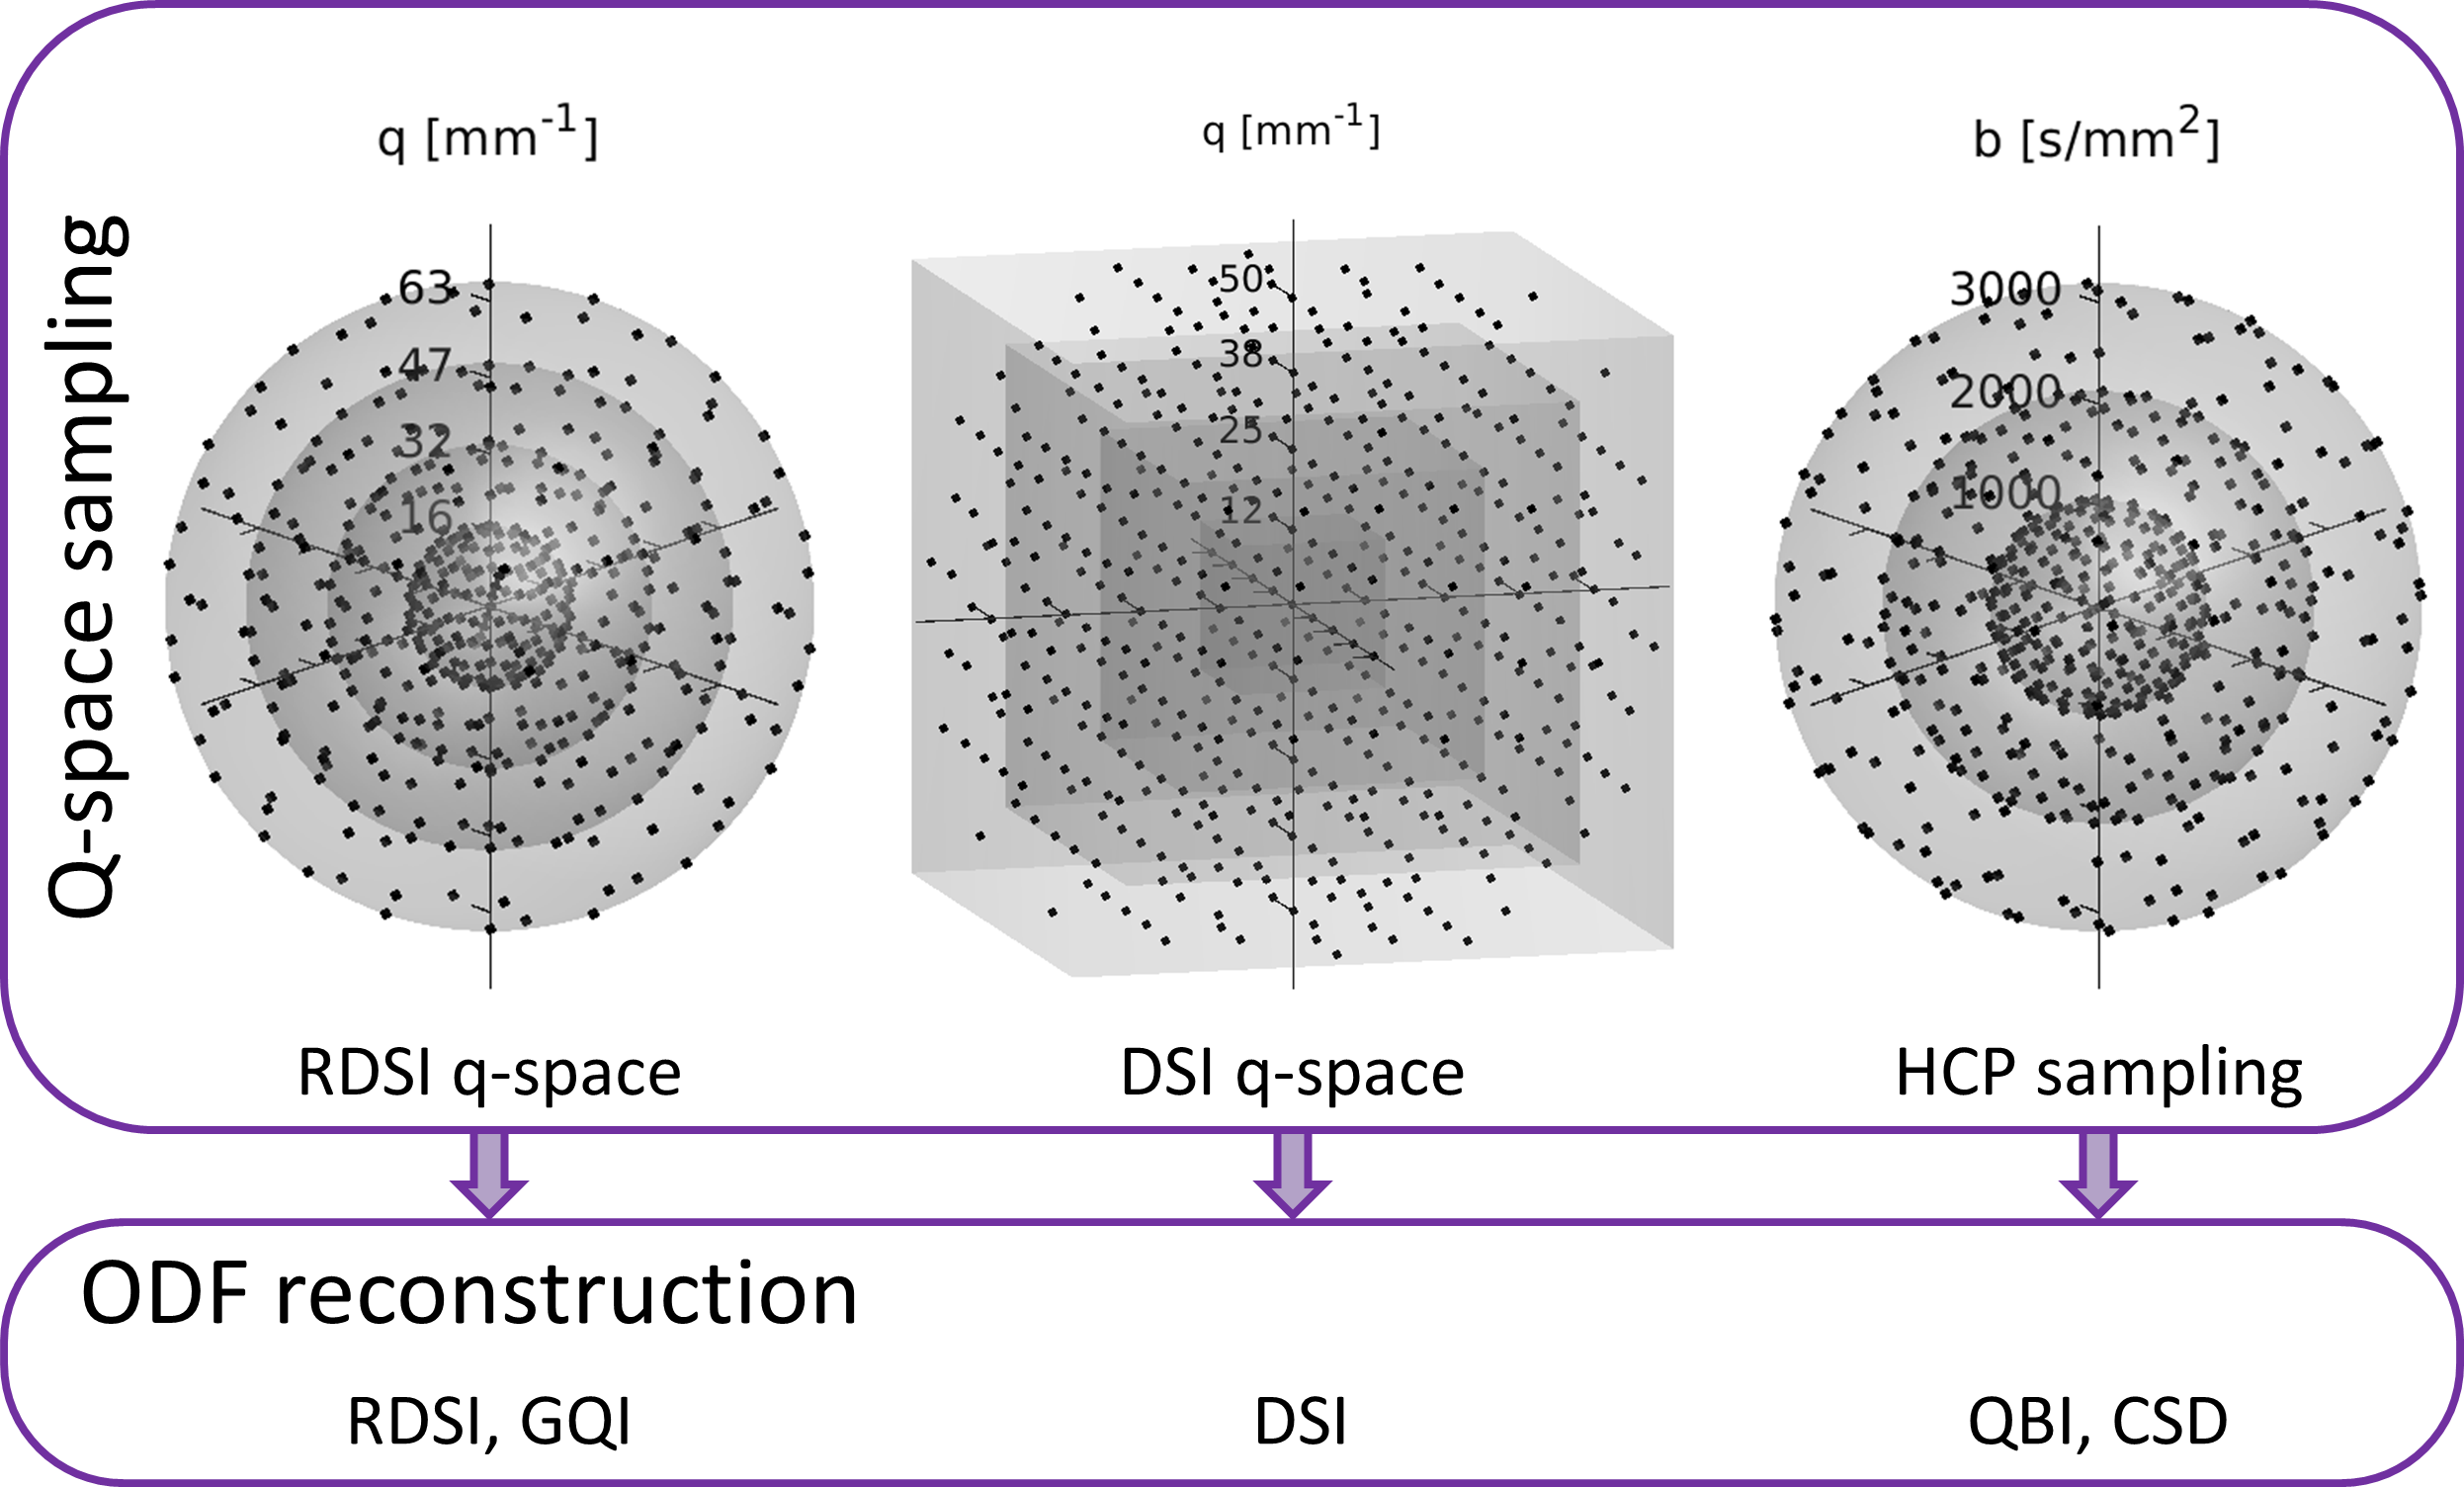
Figure 2: Flow-chart of acquired q-space sampling schemes and applied ODF
reconstructions.
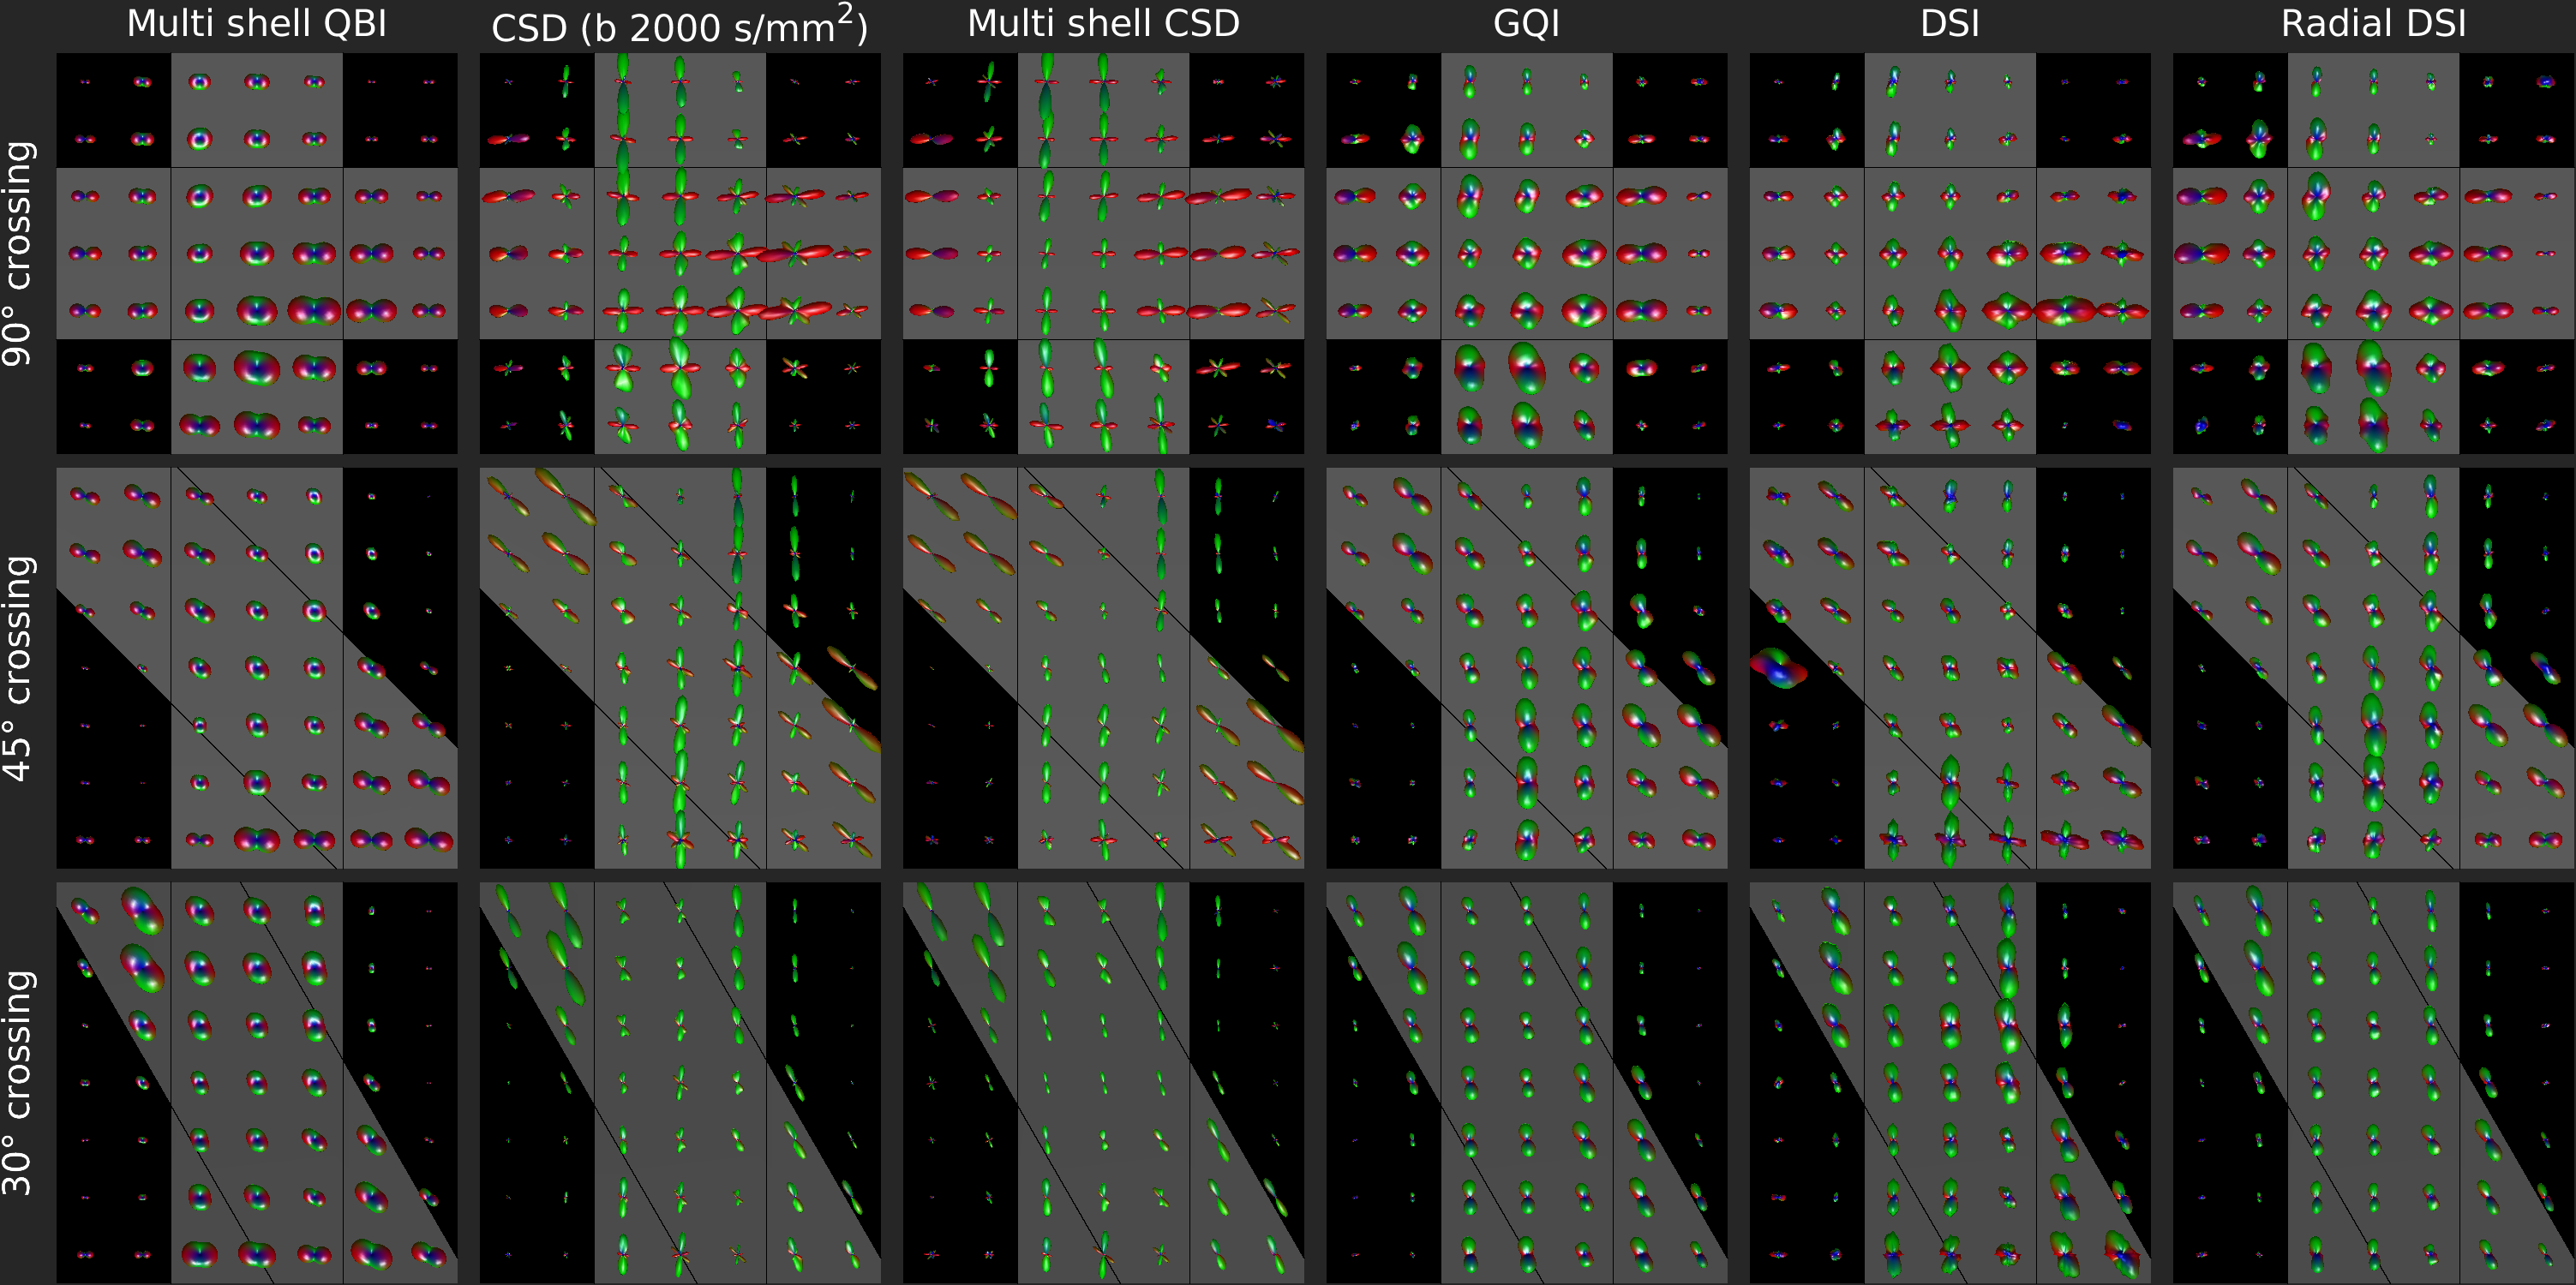
Figure 3:
ODFs in ROIs of Taxon bundles crossing at 90°, 45° and 30° (rows) as
reconstructed by Multi-shell QBI (qODF), CSD (fODF), GQI (dODF), DSI (dODF) and
RDSI (dODF) (columns). Gray bands represent ground truth fiber directions.
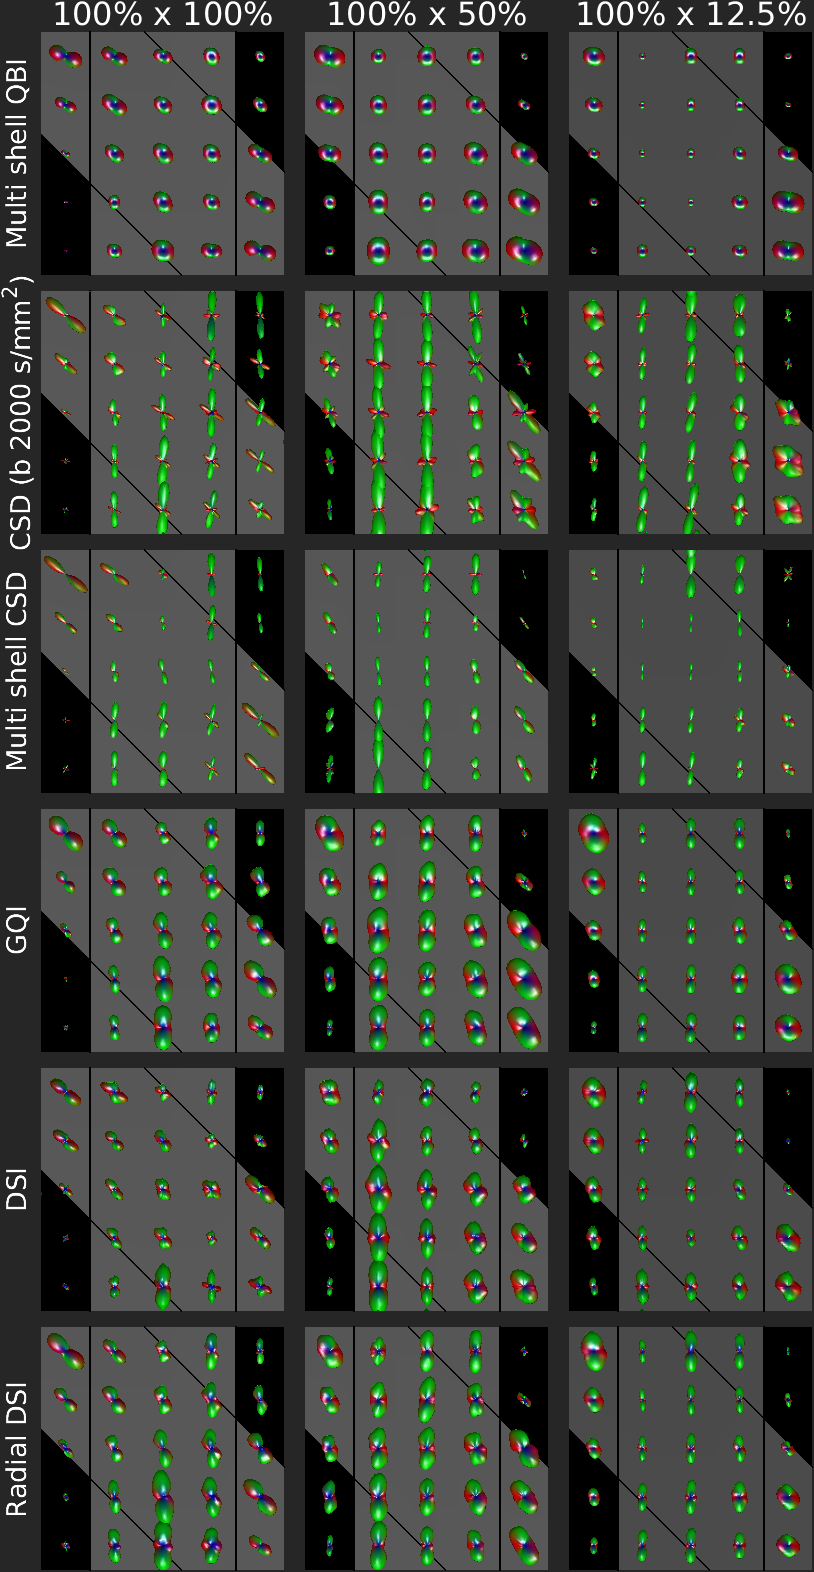
Figure 4: ODFs in ROIs of Taxon bundles crossing
at 45° reconstructed as in Fig. 3. Gray bands represent ground truth Taxon
directions. The density of the vertical fiber is constant (100%) while the
density of the 45° bundle reduces from 100% (left column) to 50% (middle
column) and 12.5% (right column).