3404
Quantifying Cell Size and Membrane Permeability with Microstructure Fingerprinting1Biomedical Engineering, UNC Chapel Hill, Chapel Hill, NC, United States, 2Department of Radiology and Biomedical Research Imaging Center (BRIC), UNC Chapel Hill, Chapel Hill, NC, United States
Synopsis
In diffusion MRI, biophysical models offer a non-invasive means of probing the tissue micro-architecture of the human brain. However, most models rely on closed-form formulas derived with simplifying assumptions such as short gradi- ent pulse, Gaussian phase distribution, and the absence of compartmental ex- change. We present a fast microstructure fingerprinting framework for accurate estimation of axon/soma radii and membrane permeability without relying on these assumptions.
Introduction
Closed-form microstructure models typically rely on simplifying assumptions such as short gradient pulse, Gaussian phase distribution, and the absence of inter-compartmental exchange. Deviations from these assumptions diminish the reliability and interpretability of these models [1]. Microstructure fingerprinting (MF) [2,3] uses simulated signals from accurate and physically interpretable geometries for accurate tissue quantification. However, existing methods [2,3] typically require an inordinate amount of time to generate a sufficiently large dictionary of fingerprints. In this work, we introduce a computationally feasible MF method to (i) quantify cell size and membrane permeability, and (ii) elimi- nate confounding factors, such as extra-axonal water and fiber dispersion, in the estimation of axon/soma radii.Methods
Microstructure fingerprintingThe normalized diffusion signal $$$\frac{S}{S(0)}$$$ can be seen as a combination of signal fingerprints $$$\{\frac{S_i}{S_i(0)}\}_{i}$$$ from multiple microenvironments:
$$\frac{S}{S(0)}=\sum_{i} v[i] \frac{S_i}{S_i(0)}.$$
MF determines the contribution of each fingerprint $$$v[i]$$$ to the voxel signal. We generate a dictionary of realistic fingerprints, covering four diffusion patterns:
- Intra-axonal diffusion using cylinders with radii $$$r$$$’s from 0 to 6 μm and permeabilities $$$\kappa$$$’s from 0 (impermeable) to 50 × 10−6 μm μs−1 [4,5,3,6,7,8,9].
- Extra-axonal diffusion using a tensor model with $$$\frac{\lambda_{\parallel}}{\lambda_{\bot}} < \tau ^2$$$ as in [10].
- Intra-soma diffusion using impermeable spheres with radii from 0 to 20 μm [11].
- Free-water diffusion using a tensor model with $$$\lambda_{\parallel}=\lambda_\perp \gt 1.0 \times 10^{-3}$$$ mm2 s−1 [12].
- SpinDoctor numerically solves the BT-PDE and is typically 50 times faster than Monte Carlo simulations.
- SpinDoctor has been released as a MATLAB toolbox and is widely accessible, allowing the user to customize shape, permeability, pulse sequence, pulse duration, etc. It does not require GPU and can be parallelized.
Tackling estimation bias
The average axon radius for each voxel can be calculated by averaging the radii of the respective fingerprints, weighted by the volume fractions. However, since the volume fractions $$$v$$$ are estimated from the normalized signal model [14], they are actually ‘signal fractions’. Weighted averaging using signal fractions results in a radius estimate called axon radius index [8], which is biased towards axons with larger B0 signals [15]. We correct for this bias by deriving a weight accounting for the B0 signal of each microenvironment:
$$w[i] =\frac{\frac{v[i]}{S_i(0)}}{\sum_{i}\frac{v[i]}{S _i(0)}}.$$
Results
Quantifying volume fractionWe applied our method, MF-SMSI, to synthetic data with known intra-axonal (IA), extra-cellular (EC), intra-soma (IS), and free-water (FW) volume fractions as in [12]. Fig. 2 indicates that our method estimates accurately the volume fraction of each compartment.
Validating unbiased radii and permeability
To investigate the efficacy of our bias correction procedure on the quantification of radius and permeability, we performed three experiments:
- Axonal radius – We simulated signals of two axons with radii 2 and 4 μm and equal volume fractions. In Fig. 3 (left panel), the axon radius is biased toward the larger axon with higher B0 signal, similar to [14]. Our unbiased estimate of the radius is markedly closer to the ground truth.
- Membrane permeability – We simulated signals of two axons with perme- abilities 4 and 6 (×10−6 μmμs−1), common radius 3 μm, and equal volume fraction. In Fig. 3 (middle panel), the biased permeability estimate is biased toward the axon with lower permeability. Our method estimates the correct permeability value matching the ground truth.
- Soma radius – We simulated signals of two somas with radii 4 and 6 μm and equal volume fraction. From Fig. 3 (right panel), the bias toward the soma with higher radius (higher B0) is not severe. Our method yields results closer to the ground truth.
We applied our method on data from the Human Connectome Project (HCP) [16]. Fig. 4 presents the indices for Subject ‘105923’. Indices are in great agreement with previous studies [12,10,11,17] with higher $$$v_{\text{IA}}$$$, MAI, and OCI in deep white matter, high $$$v_{\text{FW}}$$$ in CSF, and higher $$$v_{\text{IS}}$$$ in the cortical ribbon. Axonal radius and permeability are lower in the deep white matter, especially at the body of the corpus callosum and the forceps major, where axons are myelinated and densely packed [10]. Axonal radii are slightly lower in the anterior than the posterior part of the brain, similar to [3,4]. The unbiased estimates $$$r_{\text{axon}}^\dagger$$$ and $$$r_{\text{axon}}^\dagger$$$ reveal the correct patterns, avoiding the bias toward axons with higher radius and lower permeability, as can be observed in Fig. 3. The soma radii in the cortical ribbon have a mean value of 11 μm, similar to [11].
Conclusion
We have demonstrated that microstructure fingerprinting provides accurate and unbiased estimates of tissue properties. Our method takes five hours for a one- time precomputation of the fingerprint dictionary for the HCP data. This represents a significant speedup over methods relying on Monte Carlo simulations and therefore improves the practicality of microstructure fingerprinting.Acknowledgements
This work was supported in part by NIH grant NS093842.References
- Nilsson, M., Alerstam, E., Wirestam, R., Sta, F., Brockstedt, S., La ̈tt, J., et al.: Evaluating the accuracy and precision of a two-compartment ka ̈rger model using monte carlo simulations. Journal of Magnetic Resonance 206(1) (2010) 59–67
- Rensonnet, G., Scherrer, B., Girard, G., Jankovski, A., Warfield, S.K., Macq, B., Thiran, J.P., Taquet, M.: Towards microstructure fingerprinting: Estimation of tissue properties from a dictionary of monte carlo diffusion mri simulations. Neu- roImage 184 (2019) 964–980
- Nedjati-Gilani, G.L., Schneider, T., Hall, M.G., Cawley, N., Hill, I., Ciccarelli, O., Drobnjak, I., Wheeler-Kingshott, C.A.G., Alexander, D.C.: Machine learning based compartment models with permeability for white matter microstructure imaging. NeuroImage 150 (2017) 119–135
- Fan, Q., Nummenmaa, A., Witzel, T., Ohringer, N., Tian, Q., Setsompop, K., Klawiter, E.C., Rosen, B.R., Wald, L.L., Huang, S.Y.: Axon diameter index esti- mation independent of fiber orientation distribution using high-gradient diffusion mri. NeuroImage (2020) 117197
- Imae, T., Shinohara, H., Sekino, M., Ueno, S., Ohsaki, H., Mima, K., Ohtomo, K.: Estimation of cell membrane permeability and intracellular diffusion coefficient of human gray matter. Magnetic Resonance in Medical Sciences 8(1) (2009) 1–7
- Veraart, J., Raven, E.P., Edwards, L.J., Weiskopf, N., Jones, D.K.: The variability of mr axon radii estimates in the human brain. (2020)
- Walter, A., Gutknecht, J.: Permeability of small nonelectrolytes through lipid bilayer membranes. The Journal of membrane biology 90(3) (1986) 207–217
- Zhang, H., Hubbard, P.L., Parker, G.J., Alexander, D.C.: Axon diameter mapping in the presence of orientation dispersion with diffusion mri. Neuroimage 56(3) (2011) 1301–1315
- Romascano, D., Barakovic, M., Rafael-Patino, J., Dyrby, T.B., Thiran, J.P., Da- ducci, A.: Activeaxadd: Toward non-parametric and orientationally invariant axon diameter distribution mapping using pgse. Magnetic resonance in medicine (2019)
- Huynh, K.M., Xu, T., Wu, Y., Wang, X., Chen, G., Wu, H., Thung, K., Lin, W., Shen, D., Yap, P.: Probing tissue microarchitecture of the baby brain via spherical mean spectrum imaging. IEEE Transactions on Medical Imaging (2020) 1–1
- Palombo, M., Ianus, A., Guerreri, M., Nunes, D., Alexander, D.C., Shemesh, N., Zhang, H.: Sandi: a compartment-based model for non-invasive apparent soma and neurite imaging by diffusion mri. NeuroImage (2020) 116835
- Huynh, K.M., Wu, Y., Thung, K.H., Ahmad, S., Taylor IV, H.P., Shen, D., Yap, P.T.: Characterizing intra-soma diffusion with spherical mean spectrum imaging. In: International Conference on Medical Image Computing and Computer-Assisted Intervention, Springer (2020) 354–363
- Li, J.R., Nguyen, V.D., Tran, T.N., Valdman, J., Trang, C.B., Van Nguyen, K., Vu, D.T.S., Tran, H.A., Tran, H.T.A., Nguyen, T.M.P.: Spindoctor: a matlab toolbox for diffusion mri simulation. NeuroImage 202 (2019) 116120
- Zhang, H., Schneider, T., Wheeler-Kingshott, C.A., Alexander, D.C.: NODDI: practical in vivo neurite orientation dispersion and density imaging of the human brain. Neuroimage 61(4) (2012) 1000–1016
- Frigo, M., Fick, R., Zucchelli, M., Deslauriers-Gauthier, S., Deriche, R.: Multi tis- sue modelling of diffusion mri signal reveals volume fraction bias. In: International Symposium on Biomedical Imaging. (2020)
- Van Essen, D.C., Smith, S.M., Barch, D.M., Behrens, T.E., Yacoub, E., Ugurbil, K., Consortium, W.M.H., et al.: The wu-minn human connectome project: an overview. Neuroimage 80 (2013) 62–79
- Kaden, E., Kelm, N.D., Carson, R.P., Does, M.D., Alexander, D.C.: Multi- compartment microscopic diffusion imaging. NeuroImage 139 (2016) 346–359
Figures
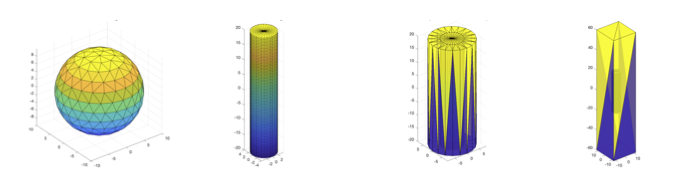
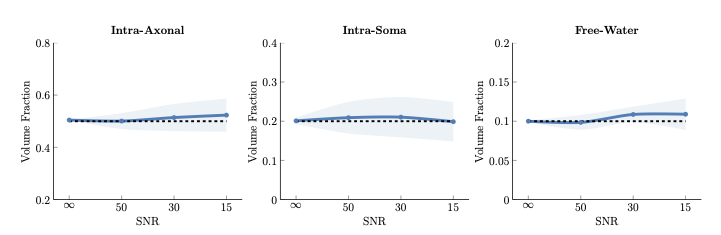
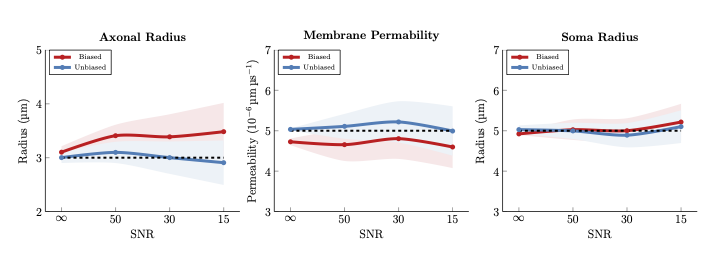
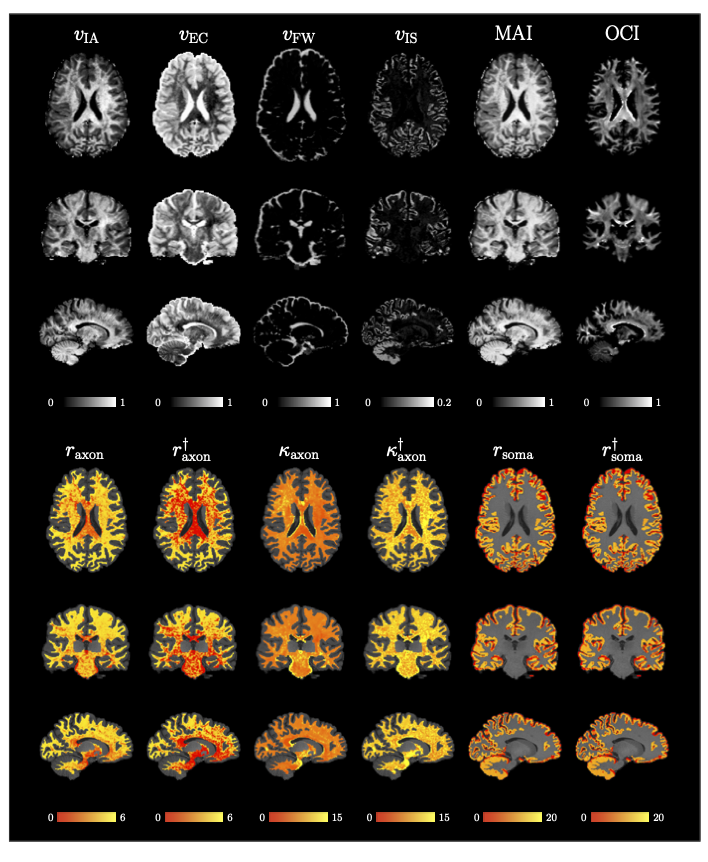
Fig. 4. MF-SMSI Indices. $$$v_{\text{IA}}$$$, $$$v_{\text{EC}}$$$, $$$v_{\text{FW}}$$$, $$$v_{\text{IS}}$$$, MAI, OCI, axonal radius $$$r_{\text{axon}}$$$ (μm), unbiased axonal radius $$$r_{\text{axon}}^\dagger$$$ (μm), axonaxonal permeability $$$\kappa_{\text{axon}}$$$ (10−6 μm μs−1), unbiased membrane permeability $$$\kappa_{\text{axon}}^\dagger$$$ (10−6 μm μs−1), soma radius $$$r_{\text{soma}}$$$ (μm), and unbiased soma radius $$$r_{\text{soma}}^\dagger$$$ (μm). Radius and permeability maps are overlaid on the T1w image.