3402
Characterizing time-dependent diffusion in the extra-axonal space of white matter for axon loss and demyelination1Radiology, New York University School of Medicine, New York, NY, United States
Synopsis
In this work, we use Monte Carlo simulations to show how time-dependent diffusion, D(t), in the extra-axonal space provides information about the packing geometry of the axons. In particular we relate the correlation-length obtained from simulations to the correlation-length computed from the power spectrum of the axon packings. We also show through Monte Carlo simulations, in geometries of cylinders and realistic substrates, that D(t) can provide information that differentiates between axon loss and demyelination.
Introduction
Time-dependent diffusion $$$D(t)$$$ is determined by the structural-universality-class of the medium, with the dynamical-exponent characterizing the diffusion related to the structural-exponent of the power-spectrum $$$\Gamma(k)$$$1,2. The power-spectrum is the Fourier transform of the density-correlation-function $$$\Gamma(x)$$$ of axonal packing, a key geometric characteristic13. Studies have found evidence of time-dependence in brain white and gray matter2-5,14-16. Using Monte Carlo (MC) simulations, $$$D(t)$$$ parallel to axons has shown sensitivity to axon caliber variation and beading6,7.For the extra-axonal space (EAS), $$$D(t)$$$ transverse to the axons has the form3
$$D(t)=D_\infty+A\frac{\ln (t/t_c)}{t},\ \ t_c \ll t,\qquad (1)$$
where $$$A$$$ is proportional to $$$\Gamma(k)|_{k\rightarrow 0}$$$, and $$$t_c$$$ is the time to diffuse across the packing correlation-length $$$l_c$$$. $$$l_c$$$ is the key microstructural length scale that quantifies how ordered is the axonal packing, and is a width of the packing density-correlation-function $$$\Gamma(x)$$$. The frequency version of Equation (1) has been used to explore sensitivity of $$$A$$$ to angular dispersion, beading and demyelination8.
Here, we use MC simulations, in cylinder geometries and realistic substrates obtained from 2D EM, to explore the relation of $$$t_c$$$ obtainable from $$$D(t)$$$ to structural $$$l_c$$$ at different packing densities, and the sensitivity of $$$A$$$, $$$t_c$$$ and $$$D_{\infty}$$$ to axon loss and demyelination, showing the potential of $$$D(t)$$$ to differentiate between these two conditions.
Methods and Results
MC simulation on cylinders were performed using $$$1\times10^{7}$$$ random walkers, $$$D_0=D(t=0)=2$$$ ms/$$$\mu$$$m2, total diffusion time of 250 ms, time step 0.0001 ms. MC simulations on realistic substrates were performed similarly but with a smaller time step $$$4.15\times10^{-6}$$$ ms and total diffusion time of 100 ms. In order to explore the information that could be accessed from $$$D(t)$$$, three simulations were performed:1. Relation between $$$l_c$$$ from $$$\Gamma(k)$$$ (structure) and $$$l_c$$$ from $$$D(t)$$$. Geometries of packed cylinders with densities from 0.4 to 0.8 (EAS from 0.6 to 0.2) were generated using7, cylinder diameters followed similar distribution as the axons in the human corpus-callosum8. To decrease mesoscopic fluctuations, each packing was generated 20 times with different initialization. Because the effects of the shape of the cylinders are mixed with features of interest, we calculated the density-correlation-function in-between centers of cylinders, normalizing those points by the cylinder area. We define $$$l_c$$$ as the width of $$$\Gamma(x)$$$, equivalent to the curvature of $$$\Gamma(k)$$$ at small $$$k$$$, see Figure 1 (b):
$$\Gamma(k)\sim c_0+l_c^2k^2,$$
MC simulations were performed on the EAS of the substrates, and $$$A$$$, $$$t_c$$$ and $$$D_{\infty}$$$ in Equation (1) were estimated from $$$D(t)$$$ perpendicular to the cylinders. $$$l_c$$$ from MC simulations was computed by:
$$l_c=\sqrt{4D_\infty t_c}$$
Figure 1 (c) shows a plot of $$$l_c$$$ from $$$\Gamma(k)$$$ against $$$l_c$$$ from MC indicating the high correlation between them. This points toward the ability of $$$D(t)$$$ to provide information related to the packing geometry of axons.
2. $$$A$$$, $$$t_c$$$ and $$$D_{\infty}$$$ for axon loss and demyelination in geometries with cylinders. One substrate of packed cylinders with density of 0.7 was generated as in Experiment 1. To simulate axon loss, cylinders were randomly removed, with preference for smaller diameters, generating substrates with EAS from 0.3 to 0.6. Assuming an initial g-ratio equal to 0.6, demyelination was simulated by shrinking the outer diameter, generating substrates with g-ratio from 0.6 to 0.8. Figure 2 (a) shows examples of these substrates. $$$D(t)$$$ was obtained through MC simulations and Equation (1) was fit to estimate $$$A$$$, $$$t_c$$$ and $$$D_{\infty}$$$, see Figure 2 (b). Figure 2 (c) shows $$$A$$$, $$$t_c$$$ and $$$D_{\infty}$$$ and tortuosity $$$D_0/D_\infty$$$ for all simulations, indicating that these parameters change qualitatively differently for axon loss and demyelination. $$$A$$$ is more sensitive to axon loss than demyelination, in agreement with8, while $$$t_c$$$ appears to have similar sensitivity, although it was more fluctuating for demyelination. In agreement with previous works11,12, $$$D_{\infty}$$$ and tortuosity showed more sensitivity for demyelination than for axon loss.
3. $$$A$$$, $$$t_c$$$ and $$$D_{\infty}$$$ for axon loss and demyelination in realistic substrates: From a 2D EM photomicrograph, 412 myelinated axons were segmented and labeled. For this substrate EAS is 0.71 and g-ratio is 0.745. Axon loss was simulated by randomly removing axons with preference for smaller area, generating substrates with ECS from 0.71 to 0.55. Demyelination was simulated by shrinking the myelin of the axons through erosion, generating substrates with g-ratio from 0.745 to 0.945. Figure 3 shows results for realistic substrates in a similar fashion as Figure 2. Figure 3 (c) shows $$$A$$$, $$$t_c$$$ and $$$D_{\infty}$$$ and $$$D_0/D_\infty$$$ for all EAS. $$$D_{\infty}$$$ and tortuosity show similar behavior as for simple cylinders, $$$A$$$ shows different trend between axon loss and demyelination, however, for large ECS $$$A$$$ becomes almost flat for both conditions; $$$t_c$$$ showed little difference between axon loss and demyelination. This fluctuation could be due to the limited number of axons.
Discussion and Conclusions
$$$D(t)$$$ can potentially provide information that differentiates between axon loss and demyelination as shown in the MC simulation performed in packed-cylinders and in realistic 2D axonal-substrates. $$$D(t)$$$ can also provide information that correlates to features in the power-spectrum of the media, such as the structural correlation-length. Further investigation will focus on the effect of the shape of the realistic axons on the parameters $$$A$$$, $$$t_c$$$ and $$$D_{\infty}$$$.Acknowledgements
Research was supported by the National Institute of Neurological Disorders and Stroke of the NIH under awards R01 NS088040 and R21 NS081230, and by the Hirschl foundation, and was performed at the Center of Advanced Imaging Innovation and Research (CAI2R, www.cai2r.net), a Biomedical Technology Resource Center supported by NIBIB with the award P41 EB017183.References
1. Dmitry S Novikov, Valerij G Kiselev. Effective medium theory of a diffusion-weighted signal. NMR Biomed. 2010;23(7):682-97.
2. Dmitry S Novikov, Jens H Jensen, Joseph A Helpern, Els Fieremans. Revealing mesoscopic structural universality with diffusion. Proc Natl Acad Sci USA. 2014;111(14):5088-93.
3. Lauren M Burcaw, Els Fieremans, Dmitry S Novikov. Mesoscopic structure of neuronal tracts from time-dependent diffusion. Neuroimage. 2015;114:18-37.
4. Els Fieremans, Lauren M Burcaw, Hong-Hsi Lee, Gregory Lemberskiy, Jelle Veraart, Dmitry S Novikov. In vivo observation and biophysical interpretation of time-dependent diffusion in human white matter. Neuroimage. 2016;129:414-427.
5. Hong-Hsi Lee, Antonios Papaioannou, Sung-Lyoung Kim, Dmitry S Novikov, Els Fieremans. In vivo observation and biophysical interpretation of time-dependent diffusion in human cortical gray matter. Neuroimage. 2020;222:117054
6. Hong-Hsi Lee, Antonios Papaioannou, Sung-Lyoung Kim, Dmitry S Novikov, Els Fieremans. A time-dependent diffusion MRI signature of axon caliber variations and beading. Commun Biol. 2020;3(1):354.
7. Hong-Hsi Lee, Katarina Yaros, Jelle Veraart, Jasmine L Pathan, Feng-Xia Liang, Sungheon G Kim, Dmitry S Novikov, Els Fieremans. Along-axon diameter variation and axonal orientation dispersion revealed with 3D electron microscopy: implications for quantifying brain white matter microstructure with histology and diffusion MRI. Brain Struct Funct. 2019;224(4):1469-1488.
8. Ginsburger Kévin, Poupon Fabrice, Beaujoin Justine, Estournet Delphine, Matuschke Felix, Mangin Jean-François, Axer Markus, Poupon Cyril. Improving the Realism of White Matter Numerical Phantoms: A Step toward a Better Understanding of the Influence of Structural Disorders in Diffusion MRI. Frontiers in Physics. 2018;6.
9. Aleksandar Donev, SalvatoreTorquato, Frank H.Stillinger. Neighbor list collision-driven molecular dynamics simulation for nonspherical hard particles. I. Algorithmic details. Journal of Computational Physics. 2005;202(2): 737-764
10. F Aboitiz, A B Scheibel, R S Fisher, E Zaidel. Fiber composition of the human corpus callosum. Brain Res. 1992;598(1-2):143-53.
11. E. Fieremans, J. H. Jensen, J. Helpern, S. Kim, R. Grossman, M. Inglese, D. Novikov. Diffusion distinguishes between axonal loss and demyelination in brain white matter. Proc. Intl. Soc. Mag. Reson. Med. 2012.
12. D. S. Novikov, E. Fieremans. Relating extracellular diffusivity to cell size distribution and packing density as applied to white matter. Proc. Intl. Soc. Mag. Reson. Med. 2012
13. Salvatore Torquato, Random Heterogeneous Materials: Microstructure and Macroscopic Properties (Springer Science & Business Media, 2002).
14. MA Horsfield, GJ Barker, WI McDonald. Self-diffusion in CNS tissue by volume-selective proton NMR. Magn Reson Med. 1994;31:637-644.
15. S De Santis, DK Jones, A Roebroeck. Including diffusion time dependence in the extra-axonal space improves in vivo estimates of axonal diameter and density in human white matter. NeuroImage. 2016;130:91-103.
16. CA Baron, C Beaulieu. Oscillating gradient spin-echo (OGSE) diffusion tensor imaging of the human brain. Magn Reson Med. 2014;72:726-736.
Figures
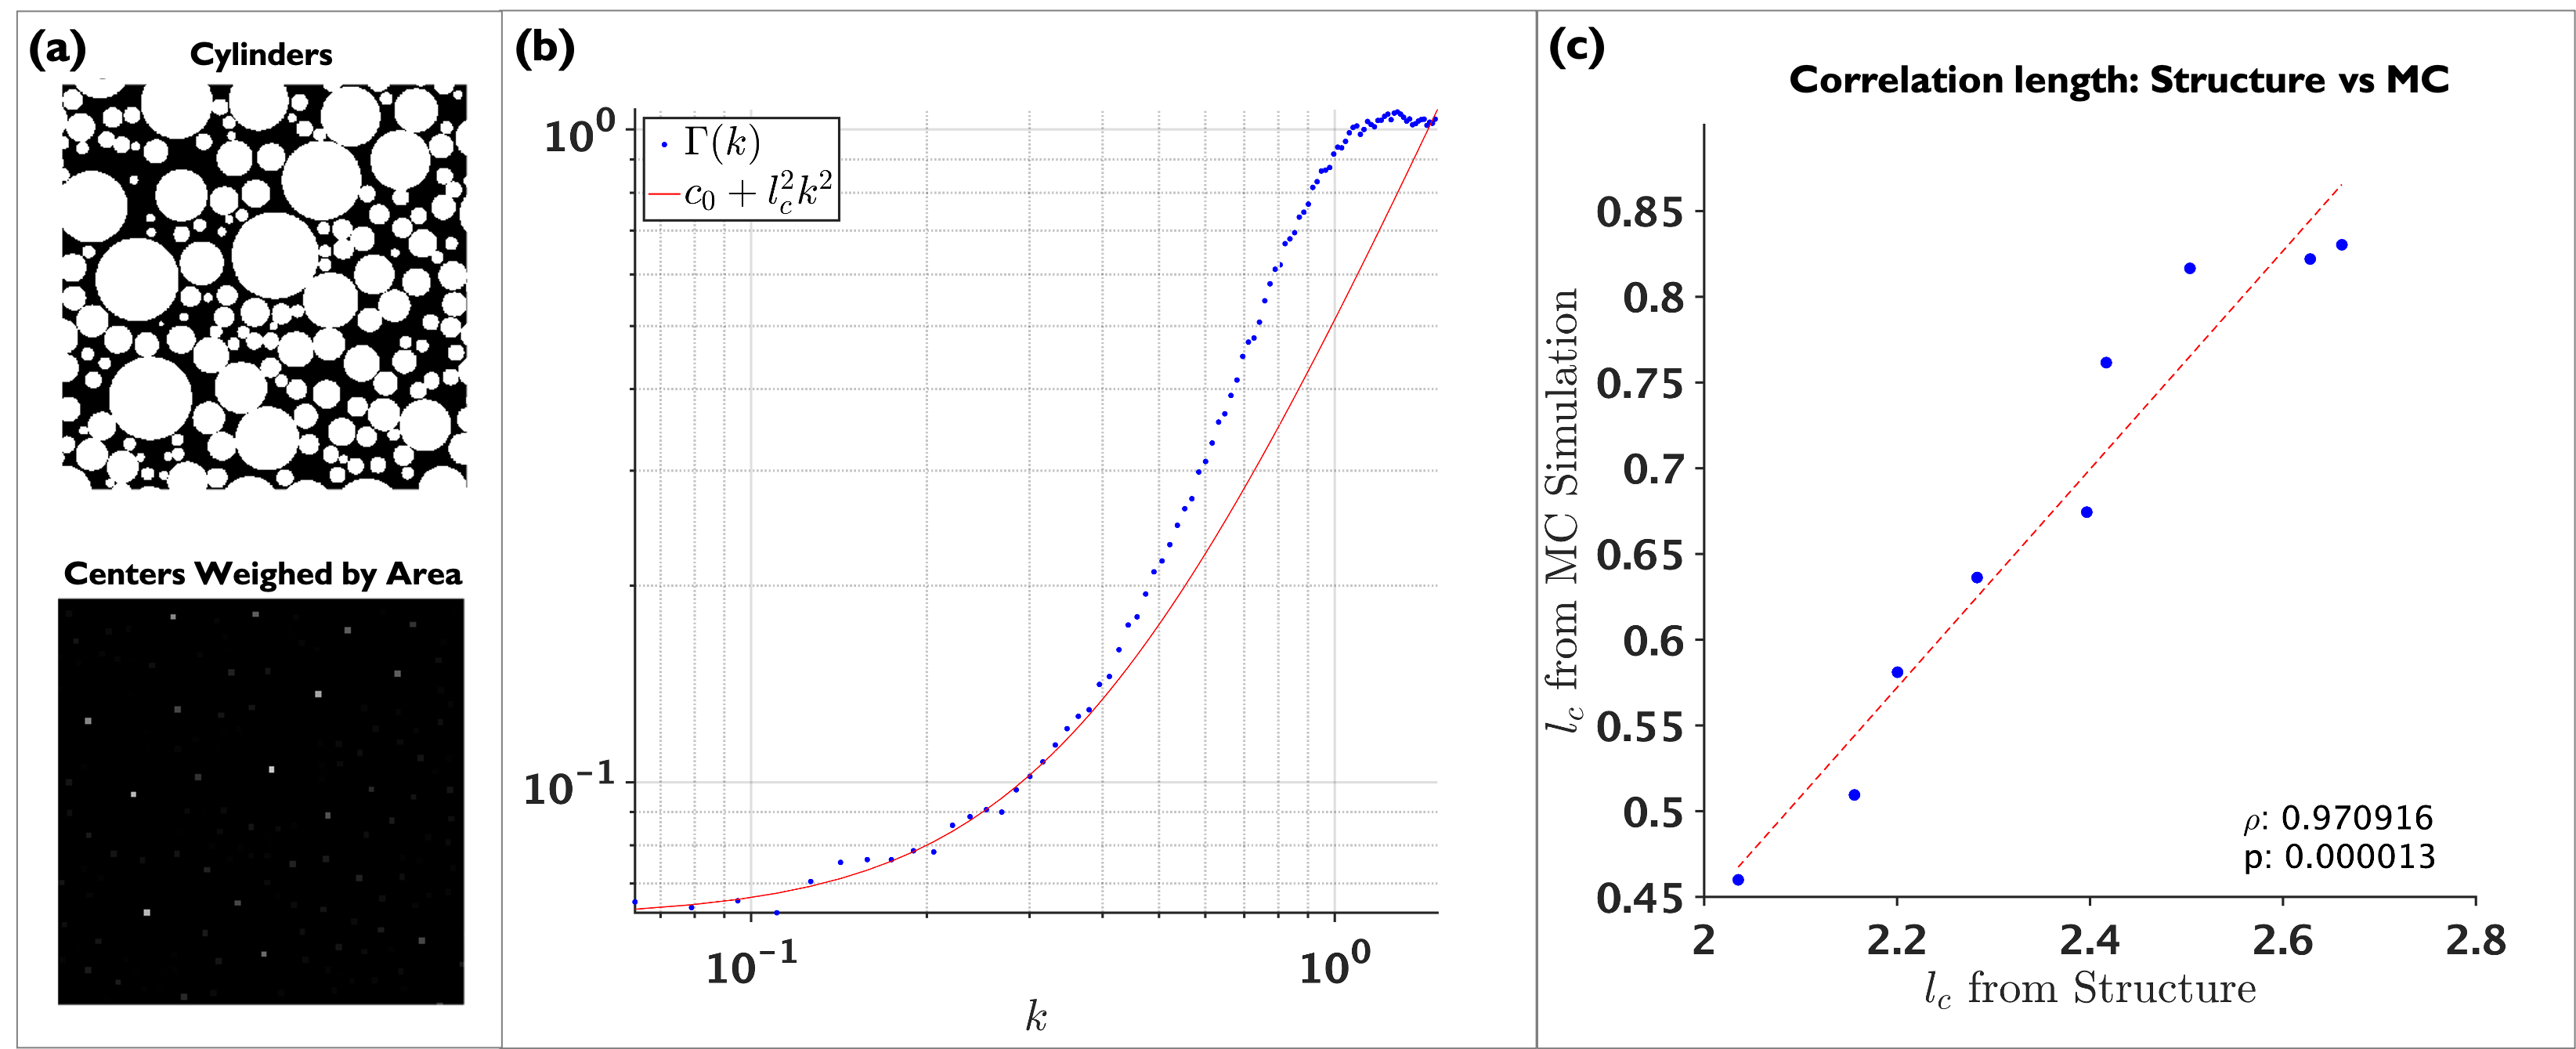
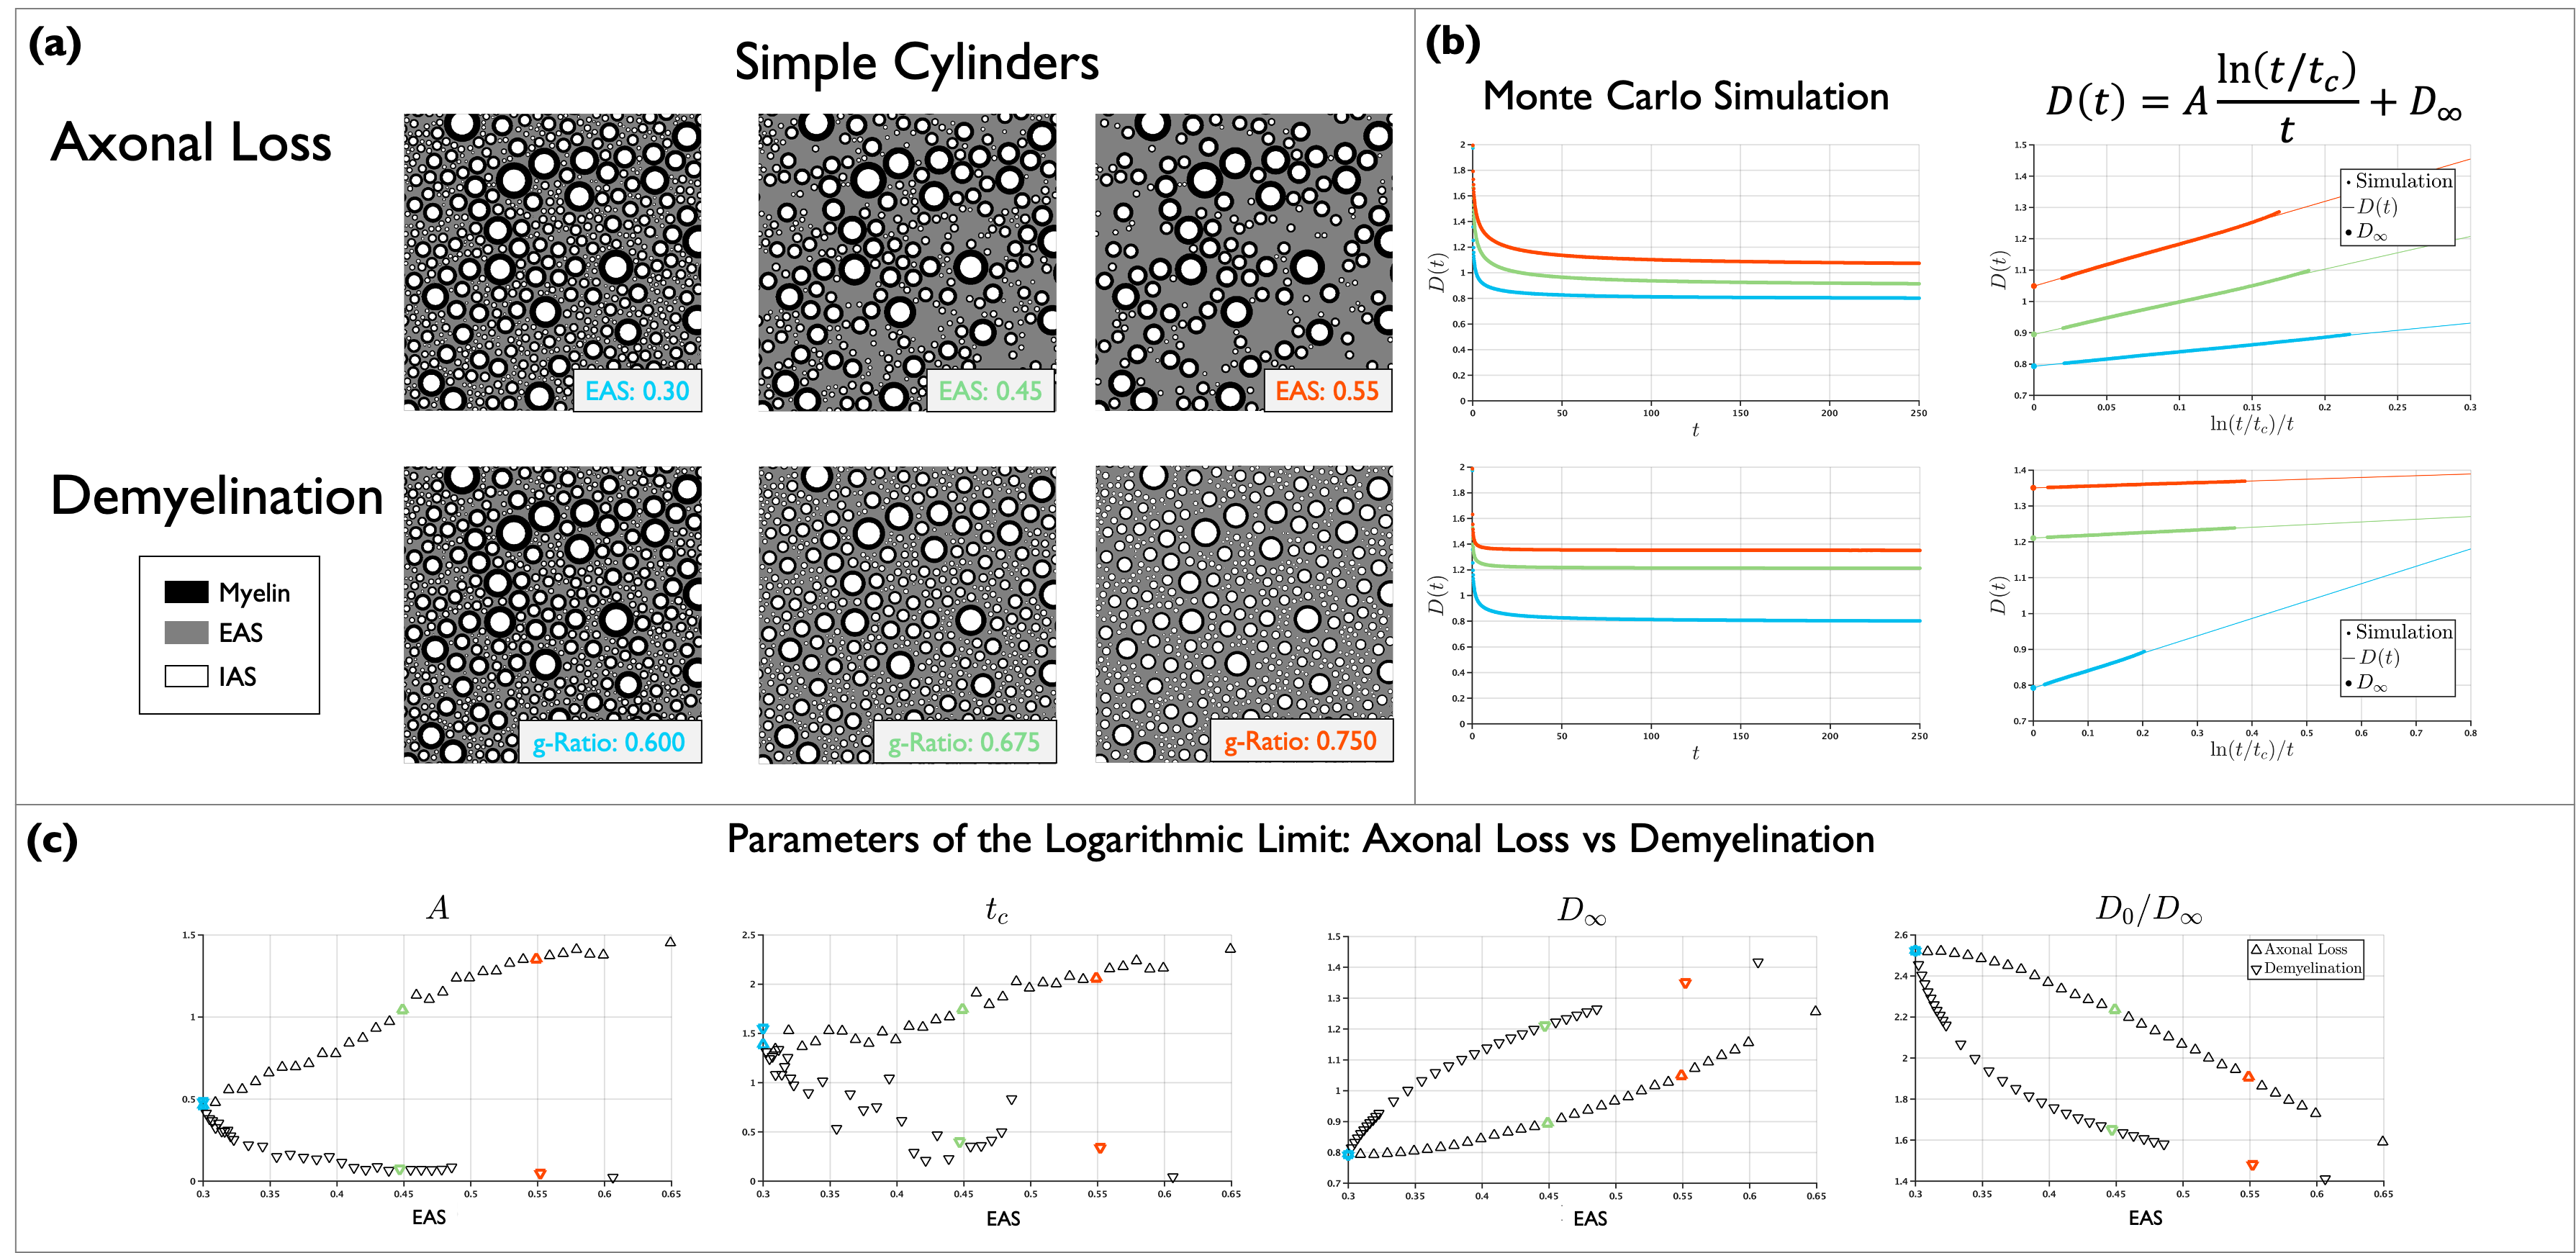
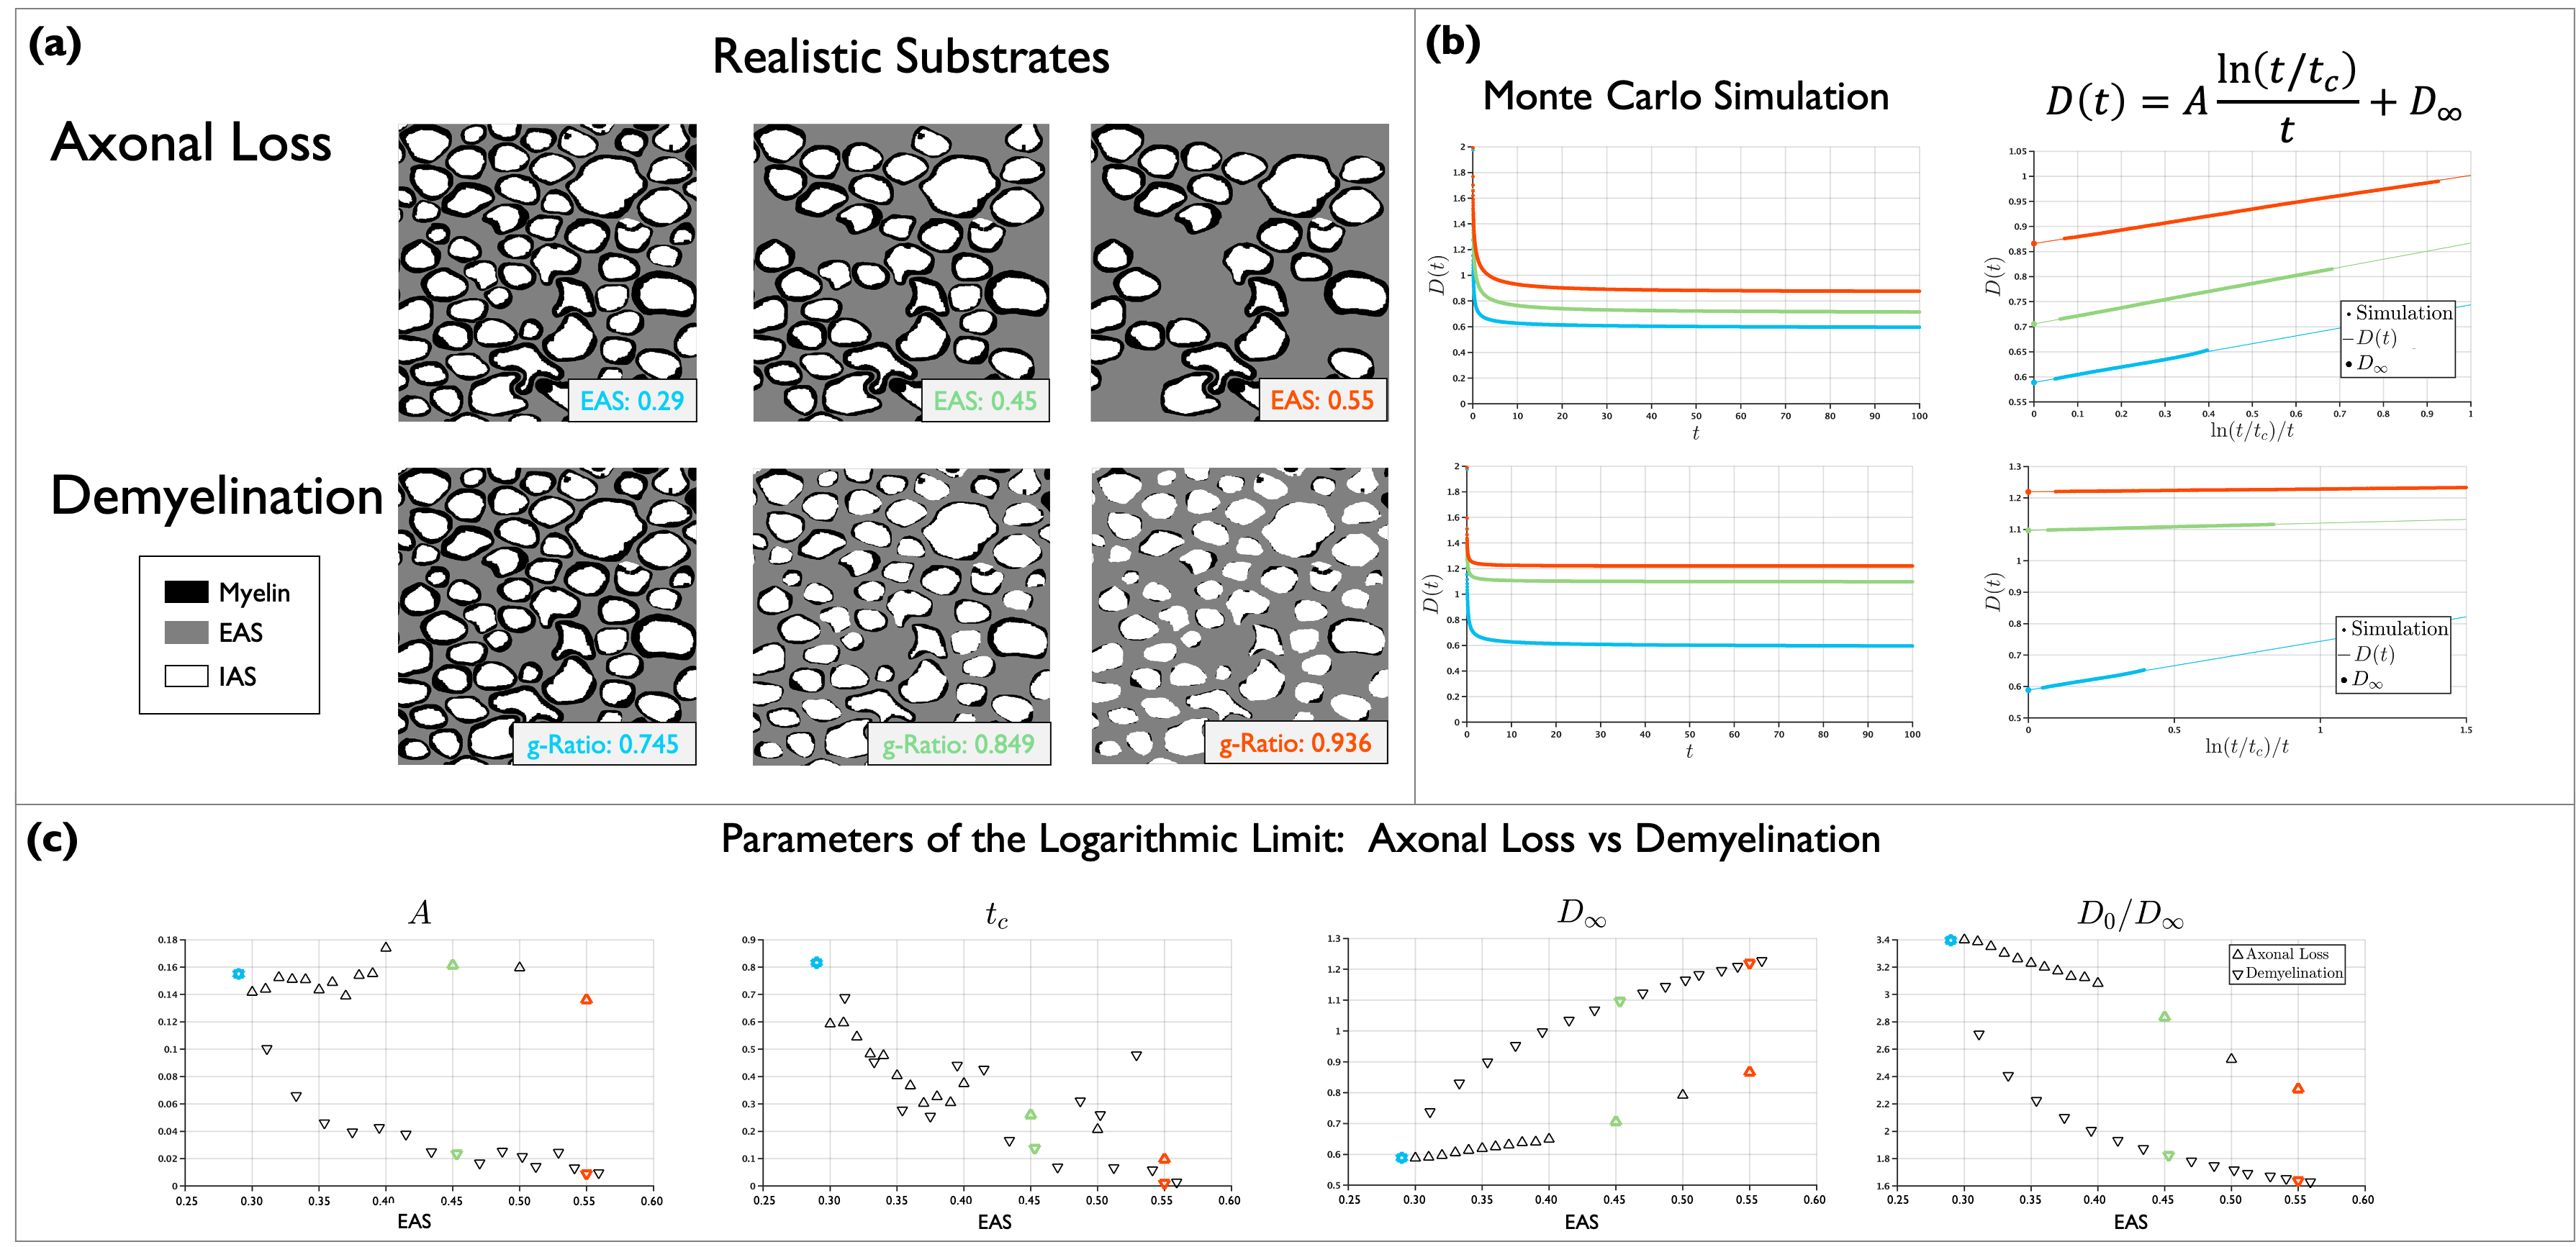
Figure 3. (a) Examples of realistic substrates generated to simulate axon loss and demyelination. Colors label different EAS fractions. (b) D(t) was obtained from MC simulations and Equation (1) was fitted. (c) $$$D_{\infty}$$$, and $$$D_0/D_{\infty}$$$ show similar behavior than for the substrates with cylinders, $$$t_c$$$ is more noisy and shows similar behavior for both conditions, $$$A$$$ differentiates between axon loss and demyelination, but shows a flat-like behavior for larger EAS. The effect of axon shape in $$$D(t)$$$ needs to be further investigated.