3401
Realistic simulations of diffusion MR spectroscopy: The effect of glial cell swelling on non-Gaussian and anomalous diffusion1Cardiff University Brain Research Imaging Centre (CUBRIC), Cardiff University, Cardiff, United Kingdom, 2Departments of Radiology and Biomedical Research, University of Bern, Bern, Switzerland
Synopsis
An existing Monte-Carlo simulation was refined to allow realistic modeling of 150x150x150μm³ tissue samples. The approach was validated on a reference sample, where ground truth is known. The non-Gaussian and anomalous diffusion behavior in diffusion MR spectroscopy experiments was modeled in realistic tissue samples composed of 30 glial cells addressing a hypothesized cell swelling evoked by glial activation. The simulated results agree well with in vivo literature values and may help to improve the linkage between diffusion and histology.
Introduction
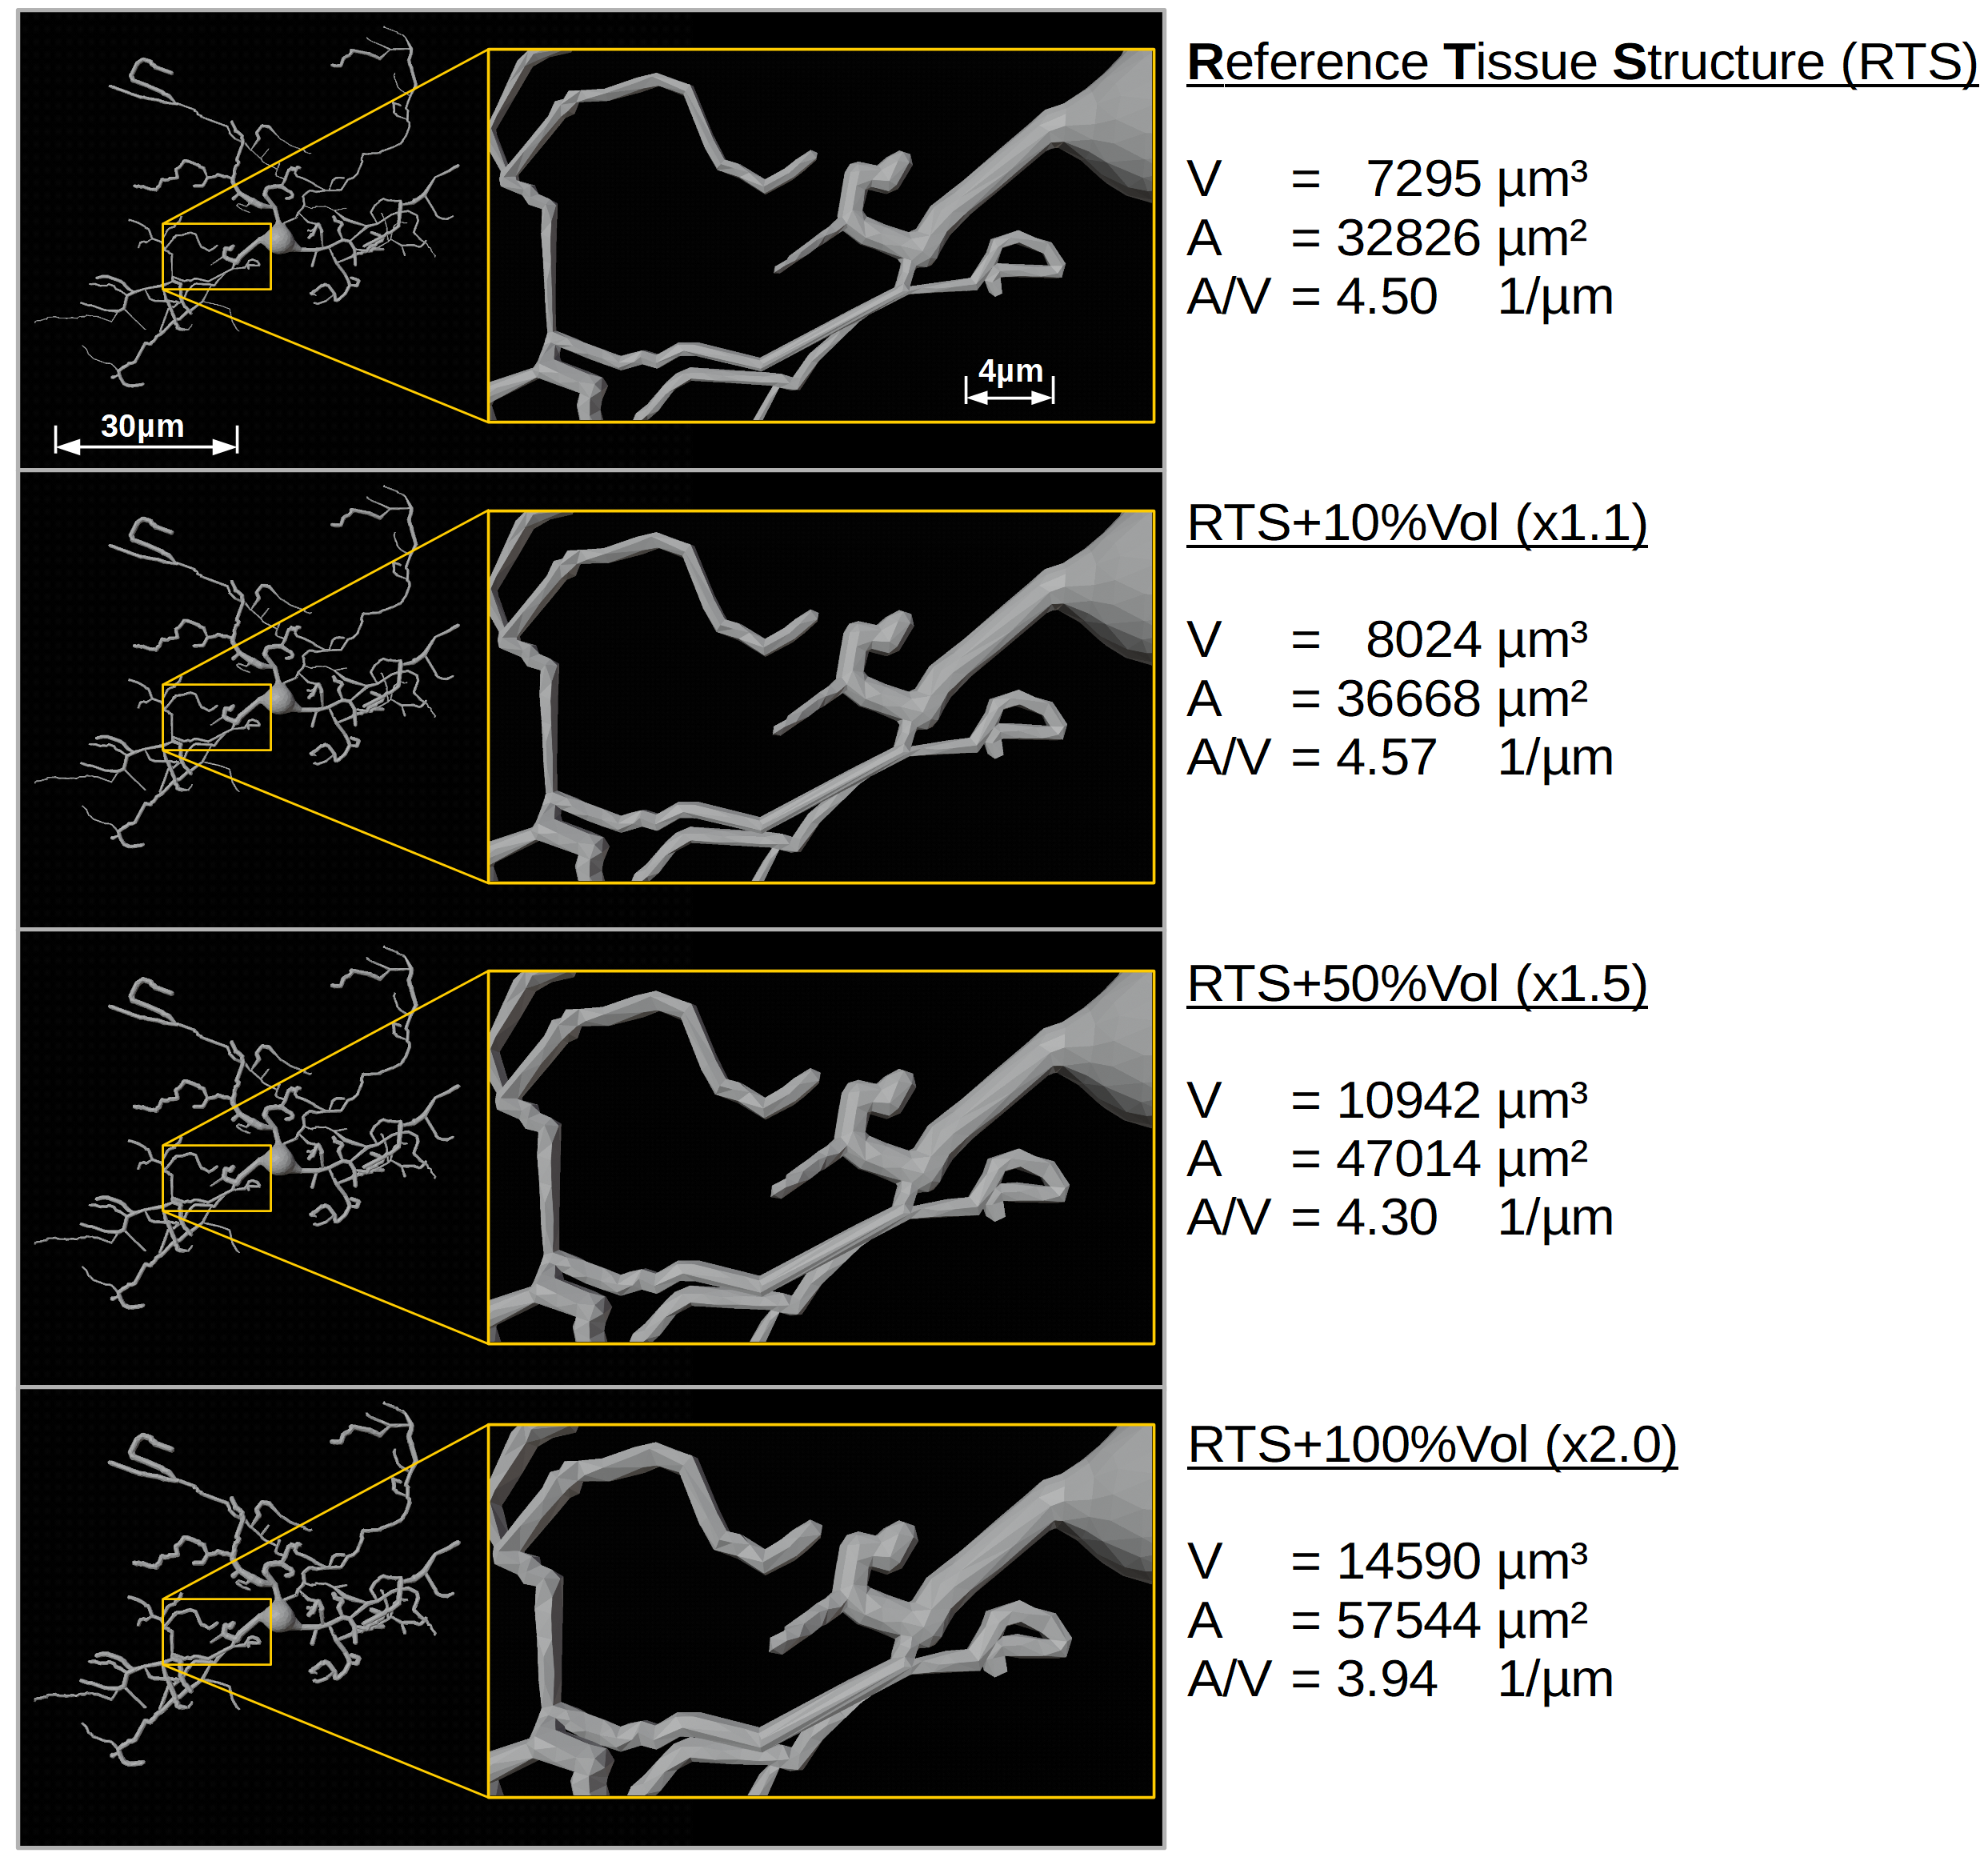
Diffusion MR spectroscopy (dMRS) can provide information on metabolite diffusion, which is partially cell-type specific and restricted to intracellular space. Thus, metabolite diffusion encodes the cellular microstructure with more specificity than water diffusion and can serve as a biomarker. However, to derive quantitative histological information from dMRS signal, novel modelling techniques are required.The aim of this work is to extend existing GPU-based Monte-Carlo (MC) simulation techniques1 to allow efficient modelling of intracellular diffusion in realistic tissue samples for arbitrarily-shaped diffusion gradient-waveforms. We simulated non-Gaussian and anomalous diffusion in realistic glial cells for three types of diffusion-encoding gradient-waveforms: pulsed gradient spin echo (PGSE)2, oscillating gradient spin echo (OGSE)3 and spherical tensor encoding (STE)4,5. The modeled tissue sample of 150x150x150μm³ (40x40x40nm³ resolution) contained 30 isotopically distributed glial cells. Hypothesized cell-swelling evoked by glial activation6 was simulated by inflating the intracellular volume by 10%, 50% and 100%. Diffusion was modeled at a temporal resolution of 1μs for up to 500k random-walkers.
Methods
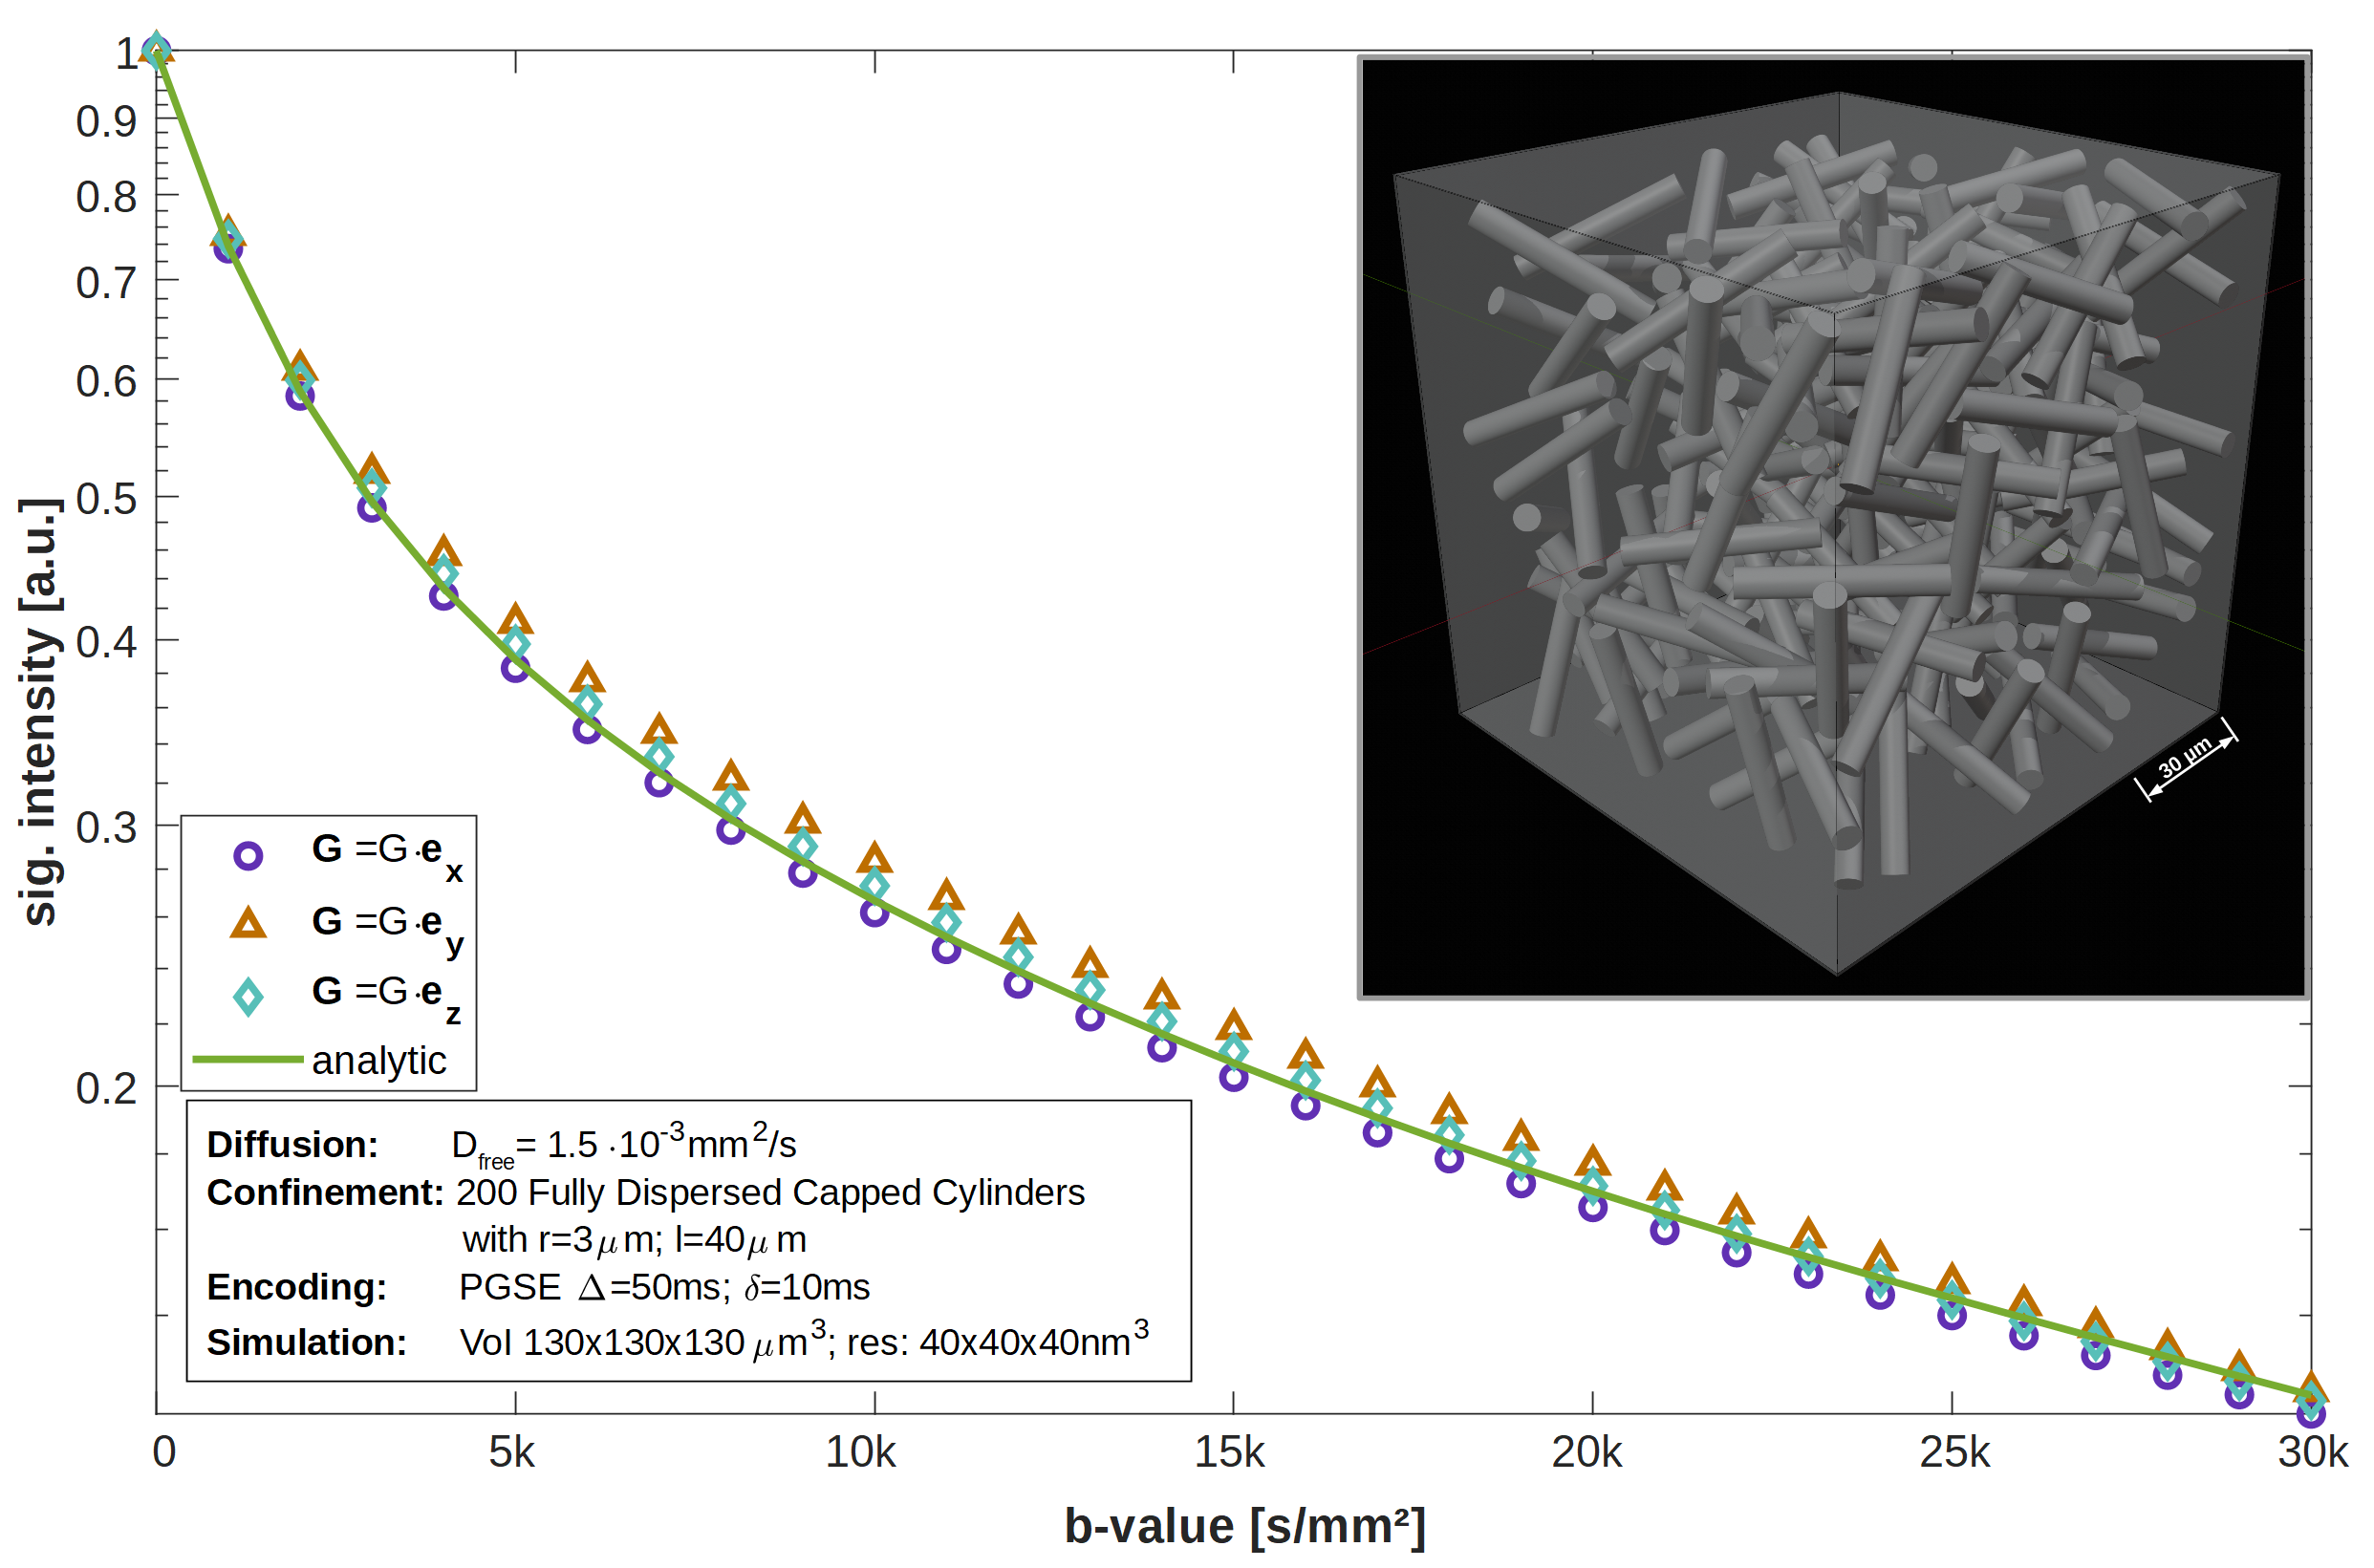
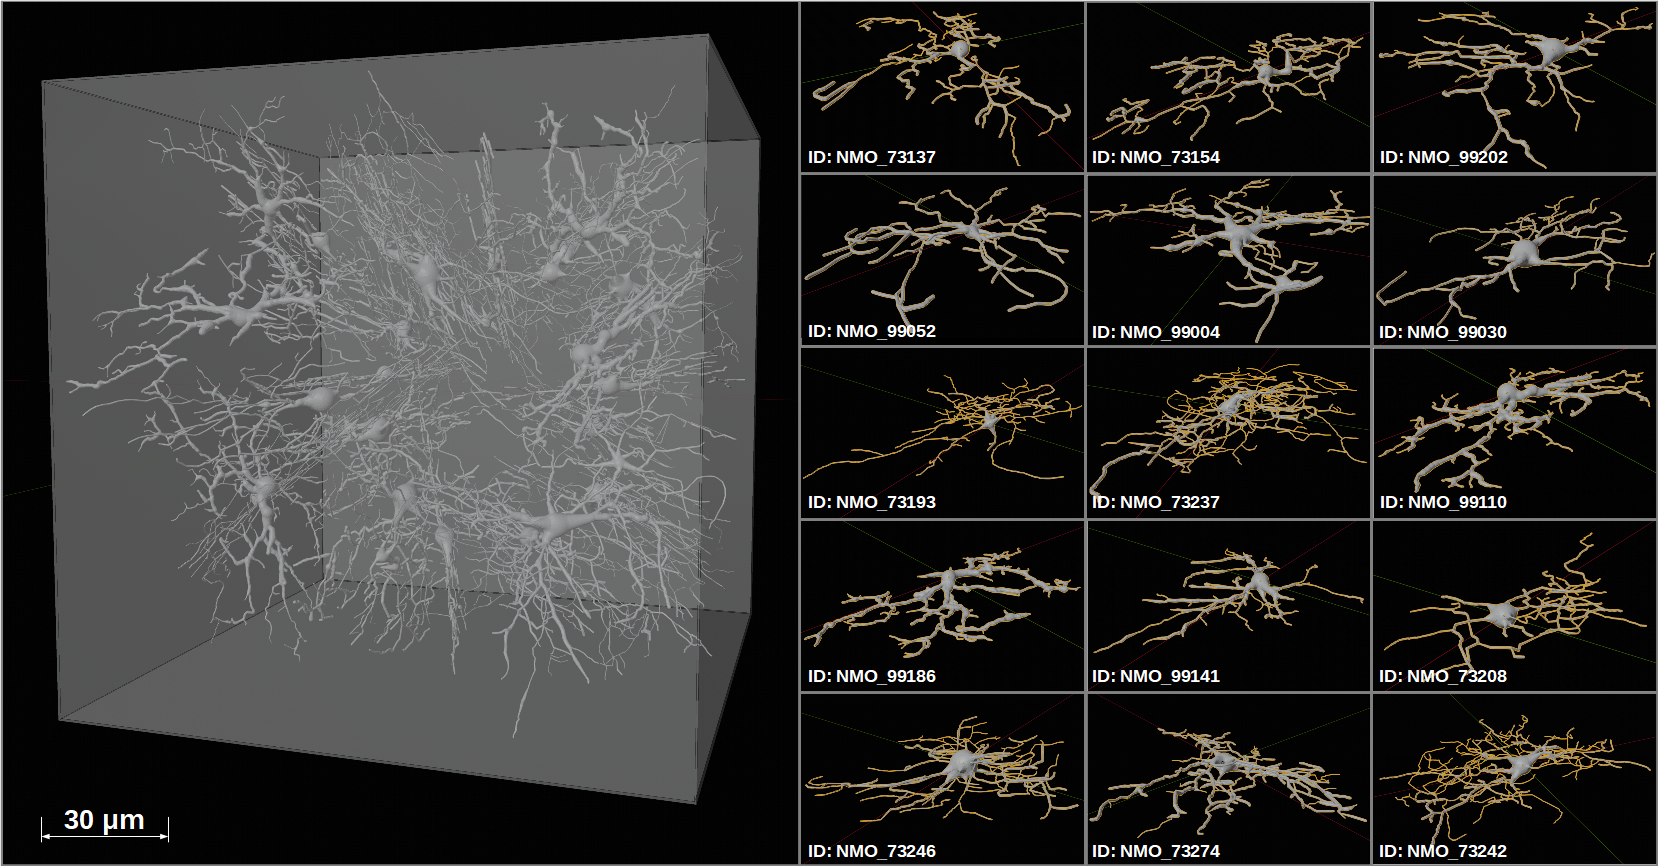
Tissue models: Simulations were validated with fully-dispersed capped cylinders (cf. Fig.1). As the simulation target, an isotropic reference tissue sample (RTS) was created from monkey glial cells taken from NeuroMorpho7,8 and meshed in NeuroMorphoVis9,10(cf. Fig.2).Monte-Carlo simulation: Diffusion was modeled on a consumer GPU (Nvidia GTX 1070, 8GByte). The MC implementation of Nguyen et al.1 was extended:
- Tissue mask: binary mask replaced by a Morton-encoded mask11,12 (8x less memory requirement; realistic VOIs of 150x150x150μm³ at 40x40x40nm³ resolution requires 5.3GByte memory)
- Diffusion encoding: Reimplemented to support arbitrary diffusion gradient-waveforms
- Voxelization: Implemented on GPU to efficiently convert tissue meshes to tissue masks11,12
- Seeding: Reimplementation on GPU (approx. 20x faster)
- GUI: GPU-simulator implemented as mex MatLab-plugin, including a MatLab GUI and the NOW-toolbox5,13 to create free gradient waveforms
- Simulation validation: PGSE Δ/δ:50/10ms; b=0…30k s/mm² (n=31 values); 500k rnd. walkers
- Non-Gaussian Diffusion: PGSE Δ/δ:70/10ms; STE dur:2x40ms; b=0…30k s/mm² (n=31); 500k rnd. walkers
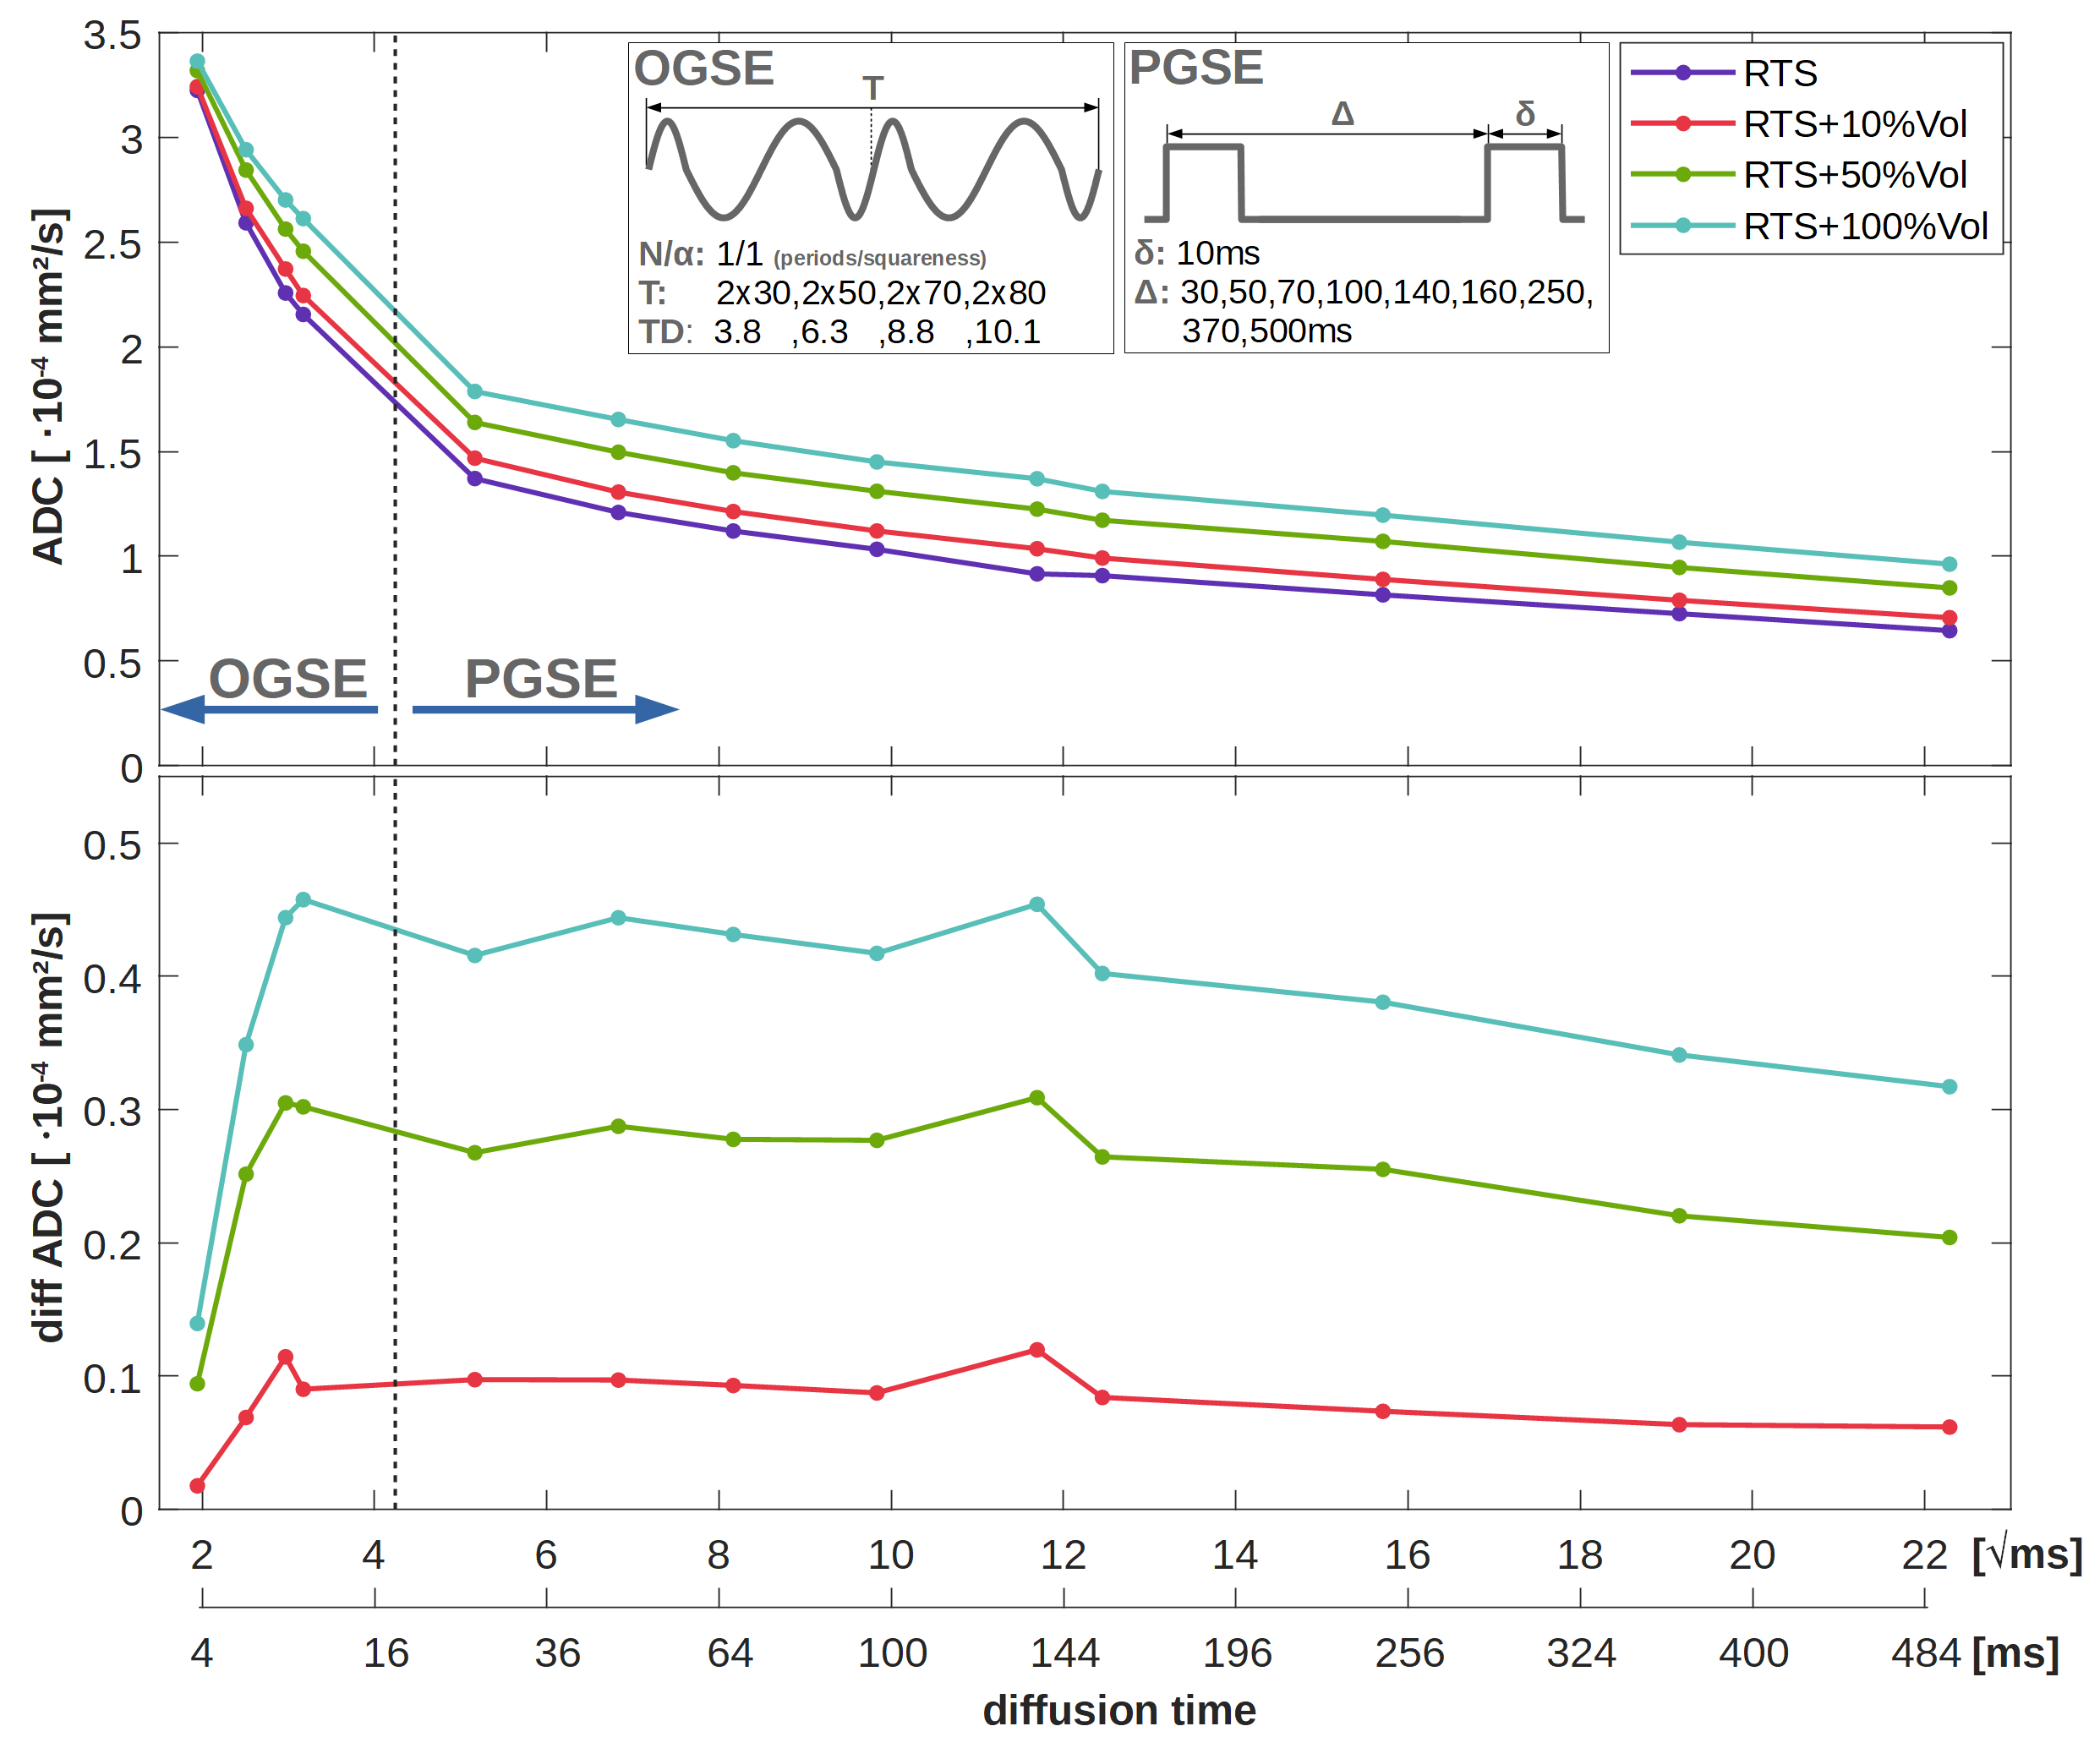
- Anomalous Diffusion: OGSE N/α:1/1, dur:2x30,2x50,2x70,2x80ms; PGSE Δ/δ:30,50,70,100,140,160,250,370,500/10ms; b=0…4k s/mm² (n=11); 100k rnd. walkers; mono-exponential ADC model
Results and Discussion
Depending on the number of random-walkers and gradient sampling points (gradient duration/temporal resolution) computation of a single direction takes 2-10min. This is considerably faster than for CPU-implementations (Camino15) or FEM approaches (SpinDoctor16), which can easily exceed 8hrs1 computation time.Fig.1 proves a good agreement between the analytic solution17 and the MC simulation for capped cylinders, with maximal deviation <5%, which is probably related to sample anisotropy and can be resolved by adding more cylinders.
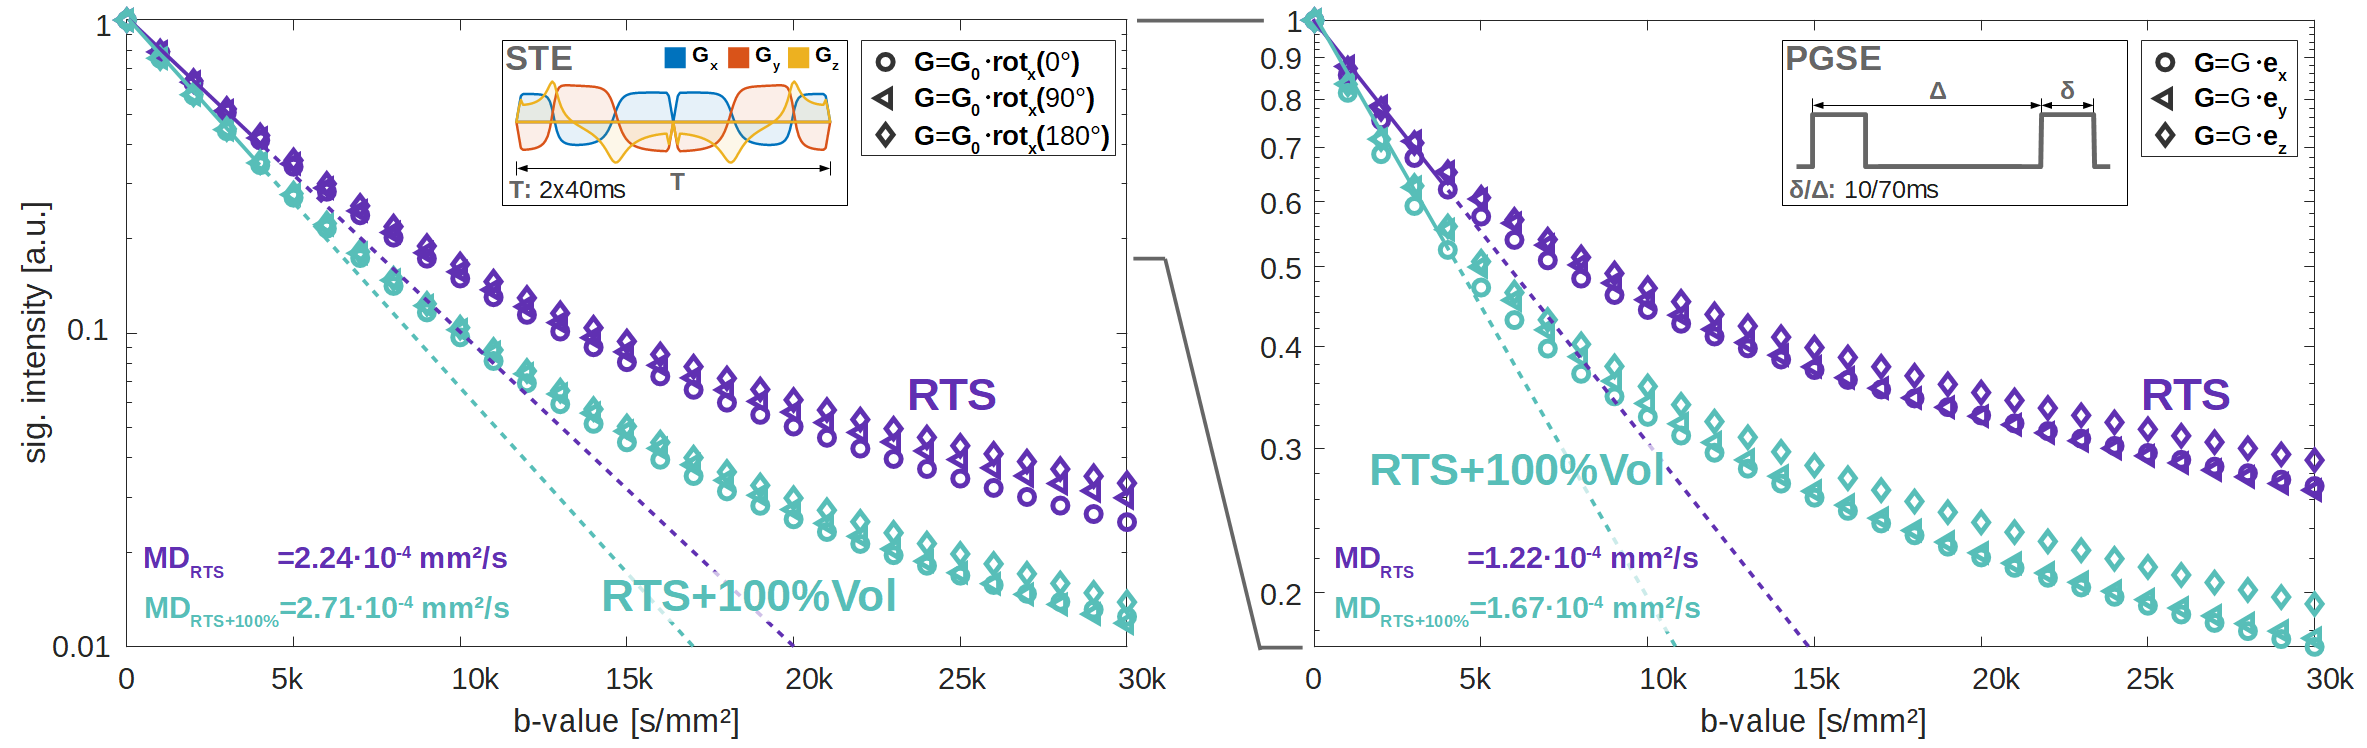
Fig.4 juxtaposes non-Gaussian diffusion behavior simulated for STE and PGSE encoding. In the mono-exponential range (<4000s/mm²) a 100% intracellular volume inflation yielded mean diffusivity (MD) increases by 20% for STE and 40% for PGSE. In this range, the simulation confirms rotation-invariance of STE, while PGSE reveals tissue anisotropy along the z-axis. At higher b-values, tissue anisotropy even appears for STE, which might indicate a discernible effect of TD anisotropy along different axes4. The attenuation behavior for PGSE encoding agrees well with human in vivo data for tCho18. The sensitivity towards cell-swelling increases at higher diffusion-weighting as reported for neuronal activation in functional dMRI19.
The effect of cell-swelling on anomalous diffusion is summarized in Fig.5, where TDs <20ms were modeled with OGSE and >20ms with PGSE encoding. The obtained MDs between 1.0×10⁻⁴mm²/s (TD=500ms) and 3.3×10⁻⁴mm²/s (TD=3.8ms) align well with values reported for glial markers (cholines/inositols)20. Though optimal sensitivity towards cell-swelling is observed at TDs of 5-100ms, it reduces only slightly even at longer TDs. In the ultra-short TD range (<5ms) a drastic reduction in sensitivity is observed, where diffusion is less affected by tissue confinement, but more by the cytoplasmic composition (e.g. organelles, macromolecules, proteins). Note, these results rely on a free diffusivity of 1.5×10⁻³mm²/s, which is close to the expected value in pure water. This would be in-line with reported water-like cytoplasmic viscosities21, but opposed to higher values22.
Reported ADC increases of tCho from 1.24 to 1.77×10⁻⁴mm²/s in neuroinflammation23 and from 1.28 to 1.42×10⁻⁴mm²/s in systemic lupus erythematosus24 (TD≈60ms) would reflect mean intracellular volume increases by 100% and 50%, respectively. However, we expect that real tissue cellular swelling is anisotropic, where single cells may experience more drastic morphological changes, while others remain unaffected.
Conclusion
Highly parallelized GPU computing with efficient memory-management allows simulation of metabolite diffusion in realistic tissue structures (>50×109 voxels).Our results agree well with non-Gaussian and anomalous diffusion in glial markers. Determination of true intracellular viscosity is planned with detailed spectral analyses of OGSE at ultra-short TD supported by experimental data.
Glial swelling with volume-inflations of 50%-100% was shown to be resolvable with dMRS ideally at b-values >4000s/mm² and diffusion times of 10-100ms.
Acknowledgements
This work is supported by the Swiss National Science Foundation (SNSF #188142).References
1. Nguyen K, Hernández-Garzón E and Valette J. Efficient GPU-based Monte-Carlo simulation of diffusion in real astrocytes reconstructed from confocal microscopy. J Magn Reson 2018, 296:188–99.
2. Stejskal EO and Tanner JE. Spin diffusion measurements: spin echoes in the presence of a time-dependant field gradient. J Chem Phys 1965, 42: 288–92.
3. Gross B and Kosfeld R. Anwendung der Spin-Echo-Methode bei der Messung der Selbstdiffusion. Messtechnik 1969, 77:171–177.
4. Szczepankiewicz F et al. Is spherical diffusion encoding rotation invariant? An investigation of diffusion time-dependence in the healthy brain. Intl Soc Mag Reson Med 2020, 0223.
5. Szczepankiewicz F, Westin C and Nilsson M. Maxwell-Compensated design of asymmetric gradient waveforms for tensor-valued diffusion encoding. Magn Reson Med 2019, 82:1424–37.
6. Walker FR et al. Dynamic structural remodelling of microglia in health and disease: A review of the models, the signals and the mechanisms. Brain Behav Immun 2014, 37:1–14.
7. Ascoli GA. Mobilizing the base of neuroscience data: the case of neuronal morphologies. Nat Rev Neurosci 2006, 7:318–24.
8. Ascoli GA, Donohue DE and Halavi M. NeuroMorpho.Org: A Central Resource for Neuronal Morphologies. J Neurosci 2007, 27:9247–51.
9. Abdellah M et al. NeuroMorphoVis: a collaborative framework for analysis and visualization of neuronal morphology skeletons reconstructed from microscopy stacks. Bioinformatics 2018, 34:i574–82.
10. Abdellah M et al. Reconstruction and visualization of large-scale volumetric models of neocortical circuits for physically-plausible in silico optical studies. BMC Bioinformatics 2017, 18:402.
11. Baert J. Cuda Voxelizer: A GPU-accelerated Mesh Voxelizer 2017.
12. Schwarz M and Seidel HP. Fast parallel surface and solid voxelization on GPUs. ACM SIGGRAPH Asia 2010, 10:29.
13. Sjölund J et al. Constrained optimization of gradient waveforms for generalized diffusion encoding. J Magn Reson 2015, 261:157–68.
14. Ligneul C and Valette J. Probing metabolite diffusion at ultra-short time scales in the mouse brain using optimized oscillating gradients and short-echo-time diffusion-weighted MRS. NMR Biomed 2017, 30:e3671.
15. Cook P et al. Camino: Open-Source Diffusion-MRI Reconstruction and Processing. Intl Soc Mag Reson Med 2006, 2759.
16. Li J et al. SpinDoctor: A MATLAB toolbox for diffusion MRI simulation. NeuroImage 2019, 202:116120.
17. Söderman O & Jönsson B. Restricted Diffusion in Cylindrical Geometry. J Magn Reson Ser A 1995, 117:94–7.
18. Ingo C, Brink W, Ercan E, Webb AG and Ronen I. Studying neurons and glia non-invasively via anomalous subdiffusion of intracellular metabolites. Brain Struct Funct 2018, 223:3841–54.
19. Abe Y, Van Nguyen K, Tsurugizawa T, Ciobanu L and Le Bihan D. Modulation of water diffusion by activation-induced neural cell swelling in Aplysia Californica. Sci Rep 2017, 7:6178.
20. Valette J, Ligneul C, Marchadour C, Najac C and Palombo M. Brain Metabolite Diffusion from Ultra-Short to Ultra-Long Time Scales: What Do We Learn, Where Should We Go? Front Neurosci 2018, 12:1–6.
21. Fushimi K and Verkman AS. Low viscosity in the aqueous domain of cell cytoplasm measured by picosecond polarization microfluorimetry. J Cell Biol 1991, 112:719–25.
22. Ligneul C, Palombo M, Flament J and Valette J. Approaching free intracellular diffusion by diffusion-weighted MRS at ultra-short time scales: initial results in the rodent brain using a 1.5 T/m gradient. Proc Intl Soc Mag Reson Med 2017, 25:1082.
23. Ronen I et al. Glial changes induced by lipopolysaccharide inflammatory challenge in humans detected with diffusion-weighted MRS. Intl Soc Mag Reson Med 2020, 1801.
24. Ercan E et al. Glial and axonal changes in systemic lupus erythematosus measured with diffusion of intracellular metabolites. Brain 2016, 139: 1447–57.
Figures