3395
Long-term stability of cerebrovascular reactivity varies across brain regions1Basque Center on Cognition, Brain and Language, Donostia, Spain, 2University of the Basque Country UPV/EHU, Donostia, Spain, 3Department of Physical Therapy and Human Movement Sciences, Feinberg School of Medicine, Northwestern University, Chicago, IL, United States, 4Montreal Neurological Institute, McGill University, Montreal, QC, Canada, 5Biomedical Engineering, McCormick School of Engineering and Applied Sciences, Northwestern University, Chicago, IL, United States
Synopsis
The reliability of cerebrovascular reactivity varies across brain regions, but little is known about what factors drive such variability. By leveraging a high-quality precision functional mapping dataset of breath-hold induced cerebrovascular reactivity (7 subjects with 10 sessions each), we assessed how much parcellations describing different architectures (i.e. vascular anatomy, functional networks, subcortical anatomy) could present internal homogeneity, and hence explain these regionally-specific reliability. We found that all architectures taken into account can equally explain these spatial patterns of cerebrovascular reactivity.
Introduction
The estimation of cerebrovascular reactivity (CVR) can be a valuable assessment in the clinical routine. The blood oxygenation level-dependent (BOLD) based functional magnetic resonance imaging (fMRI) contrast is commonly used for CVR mapping studies, and a non-invasive way to implement BOLD-CVR measurements is to adopt voluntary respiratory challenges, such as breath-hold (BH) tasks1. A BH task induces the subject in a state of hypercapnia that causes a transient increase in blood flow and the BOLD signal, similar to CO2 gas challenges2. BH-induced CVR can be assessed despite inconsistent subject performance3, and it can be successfully implemented in many types of populations4,5. More importantly, it was shown that measuring BH-induced CVR with BOLD-fMRI is highly reliable3,6–10. However, the reliability of BH-induced CVR, frequently expressed using the Intraclass Correlation Coefficient (ICC), is not constant across the whole brain, possibly suggesting regional state-like or trait-like driving factors. Local variability has been observed not only across different brain tissues, but also across hemispheres and between cortical and subcortical areas8,10. The same observation can be extended to the CVR response lag10.Despite these observations, little is known about which factors induce this regionally-specific reliability. Therefore, in this study we inspect how different architectures of the brain (e.g. a vascular architecture vs a functional network architecture) can specifically explain local differences in the long-term stability of CVR (i.e. be more homogeneous). We use three different atlases, one based on functional networks11, one based on vascular anatomy (arterial flow territories)12, and one based on anatomical subcortical and cerebellar parcellation13, to investigate if local CVR reliability is specific to certain regions of interests (ROI).
While it is possible that the neural activations elicited by the BH task are responsible for regional differences in CVR reliability, we hypothesize that the observed spatial patterns of long-term stability are associated with the vascular architecture of the brain. As such, we expect that ROIs circumscribing vascular territories will demonstrate more specific (i.e. homogeneous) reliability as compared to functional or anatomical ROIs.
Methods
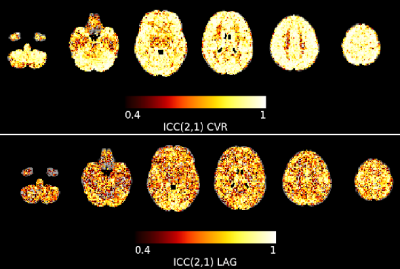
We leveraged a precision functional mapping dataset of BH tasks3 (Figure 1B), acquired in seven subjects over ten sessions, using optimally-combined multi-echo BOLD fMRI14. Subjects were instructed through visual cues. Further details about the breath-hold paradigm, data acquisition, and preprocessing can be found in 10 (see Figure 1).For the current study, we used the maps of the voxelwise reliability of CVR and lag metrics (ICCCVR and ICClag, respectively) of the optimally-combined analysis (see Figure 2, adapted from 10). Then, we generated 1000 whole-brain surrogate datasets of the voxelwise ICCCVR and ICClag maps, maintaining spatial autocorrelation properties15. We used each atlas (vascular, functional, and subcortical) to extract within-parcel variance of the ICC values from the original ICC maps and from all surrogates maps, scaling them by the variance of all brain voxels. We used a modified version of the atlas described in 12 to take into account inter-hemispheric differences. Finally, for each ROI we assessed the probability of the ICC variance being lower in the original data than in the surrogate null data, that would indicate a better match with the intrinsic organisation of the data. Otherwise, the underlying data might be better described with a different organization than that delimited by the region.
Results and Discussion
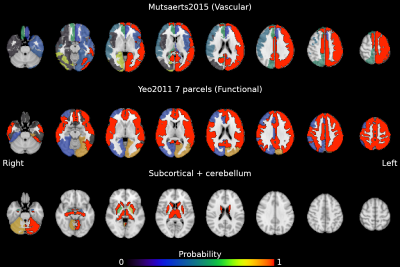
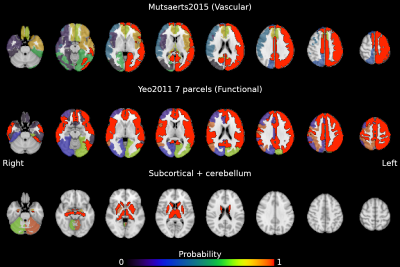
Figures 2 and 3 show the probability of ICCCVR and ICClag maps being more homogeneous in the true data than in surrogate data, respectively. For both ICCCVR and ICClag maps, the areas vascularised by the left intermediate and distal anterior, medial, and posterior carotid artery, as well as by the right intermediate anterior carotid artery, have high probability of presenting homogeneous reliability beyond that expected due to spatial autocorrelation. Contrary to our hypothesis, for both ICCCVR and ICClag maps, the left somatomotor, dorsal attention, salience, control, and default mode networks, as well as the right somatomotor, salience, and default mode networks (plus the dorsal attention network for ICCCVR maps), also exhibit high probability of presenting homogeneous reliability. Similarly, most of the subcortical areas, as well as the left cerebellum in the case of ICCCVR maps, feature high homogeneity.Parcels from all atlases show significant specificity, indicating that the three architectures taken into account here could explain equally well the observed patterns in ICCCVR and ICClag. This could indicate that CVR and its lag could share specific individual characteristics with other cerebral features (e.g. functional networks16,17). Moreover, given that functional areas are vascularised by sections of the carotid arteries, our observation that both atlases present similarly specific reliability corroborates the presence of an important link between vascular physiology and functional networks18.
Conclusion
We showed how long-term stability of cerebrovascular reactivity not only presents regional variations, but also how regional specificity can be specific to vascular anatomy and functional networks. Understanding what drives regional patterns of reliability can provide insight into whether regional CVR or lag values represent more state-like or trait-like physiological information, if such information is authentic, and aid in the interpretation of whether these regional values have meaningfully changed in the presence of pathology.Acknowledgements
This work was supported by the European Union’s Horizon 2020 research and innovation program (Marie Skłodowska-Curie grant agreement No. 713673), a fellowship from La Caixa Foundation (ID 100010434, fellowship code LCF/BQ/IN17/11620063), the Spanish Ministry of Economy and Competitiveness (Ramon y Cajal Fellowship, RYC-2017- 21845), the Basque Government (BERC 2018-2021 and PIBA_2019_104), the Spanish Ministry of Science, Innovation and Universities (MICINN; PID2019-105520GB-100), and the Eunice Kennedy Shriver National Institute of Child Health and Human Development of the National Institutes of Health under award number K12HD073945.References
1. Kastrup A, Li T, Takahashi A, Glover GH, Moseley ME. Functional Magnetic Resonance Imaging of Regional Cerebral Blood Oxygenation Changes During Breath Holding. Stroke. 1998;29(12):2641-2645. doi:doi: 10.1161/01.STR.29.12.2641
2. Kastrup A, Krüger G, Neumann-Haefelin T, Moseley ME. Assessment of cerebrovascular reactivity with functional magnetic resonance imaging: Comparison of CO2 and breath holding. Magn Reson Imaging. 2001;19(1):13-20. doi:10.1016/S0730-725X(01)00227-2
3. Bright MG, Murphy K. Reliable quantification of BOLD fMRI cerebrovascular reactivity despite poor breath-hold performance. Neuroimage. 2013;83:559-568. doi:10.1016/j.neuroimage.2013.07.007
4. Thomason ME, Burrows BE, Gabrieli JDE, Glover GH. Breath holding reveals differences in fMRI BOLD signal in children and adults. Neuroimage. 2005;25(3):824-837. doi:10.1016/j.neuroimage.2004.12.026
5. Handwerker DA, Gazzaley A, Inglis BA, D’Esposito M. Reducing vascular variability of fMRI data across aging populations using a breathholding task. Hum Brain Mapp. 2007;28(9):846-859. doi:10.1002/hbm.20307
6. Peng S-L, Yang H-C, Chen C-M, Shih C-T. Short- and long-term reproducibility of BOLD signal change induced by breath-holding at 1.5 and 3 T. NMR Biomed. Published online 2019. doi:10.1002/nbm.4195
7. Magon S, Basso G, Farace P, Ricciardi GK, Beltramello A, Sbarbati A. Reproducibility of BOLD signal change induced by breath holding. Neuroimage. 2009;45:702-712. doi:10.1016/j.neuroimage.2008.12.059
8. Lipp I, Murphy K, Caseras X, Wise RG. Agreement and repeatability of vascular reactivity estimates based on a breath-hold task and a resting state scan. Neuroimage. 2015;113:387-396. doi:10.1016/j.neuroimage.2015.03.004
9. Cohen AD, Wang Y. Improving the Assessment of Breath-Holding Induced Cerebral Vascular Reactivity Using a Multiband Multi-echo ASL/BOLD Sequence. Sci Rep. 2019;9(1):1-12. doi:10.1038/s41598-019-41199-w
10. Moia S, Termenon M, Uruñuela E, et al. ICA-based Denoising Strategies in Breath-Hold Induced Cerebrovascular Reactivity Mapping with Multi Echo BOLD fMRI. bioRxiv. Published online 2020:2020.08.18.256479. doi:10.1101/2020.08.18.256479
11. Yeo BTT, Krienen FM, Sepulcre J, et al. The organization of the human cerebral cortex estimated by intrinsic functional connectivity. J Neurophysiol. 2011;106:1125-1165. doi:10.1152/jn.00338.2011.
12. Mutsaerts HJMM, Van Dalen J, Heijtel DFR, et al. Cerebral perfusion measurements in elderly with hypertension using arterial spin labeling. PLoS One. 2015;10(8):1-13. doi:10.1371/journal.pone.0133717
13. Fischl B, Salat DH, Busa E, et al. Whole Brain Segmentation. Neuron. 2002;33(3):341-355. doi:10.1016/s0896-6273(02)00569-x
14. Moia S, Uruñuela E, Ferrer V, Caballero-Gaudes C. EuskalIBUR. Published online 2020. doi:10.18112/openneuro.ds003192.v1.0.1
15. Burt JB, Helmer M, Shinn M, Anticevic A, Murray JD. Generative modeling of brain maps with spatial autocorrelation. Neuroimage. 2020;220(February):117038. doi:10.1016/j.neuroimage.2020.117038
16. Finn ES, Shen X, Scheinost D, et al. Functional connectome fingerprinting: Identifying individuals using patterns of brain connectivity. Nat Neurosci. 2015;18(11):1664-1671. doi:10.1038/nn.4135
17. Gratton C, Laumann TO, Nielsen AN, et al. Functional Brain Networks Are Dominated by Stable Group and Individual Factors, Not Cognitive or Daily Variation. Neuron. Published online 2018:439-452. doi:10.1016/j.neuron.2018.03.035
18. Bright MG, Whittaker JR, Driver ID, Murphy K. Vascular physiology drives functional brain networks. Neuroimage. 2020;217. doi:10.1101/475491
Figures


