3394
Cerebrovascular Reactivity Mapping using Resting-State Functional MRI in Patients with gliomas
Mei-Yu Yeh1,2, Henry S Chen2, Ping Hou2, Vinodh A. Kumar3, Jason M Johnson3, Kyle R Noll4, Sujit S Prabhu5, Donald F. Schomer3, and Ho-Ling Liu 2
1Department of Biomedical Engineering and Environmental Sciences, National Tsing Hua University, Hsinchu, Taiwan, 2Department of Imaging Physics, The University of Texas MD Anderson Cancer Center, Houston, Houston, TX, United States, 3Departments of Diagnostic Radiology, The University of Texas MD Anderson Cancer Center, Houston, TX, United States, 4Department of Neuro-oncology, The University of Texas MD Anderson Cancer Center, Houston, TX, United States, 55Department of Neurosurgery, The University of Texas MD Anderson Cancer Center, Houston, TX, United States
1Department of Biomedical Engineering and Environmental Sciences, National Tsing Hua University, Hsinchu, Taiwan, 2Department of Imaging Physics, The University of Texas MD Anderson Cancer Center, Houston, Houston, TX, United States, 3Departments of Diagnostic Radiology, The University of Texas MD Anderson Cancer Center, Houston, TX, United States, 4Department of Neuro-oncology, The University of Texas MD Anderson Cancer Center, Houston, TX, United States, 55Department of Neurosurgery, The University of Texas MD Anderson Cancer Center, Houston, TX, United States
Synopsis
Clinical functional MRI (fMRI) can be limited by neurovascular uncoupling (NVU) resulted from the pathology. Cerebrovascular reactivity (CVR) mapping based on BOLD MRI during a hypercapnia task, such as breath hold (BH), has been proposed to indicate the potential NUV. However, BH-MRI is limited by patient’s corporation. Recent studies have suggested that CVR measurement can be derived from resting-state (rs) fMRI that has also been increasing utilized to map functional networks in clinical settings. This study evaluates the CVR mapping with rs-fMRI and compare with BH-MRI in patients with gliomas.
Introduction
Cerebrovascular reactivity (CVR) MRI with hypercapnia challenges, such as a breath-hold (BH) task, has been proposed to indicate areas with neurovascular uncoupling potentials for presurgical fMRI[1]. However, performance of the breath-hold task paradigm can be challenging for patients with acute or severe conditions. Recently, resting-state CVR (RS-CVR) also provides the estimation of the CVR (e.g. using resting-state fluctuation of amplitude (RSFA) [2], or general linear model (GLM) with frequency range of 0.02–0.04 Hz and 0-0.1164 [3,4].) To the best of our knowledge, RS-CVR mapping has not been evaluated and optimized in glioma patients. This study aimed to investigate RS-CVR mapping and compare with the BH-CVR mapping in glioma patients.Methods
Twenty-three patients with gliomas underwent the MRI study on a clinical 3T scanner. MRI scans included pre- and post-contrast T1-weighted imaging, fluid attenuated inversion recovery imaging, rs-fMRI (single-shot EPI, 180 dynamics, scan time = 6 mins) and BH-MRI (single-shot EPI, 70 dynamics, 3 cycles of 15-s BH and 45-s rest). The resting-state blood oxygenation level-dependence (BOLD) fMRI data were motion-corrected, smoothed, and detrended. Two methods are used to estimate the CVR from the rs-fMRI: RSFA and regression (rRS). RSFA-CVR map was calculated by standard deviation (SD) of the BOLD signal time series.[2] In rRS -CVR, band-pass filtered was applied with 6 different frequency bands(0-0.01, 0.01-0.02, 0.02-0.04, 0.04-0.08, 0.08-0.2, and 0-0.1164 Hz) [3-4]. For each frequency band, a GLM analysis was performed using the whole-brain averaged BOLD signal as independent variable, BOLD signal in each voxel as dependent variable, and motion vectors as covariates. The BH-CVR maps were expressed as BOLD percentage signal change (PSC) and the threshold was set to 0.45 [5]. For rRS-CVR map we set a threshold t>3.45(p<0.05, corrected). RSFA-CVR map was thresholded such that the total activated fractions in gray matter in BH-CVR and RSFA maps were equal. These CVR measures was estimated in whole brain and lesion regions. Tumor ROIs were determined by segmentation using a deep learning model and inspected by a neuroradiologist. To evaluate the similarity among the RS-CVR maps and conventional BH-CVR map, voxel-wise correlation (before threshold) and the Dice index (after threshold)were calculated.Results
Compared with BH-CVR ,the rRS-CVR map in 0.02-0.04 Hz and 0.04-0.08 Hz showed the highest correlation coefficient and Dice in normal tissue and lesion (Figure 1 and 2). Specifically, the highest correlation (r = 0.65) and Dice (dice = 0.69) was found in 0.02-0.04 Hz in normal tissue. No significant difference in correlation coefficient and dice was found in lesion region between 0.02 - 0.04 and 0.04-0.08. Both correlation and Dice are significantly higher in normal tissue than lesion area. Comparing with BH-CVR, the performances of rRS-CVR in 0.02 - 0.04 Hz and 0-0.1164 Hz are similar which were both significantly better than the RSFA-CVR (Figure 3 and 4).Conclusion
Comparing with the RSFA-, rRS-CVR showed better agreement with BH-CVR. The optimal frequent bands for rRS calculation in glioma patients are consistent with previous studies from other patient populations. The agreements between rRS- and BH-CVR were better in normal tissue than in the lesion, which require further investigations.Acknowledgements
No acknowledgement found.References
1. Pillai JJ, Mikulis DJ. Cerebrovascular reactivity mapping: an evolving standard for clinical functional imaging. AJNR Am J Neuroradiol. 2015;36: 7–13. doi:10.3174/ajnr.A3941 2. Kannurpatti SS, Motes MA, Rypma B, Biswal BB. Increasing measurement accuracy of age-related BOLD signal change: minimizing vascular contributions by resting-state-fluctuation-of-amplitude scaling. Hum Brain Mapp. 2011;32: 1125–1140. doi:10.1002/hbm.21097 3. Peiying Liua,, Yang Lia,, Marco Pinho, Denise C. Park, Babu G. Welch,, Hanzhang Lu. Cerebrovascular reactivity mapping without gas challenges. NeuroImage 146 (2017) 320–326 4. Gongkai Liu, Hanzhang Lu, Yang Li, Binu Thomas, Marco Pinho, Judy Huang, Babu G. Welch, Denise C. Park, and Peiying Liu. Cerebrovascular reactivity mapping using resting-state fMRI: comparison with CO2-inhalation method in 170 controls and 50 Moyamoya patients.2020 ISMRM &SMRT Virtual Conference & Exhibition 5.Jay J.Pillai, and Domenico Zaca. Comparison of BOLD Cerebrovascular Reactivity Mapping and DSC MR Perfusion Imaging for Prediction of Neurovascular Uncoupling Potential in Brain Tumors. Technology in Cancer Research and Treatment Volume 11, Number 4, August 2012Figures
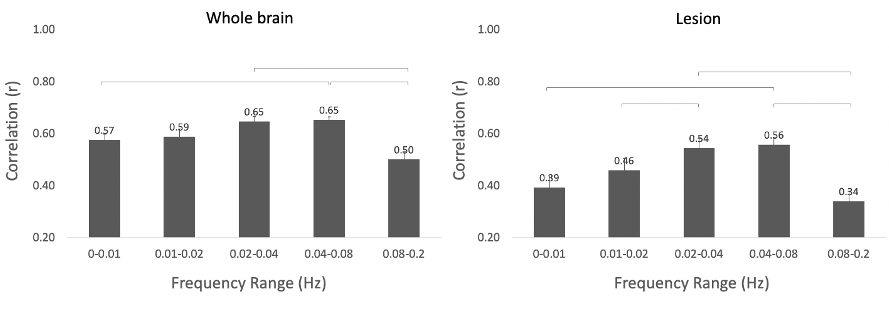
Fig.1 The correlation coefficient between BH-CVR and each different frequency ranges in normal brain tissue and in lesion.
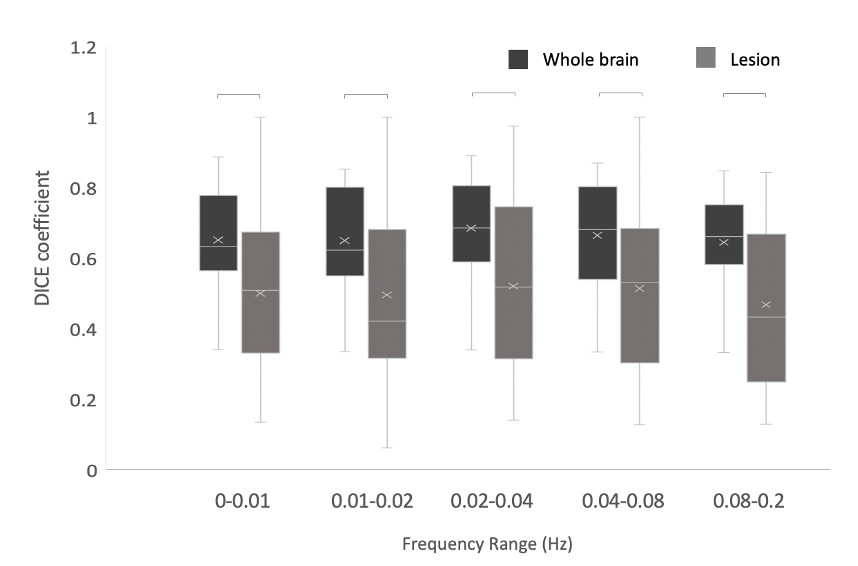
Fig.2 The dice coefficient between BH-CVR and each different frequency ranges in normal brain tissue and in lesion ( p< 0.05).
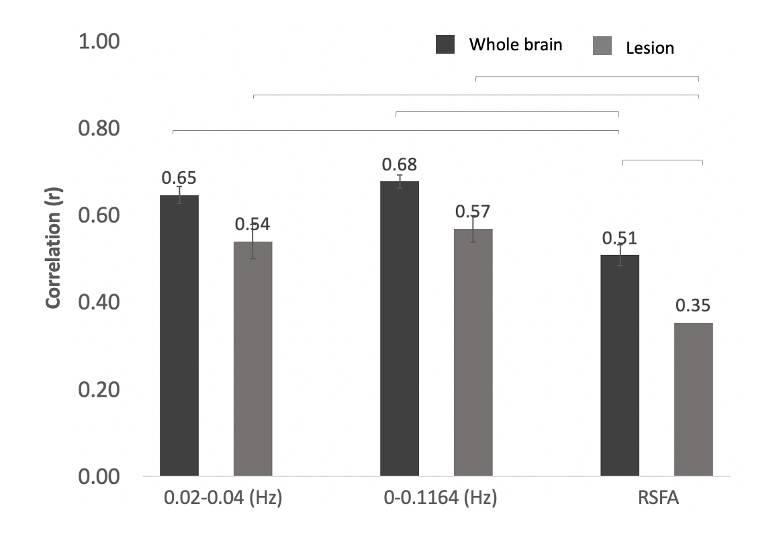
Fig.3 The correlation coefficient between BH-CVR and three different methods of mapping CVR in normal brain tissue and in lesion (p<0.05).
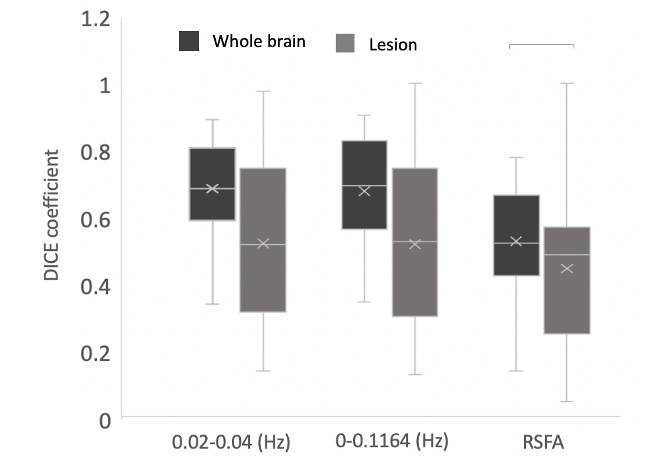
Fig.4 The dice coefficient between BH-CVR and three different methods of mapping CVR in normal brain tissue and in lesion (p<0.05).
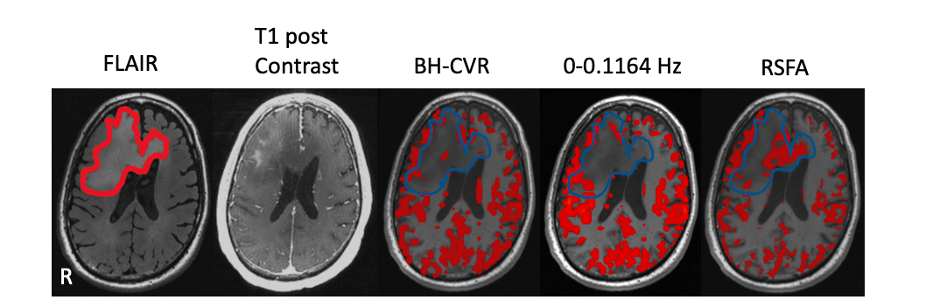
Fig.5 Imaging results from the one patient with gliomas. The first is lesion overlay on FLAIR image. The second one is T1 post contrast. The rest of all are spatial pattern among three CVR mapping approaches. The threshold of BH-CVR was set to 0.45. The threshold of rRS-CVR map was set to t>3.45(p<0.05). RSFA-CVR map was threshold such that the total activated fraction of gray matter in BH-CVR and RSFA map was equal.