3391
Assessing intersubject BOLD synchronization and BOLD-CBF coupling using movie fMRI1Centre for Neuroscience Studies, Queen's University, Kingston, ON, Canada, 2Department of Medicine, Queen's University, Kingston, ON, Canada, 3The Brain and Mind Institute, University of Western Ontario, London, ON, Canada, 4Department of Surgery, Queen's University, Kingston, ON, Canada
Synopsis
Movie fMRI is a promising alternative to resting state paradigms given its ability to evoke predictable patterns of neuronal activation. However, it remains unknown whether increased reliability of cortical activation is accompanied by increased correlation between the BOLD and CBF signals (BOLD-CBF coupling). This study compared the intersubject synchronization of the BOLD signal across 7 functional brain networks between resting state and movie fMRI, as well as potential differences in BOLD-CBF coupling. Movie fMRI significantly improved the reliability of cortical activation between subjects compared to resting state, although no significant differences in BOLD-CBF coupling were documented.
Introduction
Resting-state fMRI (rs-fMRI) is frequently used to examine the coordinated fluctuations in the blood oxygen level dependent (BOLD) signal to quantify network connectivity strength.1,2 However, the resting state paradigm lacks standardization of a participant’s cognitive processes, allowing for unconstrained fluctuations in brain activity. Alternatively, in movie fMRI (m-fMRI), functional data are acquired under naturalistic stimulus conditions that may evoke more predictable patterns of neuronal activation.3–7 Improvements in signal reliability during m-fMRI may result from increased participant engagement and compliance, suggesting that m-fMRI may be an ideal modality for identifying clinically relevant differences in signal.8BOLD signal fluctuations are modulated by changes in local deoxyhemoglobin content, which result from variations in cerebral blood flow (CBF), cerebral blood volume (CBV), and the cerebral metabolic rate of oxygen consumption (CMRO2). To decrease the ambiguity associated with a quantitative interpretation of the rs-BOLD signal, recent studies have integrated dynamic BOLD-CBF coupling to account for cerebral hemodynamics during the measurement of resting state BOLD fluctuations.9 Although m-fMRI may increase reliability in cortical activation across participants, it has yet to be determined whether this synchronization improves BOLD-CBF coupling. The purpose of the current study was to assess intersubject synchronization of the BOLD signal and evaluate voxelwise BOLD-CBF coupling for both rs-fMRI and m-fMRI modalities. We hypothesized that m-fMRI would have highly synchronized patterns of BOLD fluctuations across subjects, as well as improved BOLD-CBF coupling relative to rs-fMRI, given the predictable nature of the signal.
Methods
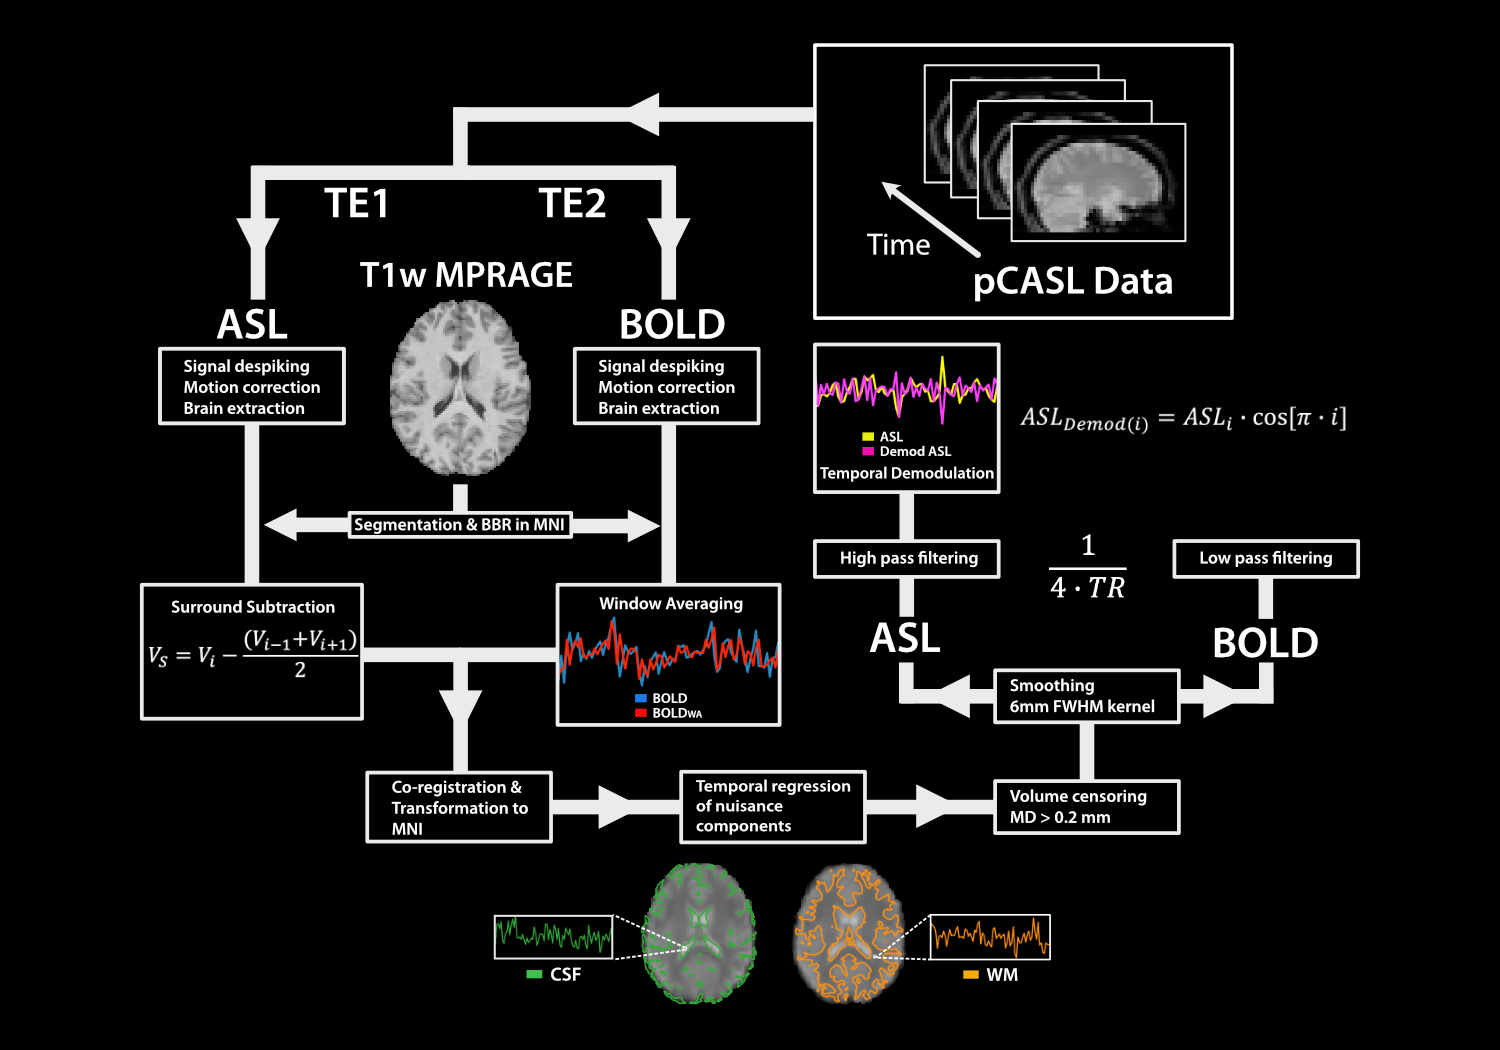
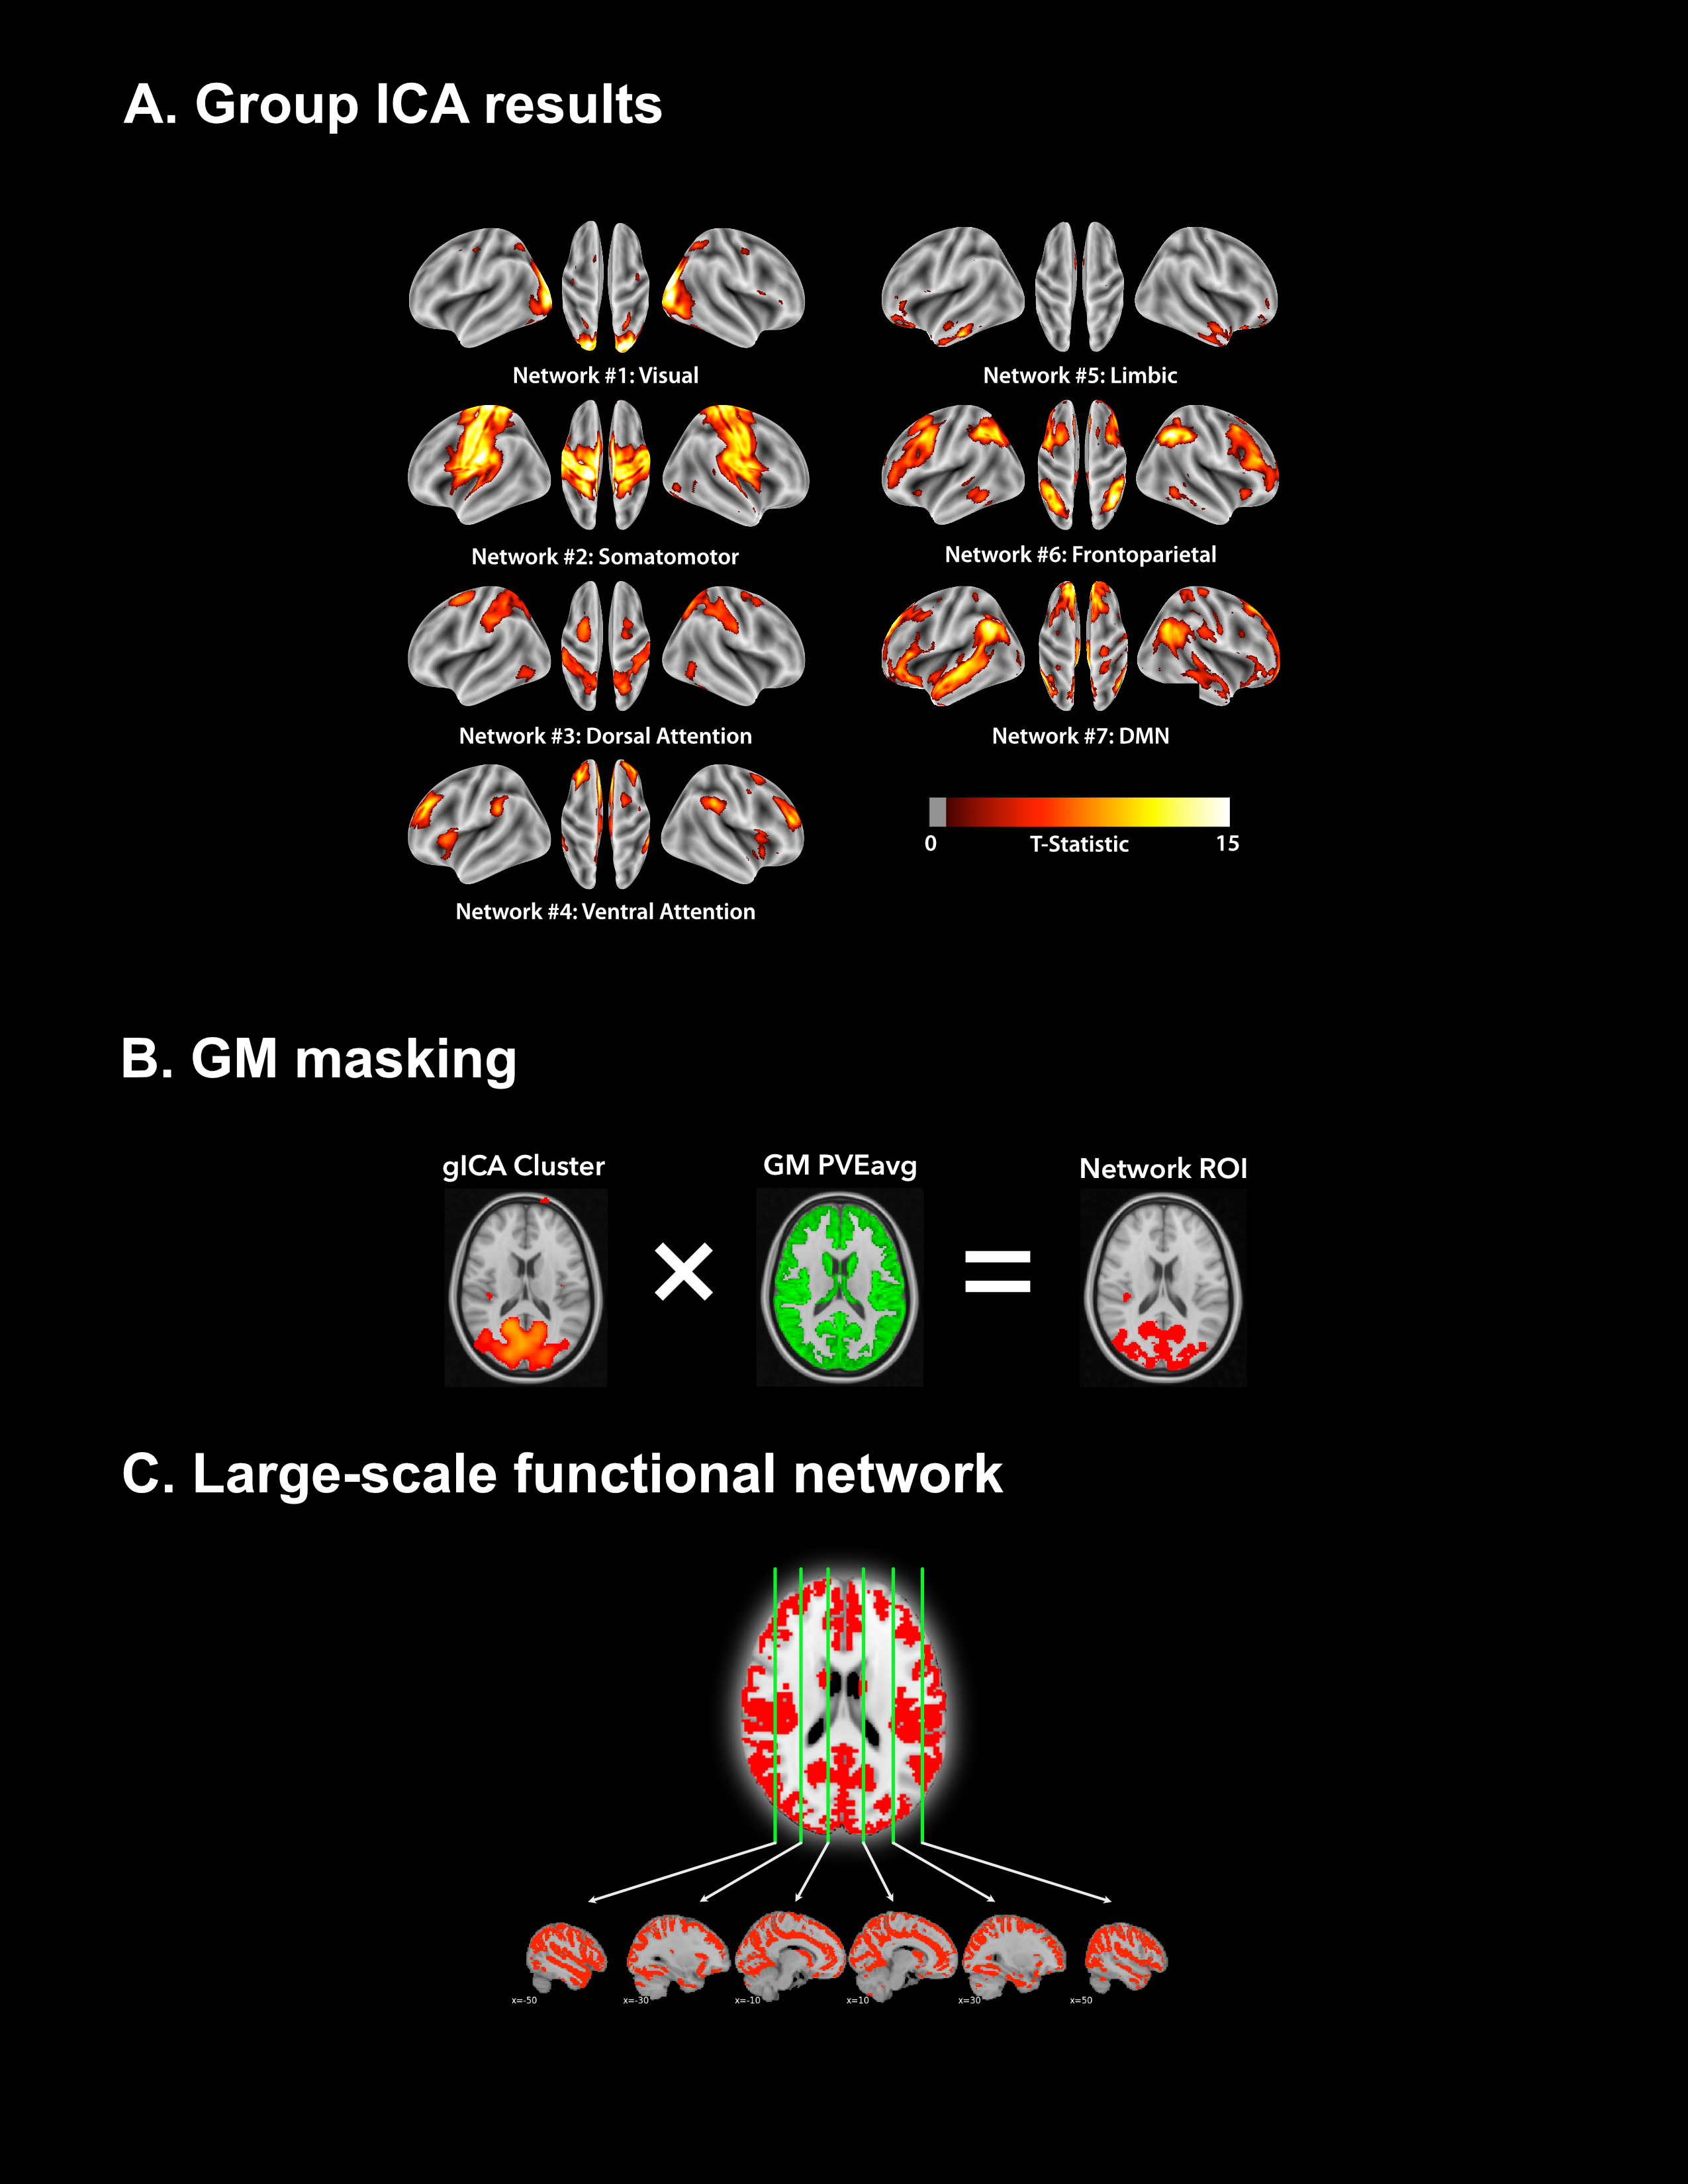
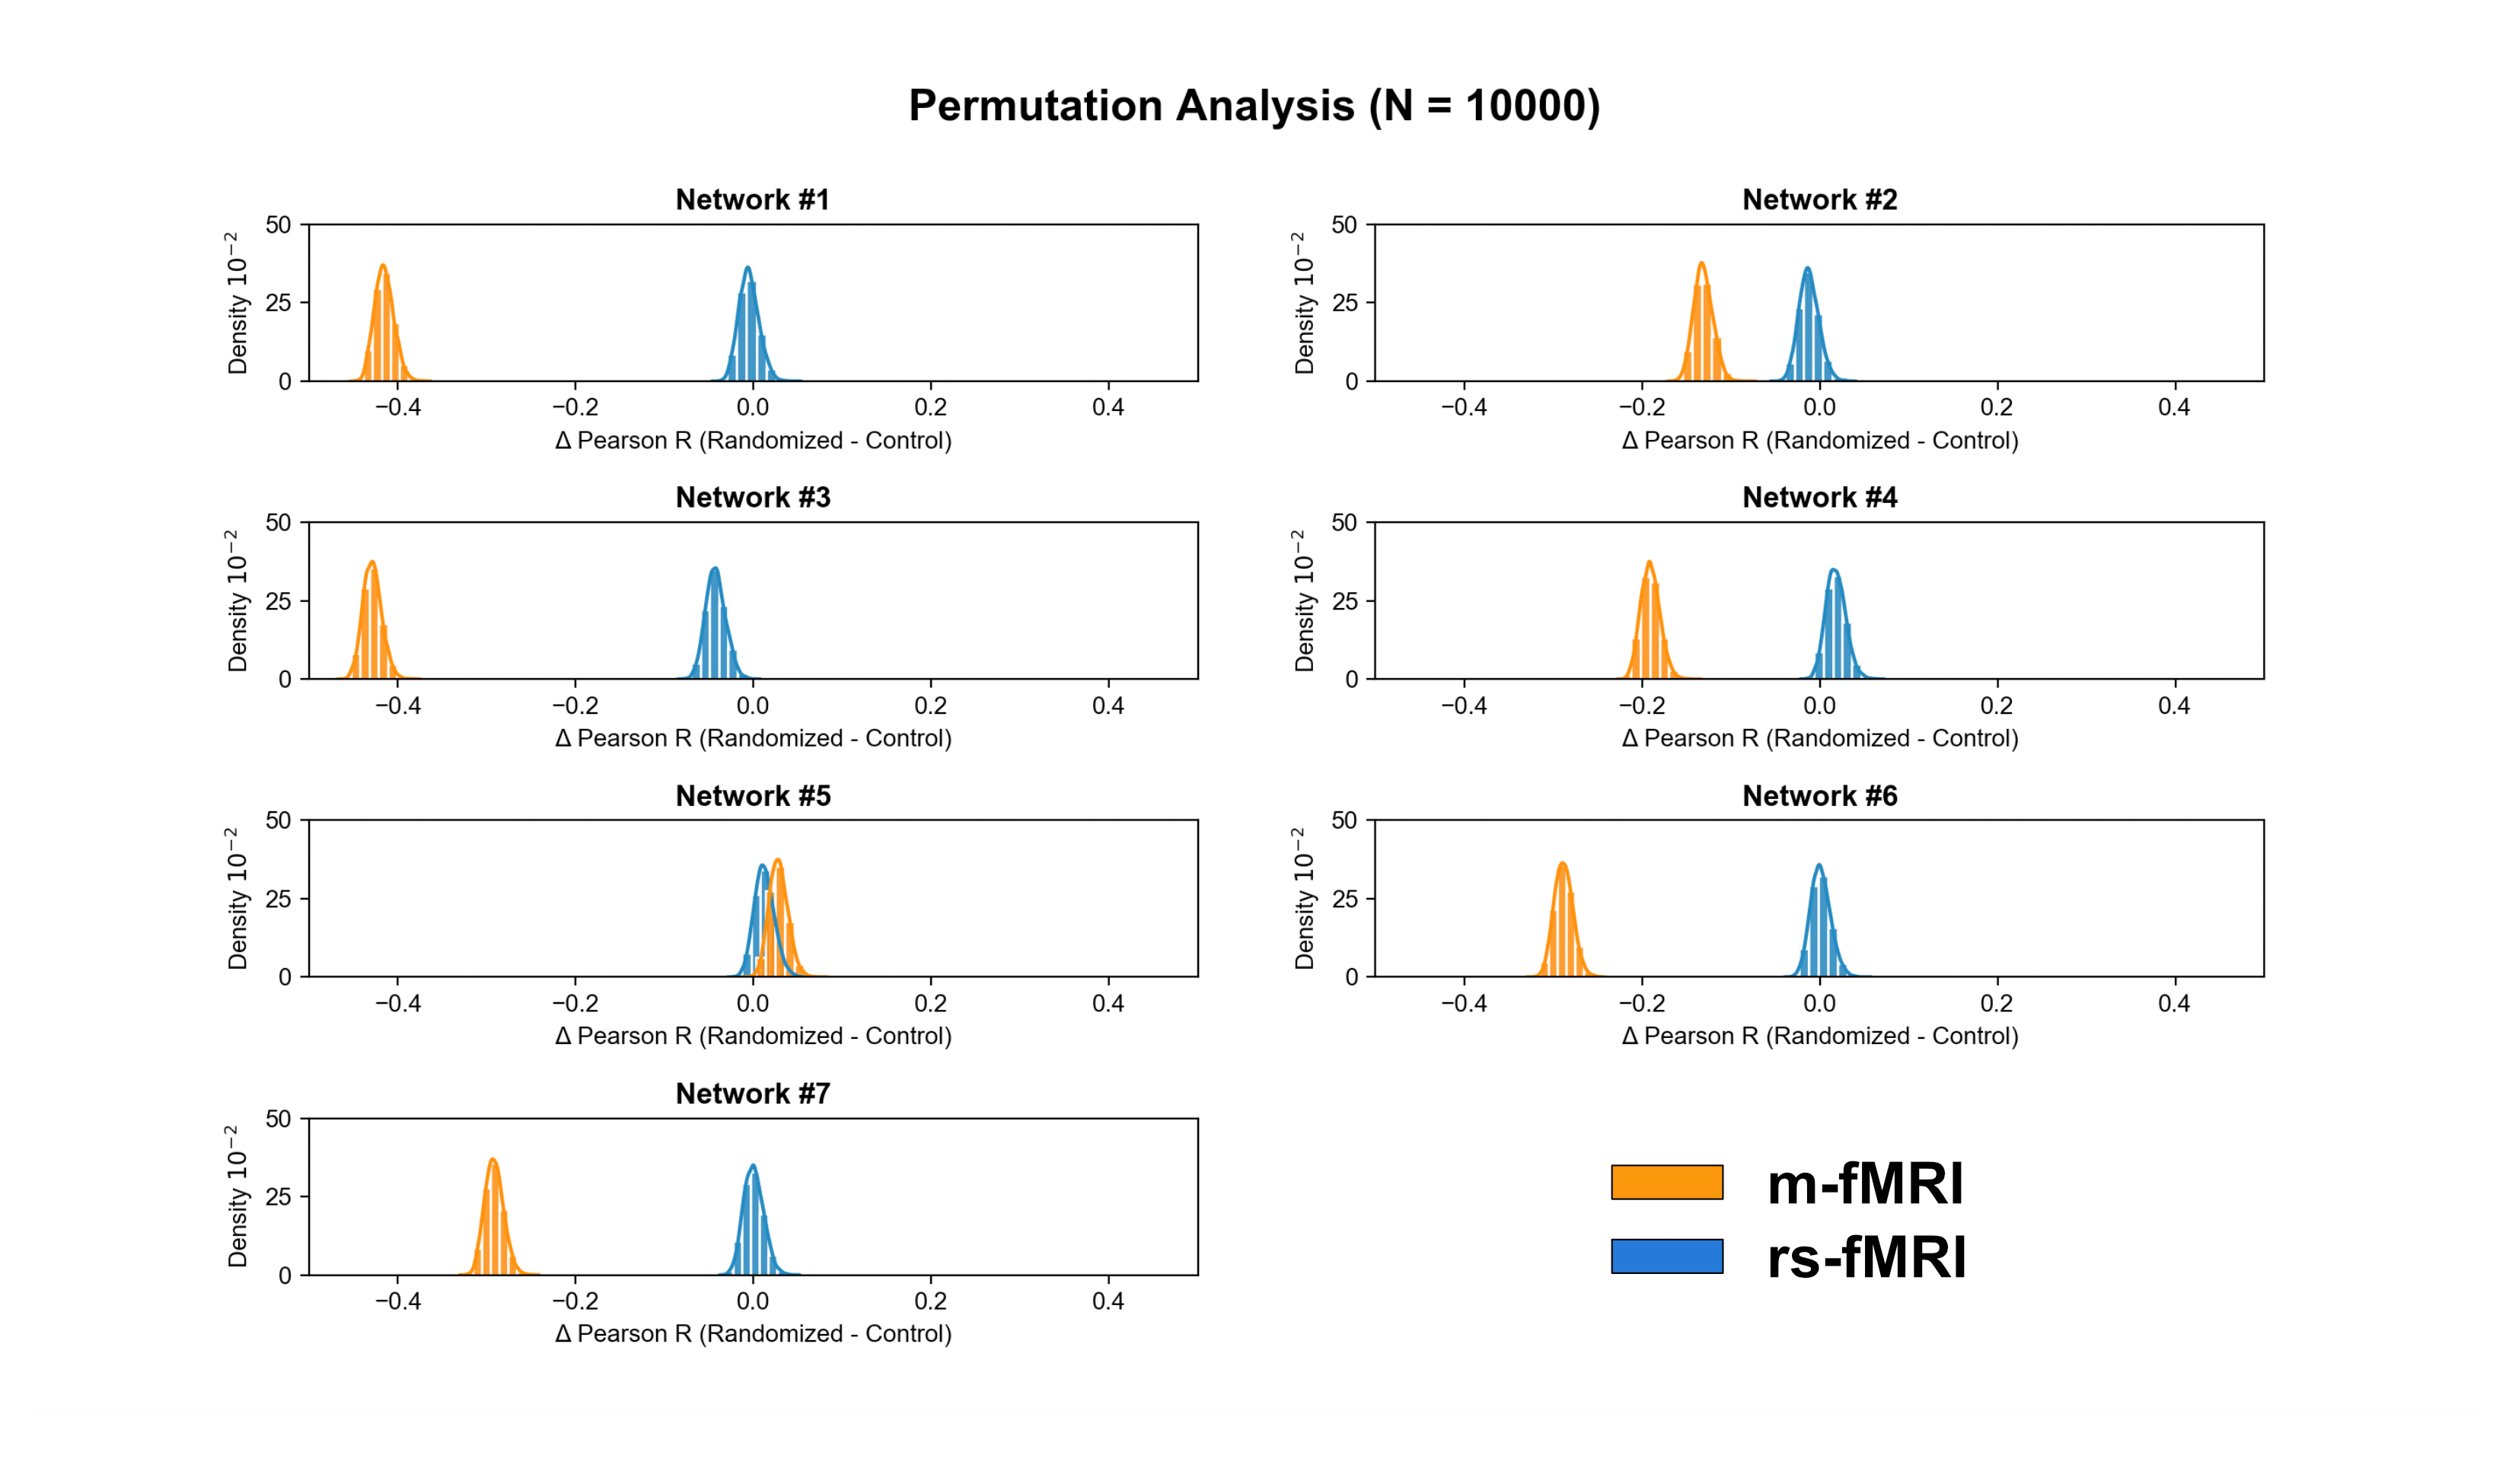
Subjects and data preprocessing. 14 healthy young adults were scanned using a 3.0 T Siemens Trim Trio system (Kingston, ON, Canada) equipped with a 32-channel head coil. High-resolution structural images (MPRAGE) and dual-echo pseudo-continuous arterial spin labeling (pCASL) images10 were obtained for the rs- and m-fMRI scans (Figure 1). Subjects were instructed to fixate on a cross during the rs-fMRI scan, whereas, during the m-fMRI condition, participants viewed “Bang You’re Dead!” (1961), by Alfred Hitchcock. Functional data were preprocessed using a combination of FSL,11 AFNI,12 and in-house Matlab scripts (Figure 1). Spatial components were identified using a group independent component analysis (gICA) with a 7-network functional atlas13 (Figure 2a). To isolate GM voxels, the GM mask for each subject was multiplied across each ICA cluster (Figure 2b). For each network, the two masks derived from each condition (rs-fMRI vs. m-fMRI) were then multiplied together to define the final ROI, representing spatial components of the brain activated during both scans. Network ROIs were also spatially concatenated to create a large-scale functional mask (Figure 2c).Intersubject synchronization of the BOLD signal. For each subject and network ROI, the rs- and m-fMRI voxelwise BOLD time series was extracted and averaged to create a mean time course. Each subject’s average BOLD time course for the resting state and movie data was then correlated with the corresponding time courses from every other subject to assess intersubject BOLD synchronization. These correlations were used as a control for a secondary randomization analysis, which induced a random shuffling of volume order in each time series. If the movie was able to coordinate BOLD fluctuations across subjects, then randomization would significantly decrease the correlation of intersubject time series. A permutation framework was also executed, whereby a different randomization sequence was applied or each iteration (N = 10,000).
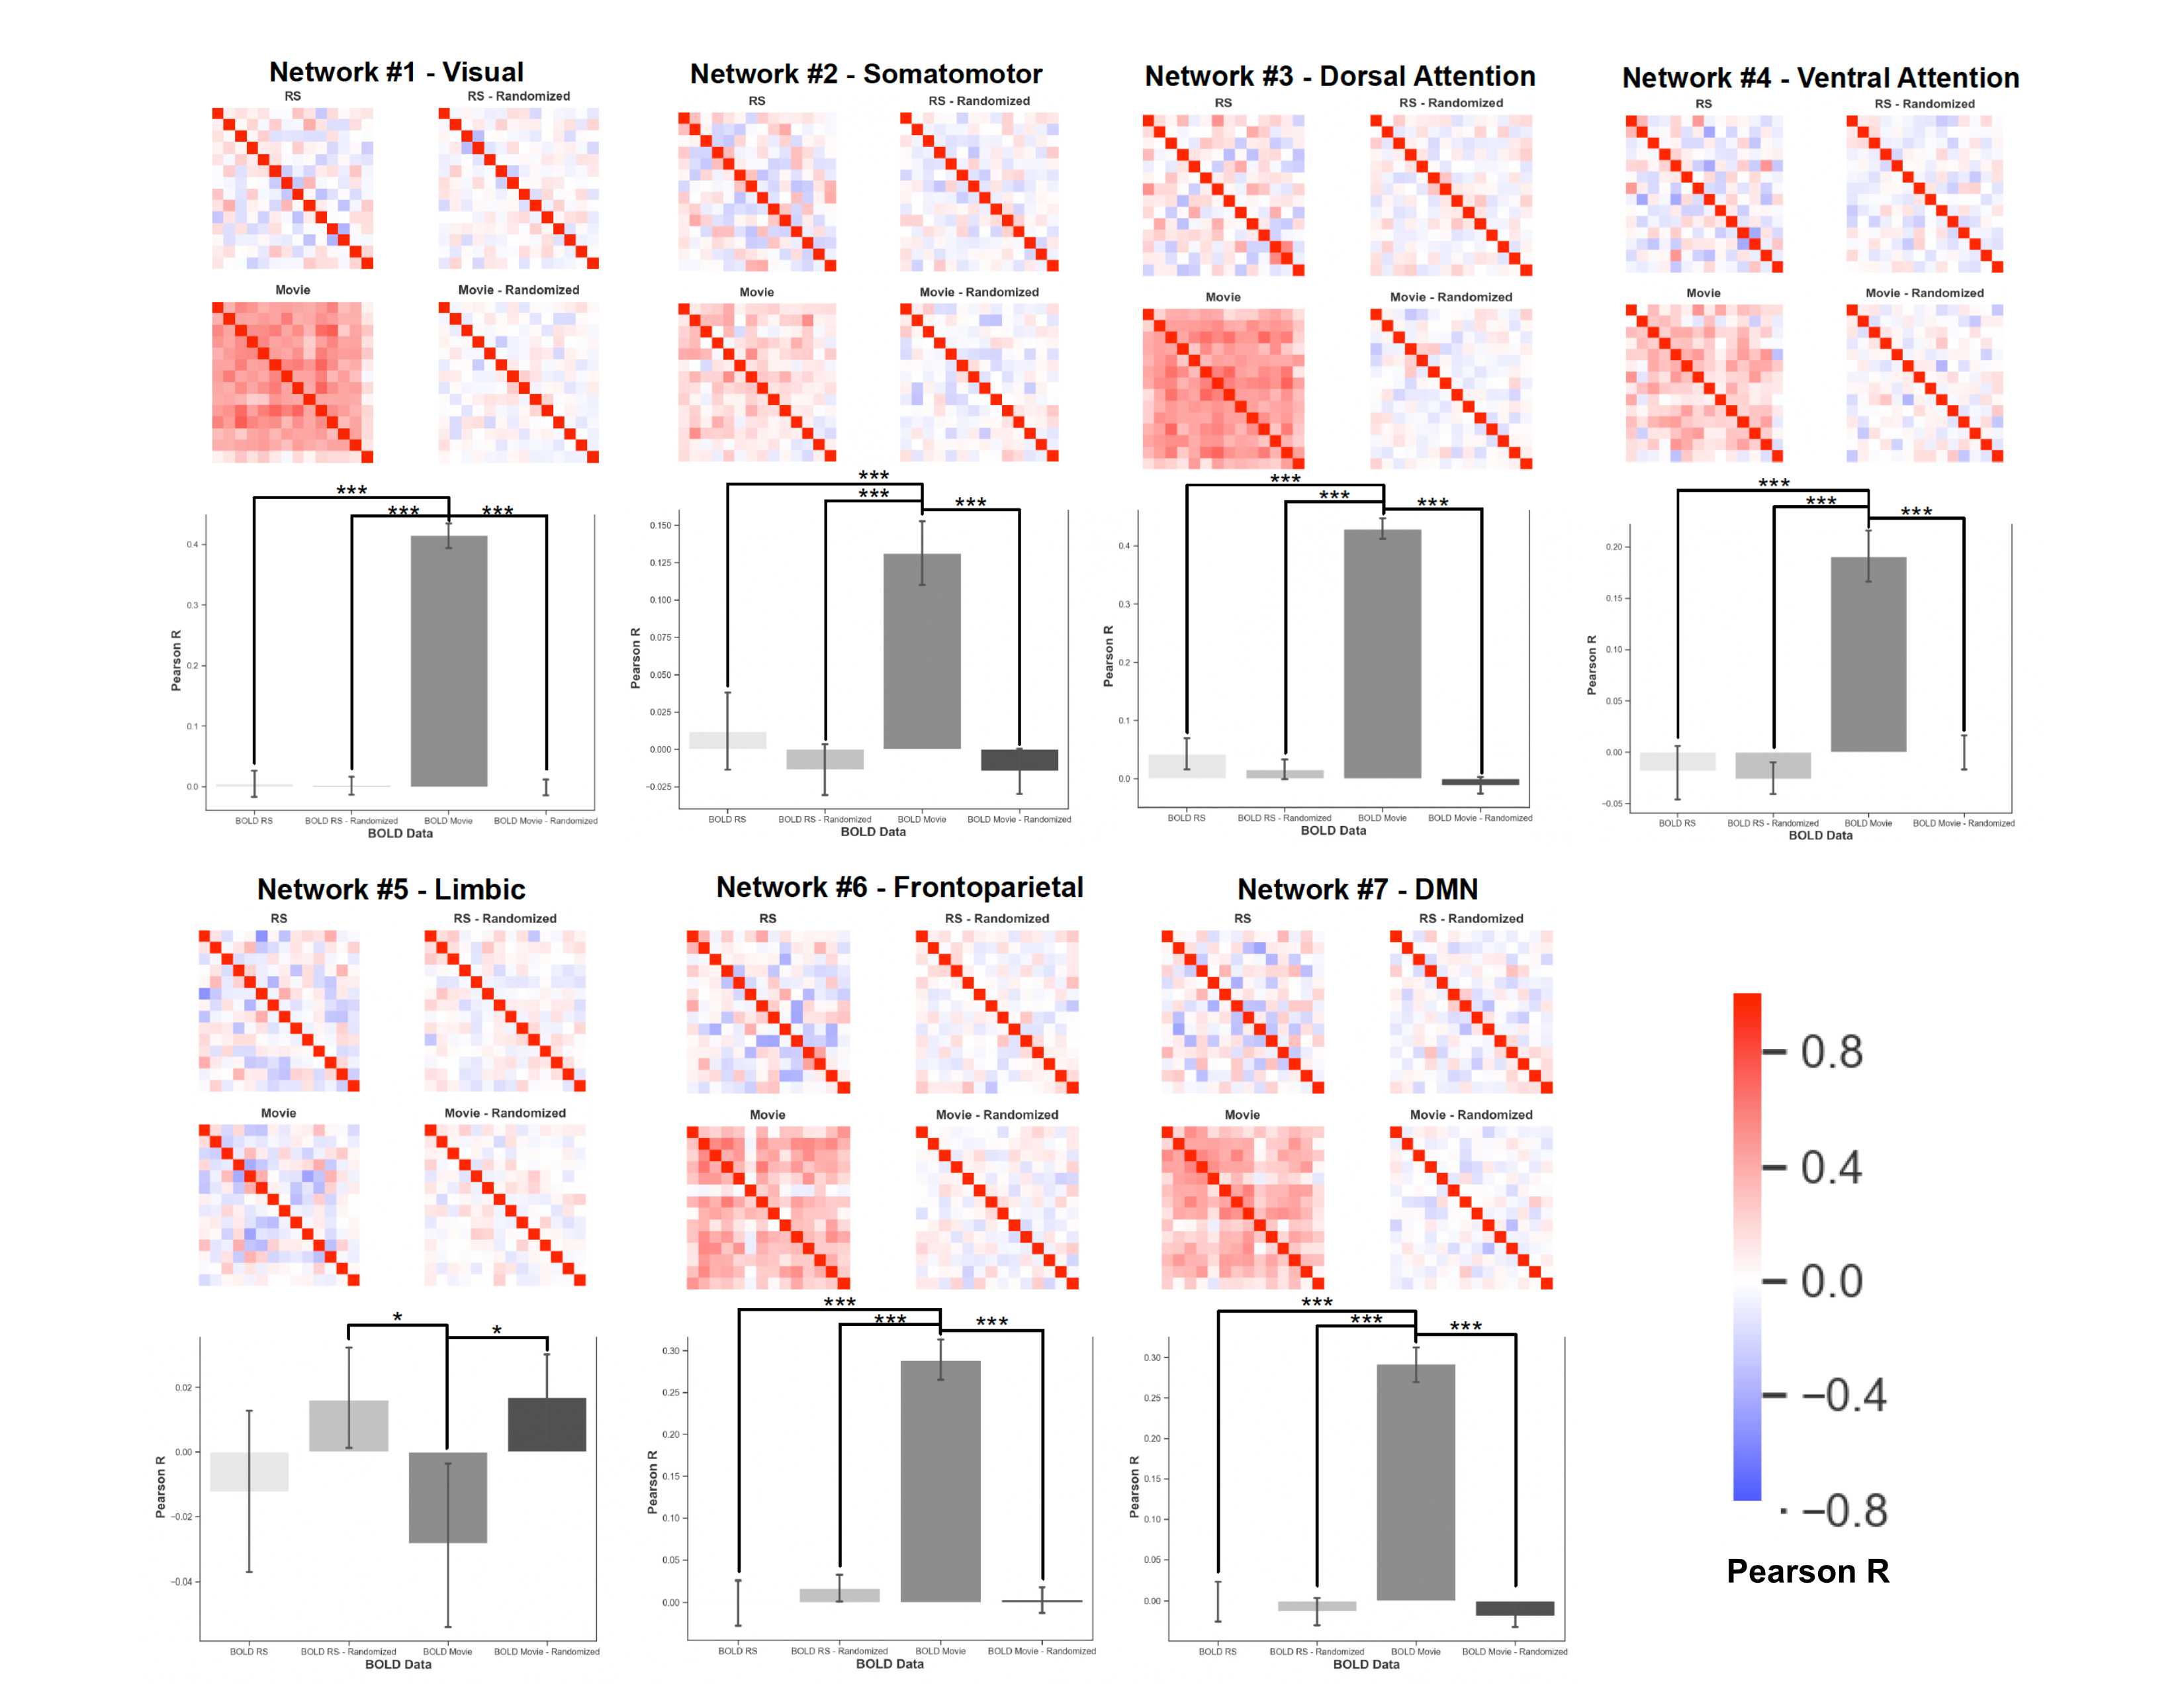
For each network ROI, correlation matrices for both the resting state and movie data were created to assess the reliability of intersubject BOLD fluctuations. Matrices were also created for the randomized condition to assess the average change in correlation induced by randomizing volume order. Differences in correlation matrices were compared statistically using a univariate analysis of variance (ANOVA; within-subject correlations on the diagonal were omitted). Post-hoc testing was performed using Tukey-HSD pairwise comparisons, with a statistical threshold set at P < .05. The permutation framework was analyzed using paired t-tests to compare the change in correlation coefficient (∆R) between the randomized and control conditions (P < .05).
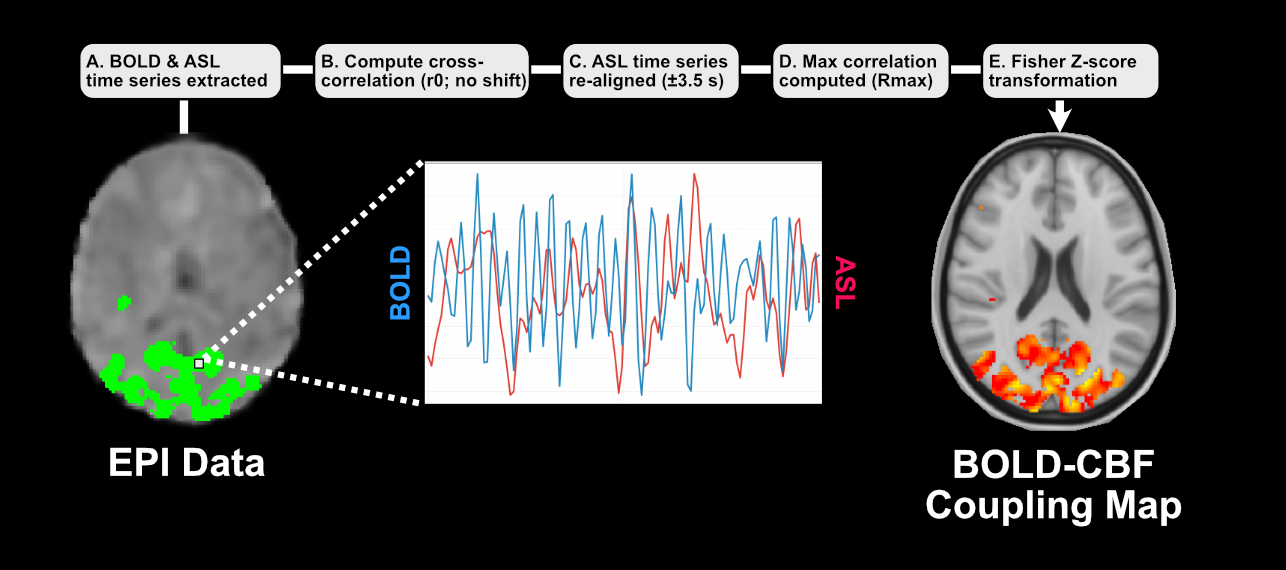
BOLD-CBF coupling. Voxelwise BOLD-CBF coupling was computed within the large-scale network mask by extracting the BOLD and ASL time courses for each voxel, realigning the two signals, and calculating a Pearson correlation coefficient. Correlation values were then converted to a Fisher z-score map to transform the sampling distribution of Pearson’s R (Figure 3). Voxelwise group comparisons of the Fisher z-score maps were computed using AFNI’s 3dttest++12 with cluster-level threshold values that reflected the global false positive rate.12
Results
Aside from the limbic network, randomization of volume order reduced intersubject synchronization of the BOLD signal in all identified ROIs (P < .05; Figure 4). Similarly, the permutation analysis revealed that the change in intersubject BOLD synchronization was significantly reduced in all networks, besides the limbic network, for movie data compared to resting state data (P < .001; Figure 5). However, no significant clusters were identified when comparing the voxelwise BOLD-CBF coupling maps of the rs- and m-fMRI data (P > .05).Conclusion
Although m-fMRI appears to greatly improve intersubject synchronization of the BOLD signal in most brain networks, this finding is not accompanied by associated improvements in BOLD-CBF coupling. Improved spatial resolution and reduced noise in the ASL signal may be required to detect differences in BOLD-CBF coupling.Acknowledgements
This work was supported by the Collaborative Health Research Projects (CHRP) Program [Grant #315705].References
1. Kannurpatti SS, Biswal BB. Detection and scaling of task-induced fMRI-BOLD response using resting state fluctuations. Neuroimage. 2008. doi:10.1016/j.neuroimage.2007.09.0402.
2. Biswal BB, Kannurpatti SS, Rypma B. Hemodynamic scaling of fMRI-BOLD signal: validation of low-frequency spectral amplitude as a scalability factor. Magn Reson Imaging. 2007. doi:10.1016/j.mri.2007.03.0223.
3. Naci L, Cusack R, Anello M, Owen AM. A common neural code for similar conscious experiences in different individuals. Proc Natl Acad Sci USA. 2014;111(39):14277-14282. doi:10.1073/pnas.14070071114.
4. Sonkusare S, Breakspear M, Guo C. Naturalistic Stimuli in Neuroscience: Critically Acclaimed. Trends Cogn Sci. 2019;23(8):699-714. doi:10.1016/j.tics.2019.05.0045.
5. Hasson U, Nir Y, Levy I, Fuhrmann G, Malach R. Intersubject Synchronization of Cortical Activity During Natural Vision. Science. 2004;303:1634-1640.6.
6. Hasson U, Malach R, Heeger DJ. Reliability of cortical activity during natural stimulation. Trends Cogn Sci. 2010;14(1):40-48. doi:10.1016/j.tics.2009.10.0117.
7. Eickhoff SB, Milham M, Vanderwal T. Towards clinical applications of movie fMRI. Neuroimage. May 2020:116860. doi:10.1016/j.neuroimage.2020.1168608.
8. O’Connor D, Potler NV, Kovacs M, et al. The healthy brain network serial scanning initiative: A resource for evaluating inter-individual differences and their reliabilities across scan conditions and sessions. Gigascience. 2017. doi:10.1093/gigascience/giw0119.
9. Chiacchiaretta P, Cerritelli F, Bubbico G, Perrucci MG, Ferretti A. Reduced dynamic coupling between spontaneous BOLD-CBF fluctuations in older adults: A dual-echo pCASL study. Front Aging Neurosci. 2018;10(APR):1-13. doi:10.3389/fnagi.2018.0011510.
10. Dai W, Garcia D, De Bazelaire C, Alsop DC. Continuous flow-driven inversion for arterial spin labeling using pulsed radio frequency and gradient fields. Magn Reson Med. 2008. doi:10.1002/mrm.2179011.
11. Jenkinson M, Beckmann CF, Behrens TEJ, Woolrich MW, Smith SM. FSL. Neuroimage. 2012;62(2):782-790. doi:10.1016/j.neuroimage.2011.09.01512.
12. Cox RW. AFNI: Software for analysis and visualization of functional magnetic resonance neuroimages. Comput Biomed Res. 1996. doi:10.1006/cbmr.1996.001413.
13. Yeo BT, Krienen FM, Sepulcre J, et al. The organization of the human cerebral cortex estimated by intrinsic functional connectivity. J Neurophysiol. 2011;106(3):1125-1165. doi:10.1152/jn.00338.2011.
Figures