3390
Visualizing Resting State Networks using Arterial Spin Labeling– Investigating the influence of Label and Control datasets1University Hospital Hamburg-Eppendorf, Hamburg, Germany, 2Tomographic Imaging Department, Philips Research Laboratories, Hamburg, Germany, 3Department of Radiology and Neuroradiology, University Hospital Schleswig-Holstein, Kiel, Germany, 4Radiology, Kantonsspital Winterthur, Winterthur, Switzerland
Synopsis
In this study, the effects of separating the label and control condtion from an Arterial Spin Labeling dataset used for resting state mapping was investigated and no differences between the label and the control condition could be found.
Introduction
Resting state functional MRI (rs-fMRI) allows for the visualization of default mode networks contributing to identify important functional brain areas. Generally, image acquisition is performed using BOLD Echo-planar imaging (EPI). Recently, Arterial Spin Labeling (ASL) data was used to map resting state default mode networks [1]. Pseudo continuous ASL (pCASL) is based on two image acquisitions, i.e. a “label” with application of multiple inversion pulses and a “control” with the same pulses but without net inversion. This signal difference of blood forms the base of ASL perfusion imaging. This alteration is only on the scale of 1-2% during image acquisition [2]. However, this might be enough to change the outcome of the independent component analysis (ICA) and in further consequence lead to misinterpretation of the results. This study aims to investigate this effect.Materials and Methods
The patient population consisted of 15 patients (4 women, 11 men, mean age 51.4 years) suffering from Glioblastoma Multiforme (GBM). The patient collective underwent pre- intra- and postoperative ASL MRI. More details about the population can be found in [2]. In this study, the intraoperative images have been used exclusively as the patients were anesthetized eliminating any movement during scanning. All scans were acquired on a 1.5T scanner (Philips Intera, Philips Healthcare, Best, The Netherlands) using a two 1-channel loop coils. The study was approved by the local ethics committee. The pCASL scan parameters included: 1800ms labeling duration and post labeling delay, 2D multislice EPI scanning with 3.6x3.5x5mm³ resolution, TR/TE: 2616/13ms, 40 label/control pairs. These were separated in 40 label and 40 control images for post-processing. This was performed using the MELODIC toolbox of FSL (FMRIB, Oxford, UK) as described in [1].Results and Discussion
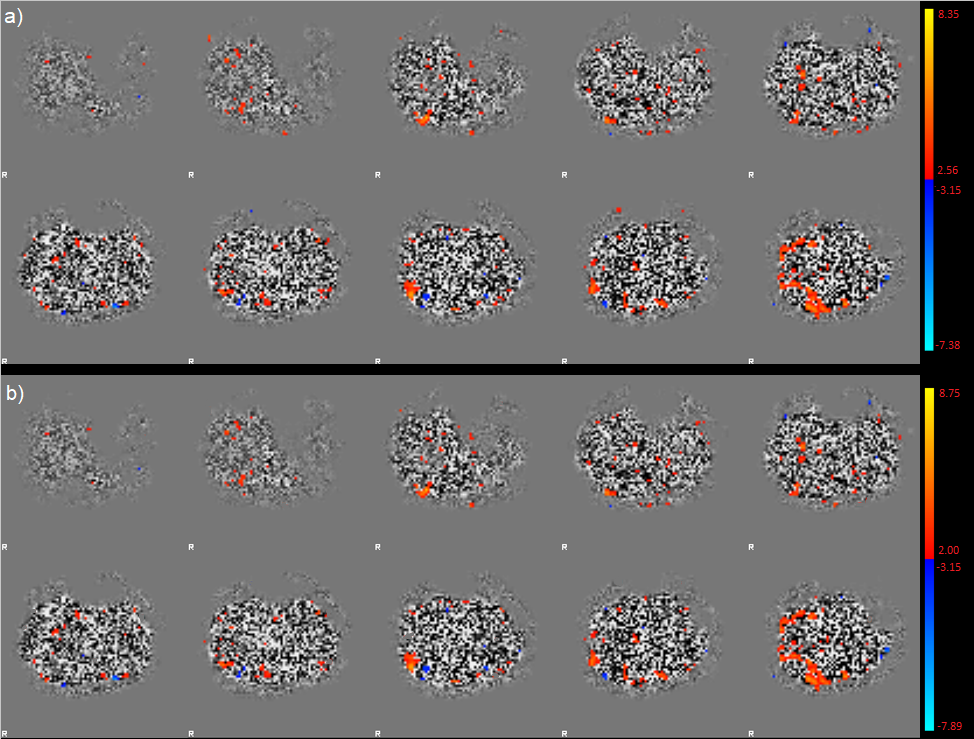
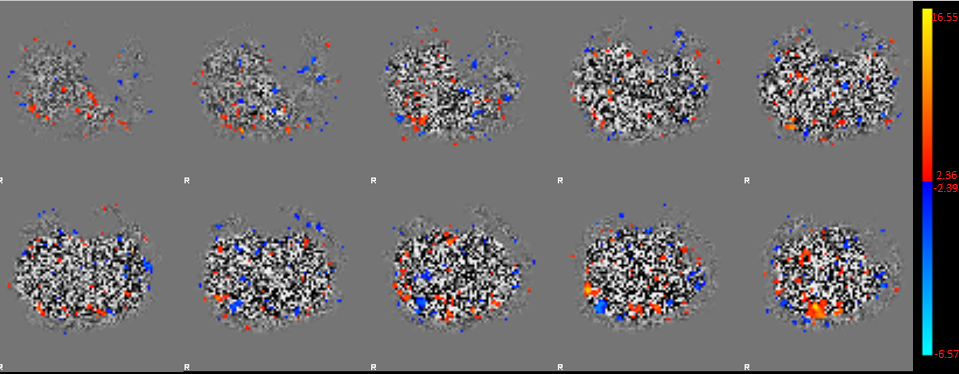
The results from post-processing of the individual label and control datasets show only subtle differences which can be attributed to noise. The ICA shows the same activation patterns with no differences in their size or location. There are only faint differences in intensity (see colorbars in figure 1). An example of the same 10 slices of control (a) and label (b) of one example patient are shown in figure 1. The signal that could be obtained by the separated datasets is smaller than in the full dataset taking both, label and control pairs into account (Figure 2).Conclusion
Using pCASL to identify resting state networks by ICA does not appear to be influenced by the differences of the tagging pulses in the label and control condition. Therefore, all the acquired data can be used for post-processing which in further consequence increases the statistical power of the results and leads to more clear definition of activation areas.Acknowledgements
No acknowledgement found.References
[1] Chen JJ, Jann K, Wang DJ. Characterizing Resting-State Brain Function Using Arterial Spin Labeling. Brain Connect. 2015;5(9):527-542. doi:10.1089/brain.2015.0344
[2] Alsop DC, Detre JA, Golay X, et al. Recommended implementation of arterial spin-labeled perfusion MRI for clinical applications: A consensus of the ISMRM perfusion study group and the European consortium for ASL in dementia. Magn Reson Med. 2015;73(1):102-116. doi:10.1002/mrm.25197
[3] Lindner T, Ahmeti H, Juhasz J, et al. A comparison of arterial spin labeling and dynamic susceptibility perfusion imaging for resection control in glioblastoma surgery. Oncotarget. 2018;9(26):18570-18577. Published 2018 Apr 6. doi:10.18632/oncotarget.24970
Figures