3388
Functional MRI of the excitatory and inhibitory neuromodulations by transcranial magnetic stimulation at the human sensorimotor cortex
Hsin-Ju Lee1,2, Mikko Nyrhinen3, Risto J. Ilmoniemi3, and Fa-Hsuan Lin1,2,3
1Physical Sciences Platform, Sunnybrook Research Institute, Toronto, ON, Canada, 2Department of Medical Biophysics, University of Toronto, Toronto, ON, Canada, 3Department of Neuroscience and Biomedical Engineering, Aalto University, Espoo, Finland
1Physical Sciences Platform, Sunnybrook Research Institute, Toronto, ON, Canada, 2Department of Medical Biophysics, University of Toronto, Toronto, ON, Canada, 3Department of Neuroscience and Biomedical Engineering, Aalto University, Espoo, Finland
Synopsis
We measured fMRI signals in response to excitatory and inhibitory TMS modulations over the human primary motor cortex (M1) with TMS bursts of high (10- and 30-Hz) and low frequency (0.5-Hz) with a controlled TMS dosage over the 30-s interval, respectively. Excitatory and inhibitory modulations were evidenced by motor evoked potential changes. Significantly increased fMRI signal at M1 was only detected under excitatory high-frequency TMS but not during inhibitory low-frequency TMS. The supplementary motor area (SMA) had significant fMRI signal changes after both kinds of TMS. The topology of the activated M1 and SMA matched those during the voluntary movement.
INTRODUCTION
Transcranial magnetic stimulation (TMS) can non-invasively deliver excitatory and inhibitory modulations. 1 Specifically, delivering TMS pulses over the primary motor cortex (M1) at rates lower than 1 Hz causes an inhibitory modulation on the motor evoked potentials (MEP), 2 while TMS pulses delivered at faster rates (≥ 5 Hz) excite the targeted cortical area to increase the MEP amplitude. 3 Pilot studies have revealed the relationship between functional magnetic resonance imaging (fMRI) signals and TMS intensities. 4-6 However, how the fMRI signal changes between excitatory and inhibitory TMS modulations remains unknown. Here, we study fMRI signal changes elicited by TMS pulses delivered at frequencies of 0.5, 10, and 30 Hz.METHODS
Nine healthy subjects (four females; age: 30 ± 5 years) joined the experiments after giving a written informed consent approved by the ethics committee of Aalto University. All measurements were performed on a 3T MRI scanner (Skyra, Siemens, Germany). Figure 1a shows the TMS pulse schedule and EPI acquisitions, where images (TR = 2 s, TE = 26 ms, flip angle = 90°, 14 slices, 2-mm isotropic resolution) were prescribed to cover the left M1 using a customized 8-channel head coil array 6 integrated with an MRI-compatible TMS coil (MRi-B91, MagVenture, Denmark) connected to a stimulator system (MagPro X100, Magventure, Denmark). Each run consisted of 155 volumes starting with a 10-s “off” (without TMS delivery) followed by five alternating 30-s “on” (with TMS delivery) and 30-s “off” blocks. In each TMS block, 15 pulses in total were delivered in order to control the TMS dose. Five conditions of TMS pulse delivery with 100% of the individual's rest motor threshold were randomly administered: “0.5-Hz”, where TMS pulses were equally separated by 2 s; “10-Hz-3-pulses per burst (ppb)”, where TMS pulses were delivered in five bursts with three pulses with 0.1-s inter-pulse interval (ipi) and 6-s inter-burst interval (ibi); “10-Hz–5-ppb”, where TMS pulses were delivered in three bursts with five pulses with 0.1-s ipi and 10-s ibi; “30-Hz–3-ppb”, where TMS pulses were delivered in five bursts with three pulses with 0.033-s ipi and 6-s ibi; “30-Hz–5-ppb”, where TMS pulses were delivered in three bursts with five pulses with 0.033-s ipi and 10-s ibi. Within each TR (2 s), the acquisition of each MRI volume was completed between 0 and 1 s after the onset of each volumetric acquisition, whereas TMS pulses were delivered between 1 and 1.9 s. Figure 1b shows the timing diagram of these TMS conditions. MEP was taken for each participant inside the MRI before and during TMS modulation. We separately measured fMRI of a finger-tapping task (EPI: TR = 2 s, TE = 29 ms, flip angle = 30°, 33 slices, 3.3-mm isotropic resolution) to localize the sensorimotor network. We also took an anatomical scan (MPRAGE: TR = 2530 ms, TE = 3.3 ms, 176 slices, 1-mm isotropic resolution) for every participant.Image pre-processing was performed using SPM12, including slice-timing correction, motion correction, coregistration between functional and anatomical data, spatial normalization to the MNI space, and spatial smoothing. The pre-processed datasets were then analyzed using the General Linear Model (GLM). The significance of the brain activity elicited by TMS was derived from a t-test on the GLM effect estimates across participants. The statistical significance was corrected for multiple comparison by using a false discovery rate-adjusted p < .05.
RESULTS
None of the participants reported adverse effects. Relative to the MEP in the baseline condition, the MEP was increased and descreased in the HF and LF conditions, respectively (Figure 2). Figure 3 shows significant fMRI responses to different TMS. Significantly increased fMRI signal at the sensorimotor cortex (SMC) ipsilateral to the TMS target locus was only detected under excitatory TMS but not during inhibitory TMS. The supplementary motor cortex (SMA) had significant fMRI signal changes in the 10-Hz–5-ppb, 30-Hz–3-ppb, and 30-Hz–5-ppb conditions. Figure 4 shows the fMRI signal changes at SMC and SMA defined by the finger-tapping task. The SMC had significantly larger fMRI signal in all excitatory TMS than that in the inhibitory TMS (p = .04). The fMRI signal at the SMC in the inhibitory TMS was not significantly from that without TMS delivery (p = .67). At the SMA, the fMRI signal in the 30-Hz–3-ppb condition significantly larger than that in the LF condition (p = .01).DISCUSSION
We reported how fMRI signals change during inhibitory and excitatory TMS modulations supported by MEP changes. The topology of the activated M1 and SMA elicited by TMS matched the network during voluntary movements. However, the excitatory and inhibitory TMS caused different activity patterns at the SMC and SMA. The SMA showed significant fMRI signal changes after both inhibitory and excitatory TMS, whereas the SMC, the vicinity around TMS target site, had significant fMRI signal only after the excitatory TMS. The insignificant fMRI signal changes at SMC after the inhibitory TMS can be explained by the reduction of the summed synaptic activity 8 and the relative less inhibitory synapses 9-11. Therefore, inhibitory modulation may be less likely to elicit fMRI signal changes than excitatory modulation,12 corroborating the findings of insignificant fMRI signal changes with TMS frequency lower than 1-Hz. 5, 6Acknowledgements
This work was partially supported by the Academy of Finland (No. 298131), and the Natural Sciences and Engineering Research Council of Canada (RGPIN-2020-05927).References
- Barker AT, Jalinous R, Freeston IL. The Lancet. 1985;325(8437):1106-7.
- Chen R, Classen J, Gerloff C, et al. Neurology. 1997;48(5):1398-403.
- Pascual-Leone A, Valls-Solé J, Wassermann EM, et al. Brain. 1994;117(4):847-58.
- Hanakawa T, Mima T, Matsumoto R, et al. Cerebral Cortex. 2009;19(11):2605-15.
- Bestmann S, Baudewig J, Siebner HR, et al. Neuroimage. 2003;20(3):1685-96.
- Bestmann S, Baudewig J, Siebner HR, et al. European Journal of Neuroscience. 2004;19(7):1950-62.
- Wu P, Chu Y, Nummenmaa A, et al. Proceedings of the 23rd Annual Meeting of ISMRM, Toronto, Canada. 2015:605.
- Murphy SC, Palmer LM, Nyffeler T, et al. Elife. 2016;5:e13598.
- Beaulieu C, Colonnier M. Journal of Comparative Neurology. 1985;231(2):180-9.
- DeFelipe J, Farinas I. Progress in neurobiology. 1992;39(6):563-607.
- Koós T, Tepper JM. Nature neuroscience. 1999;2(5):467-72.
- Waldvogel D, van Gelderen P, Muellbacher W, et al. Nature. 2000;406(6799):995-8.
Figures
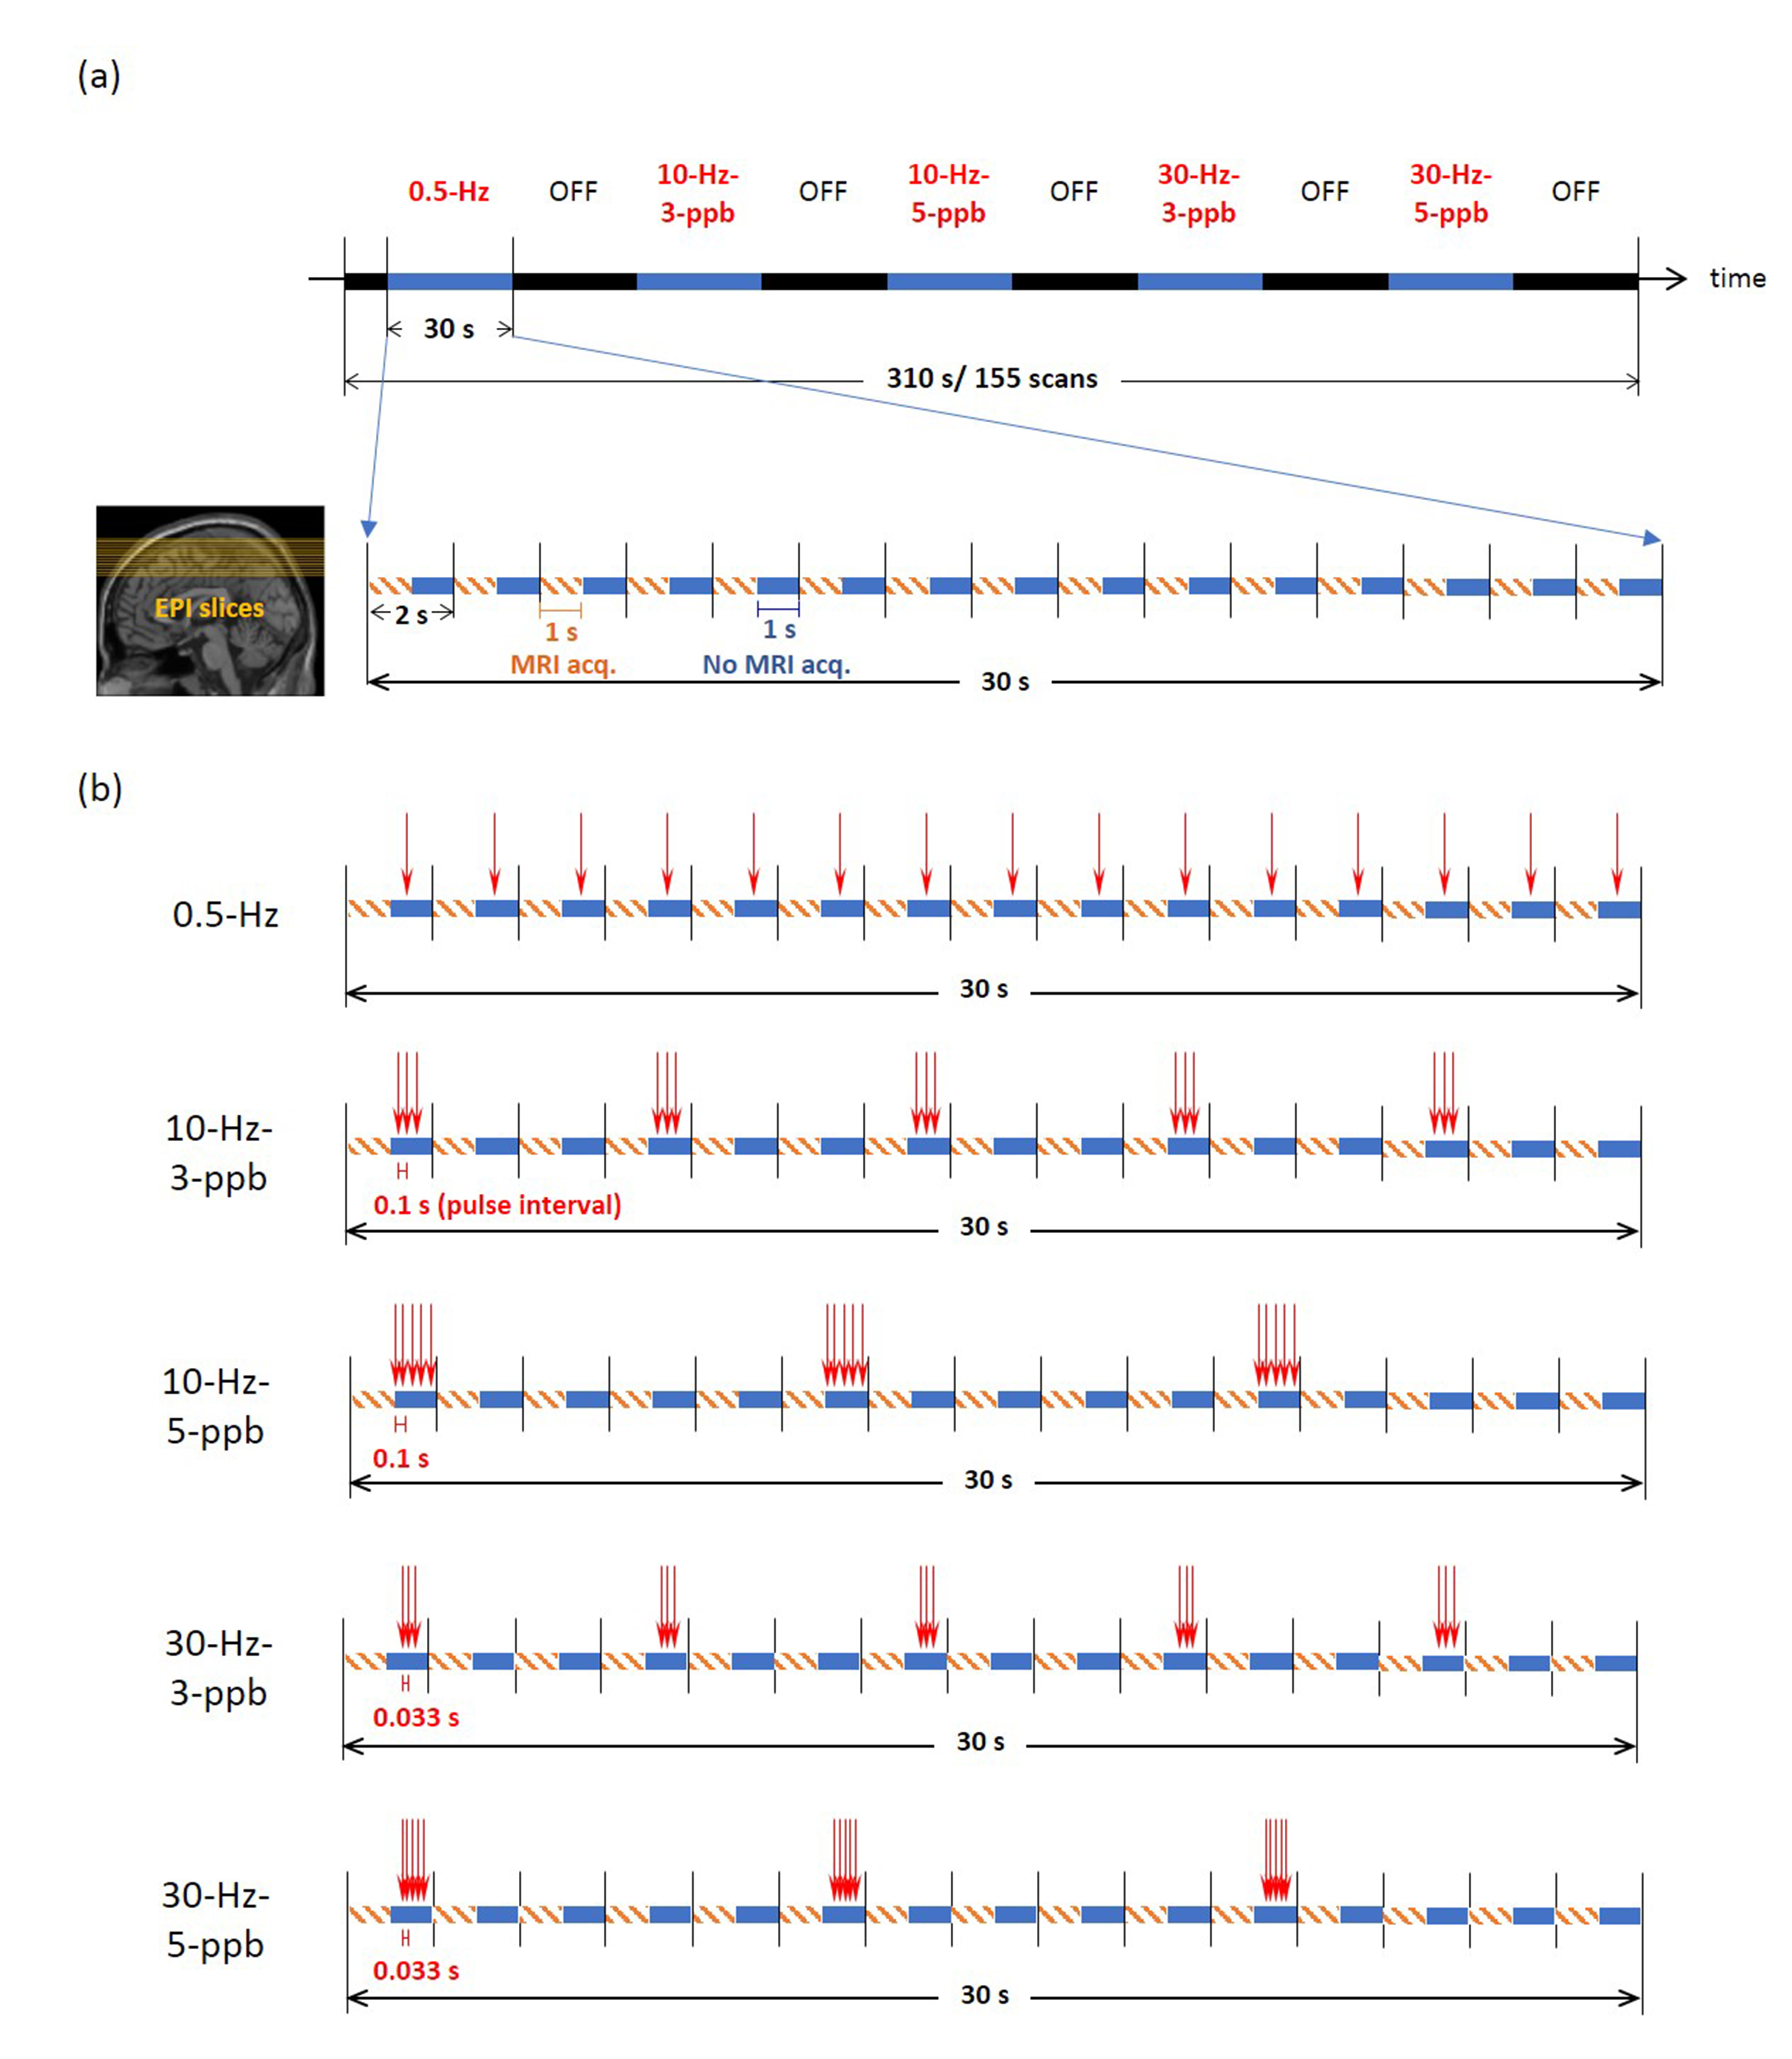
Figure 1. Illustration of TMS pulse schedule and EPI
acquisitions. (a) Each fMRI run lasted 310 s and started with 10-s "off"
(black, without TMS delivery) followed by five alternating 30-s “on” (blue, with TMS) and
30-s "off" blocks. Five different types of "on" stimuli
were administered. Within each TR, the acquisition of each MRI volume was
completed between 0 and 1 s after the onset of each volumetric acquisition
(orange dashed line), whereas TMS pulses were delivered between 1 and 1.9 s
during the MRI quiet period (blue). (b) In each TMS block, a total of 15 TMS
pulses were delivered.
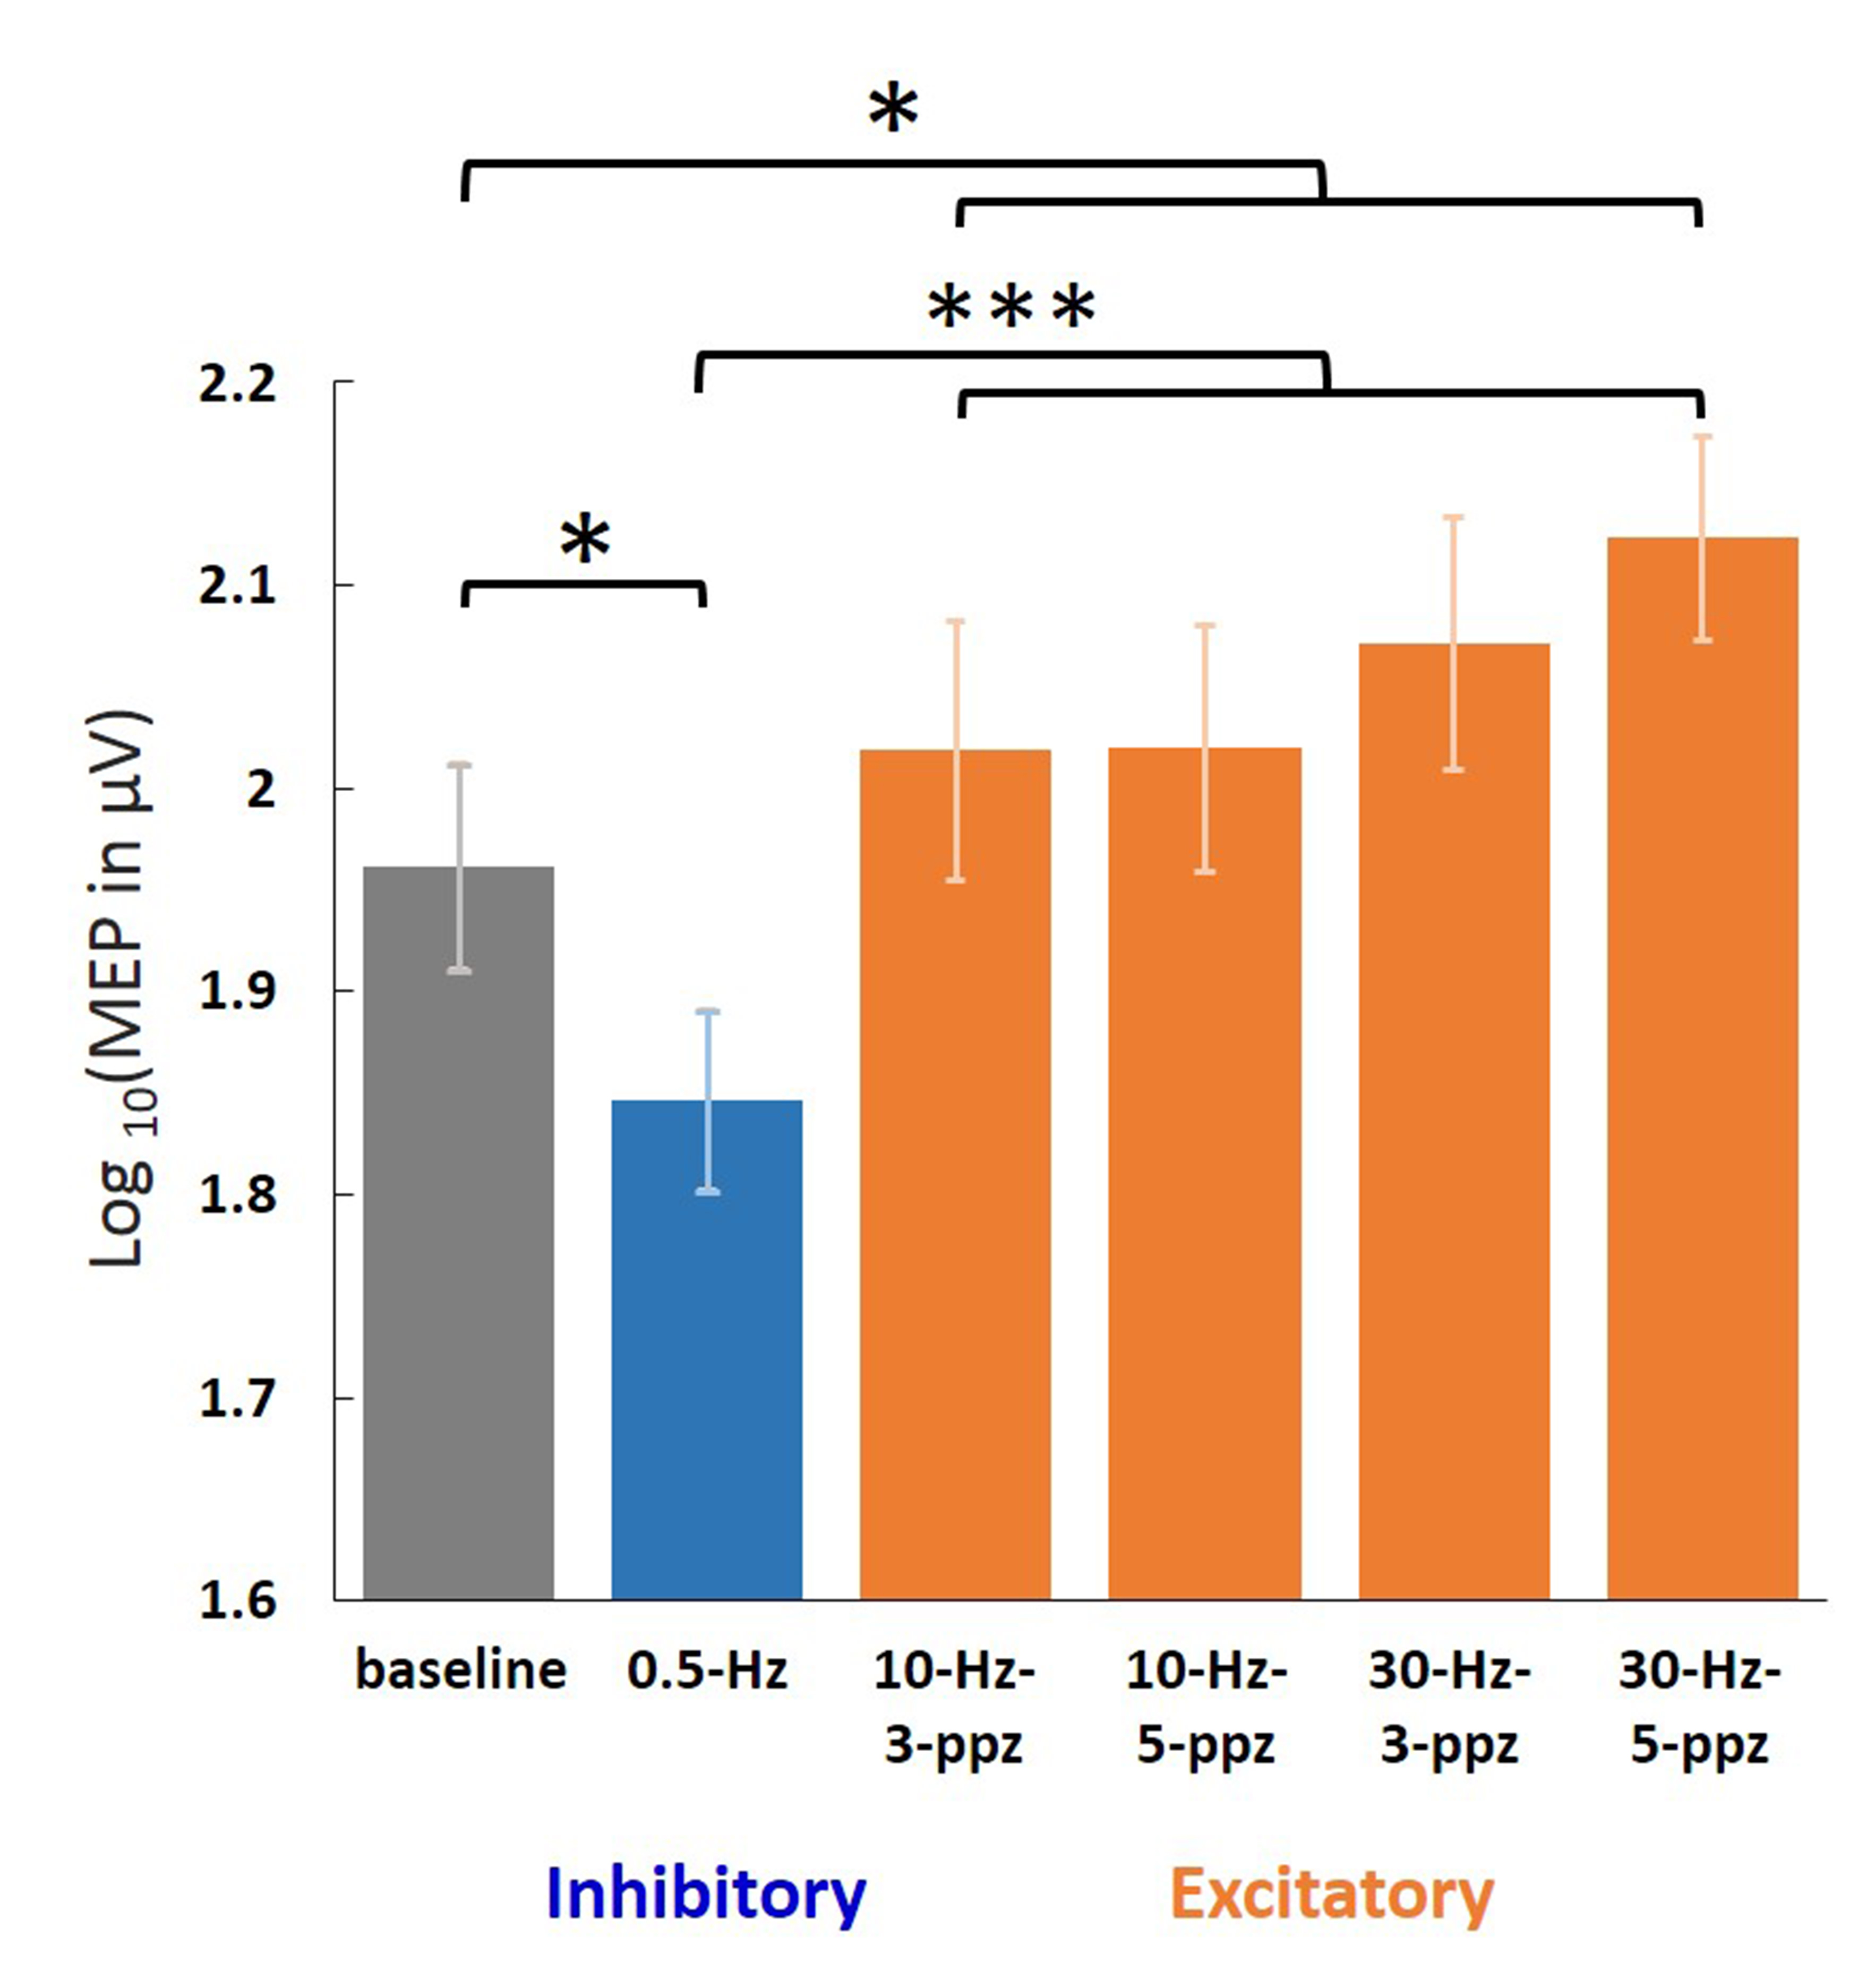
Figure 2. Log-transformed MEP amplitudes in the baseline
and in the individual TMS conditions. Significant MEPs were detected in all
conditions. The log-transformed MEP amplitude in the LF condition was
significantly smaller than in the baseline and HF conditions. In contrast, the
log-transformed MEP amplitude in the HF condition was significantly larger than
in the baseline. Error bars denote standard errors of the mean (SEM). *: p <
.05. ***: p < .001.
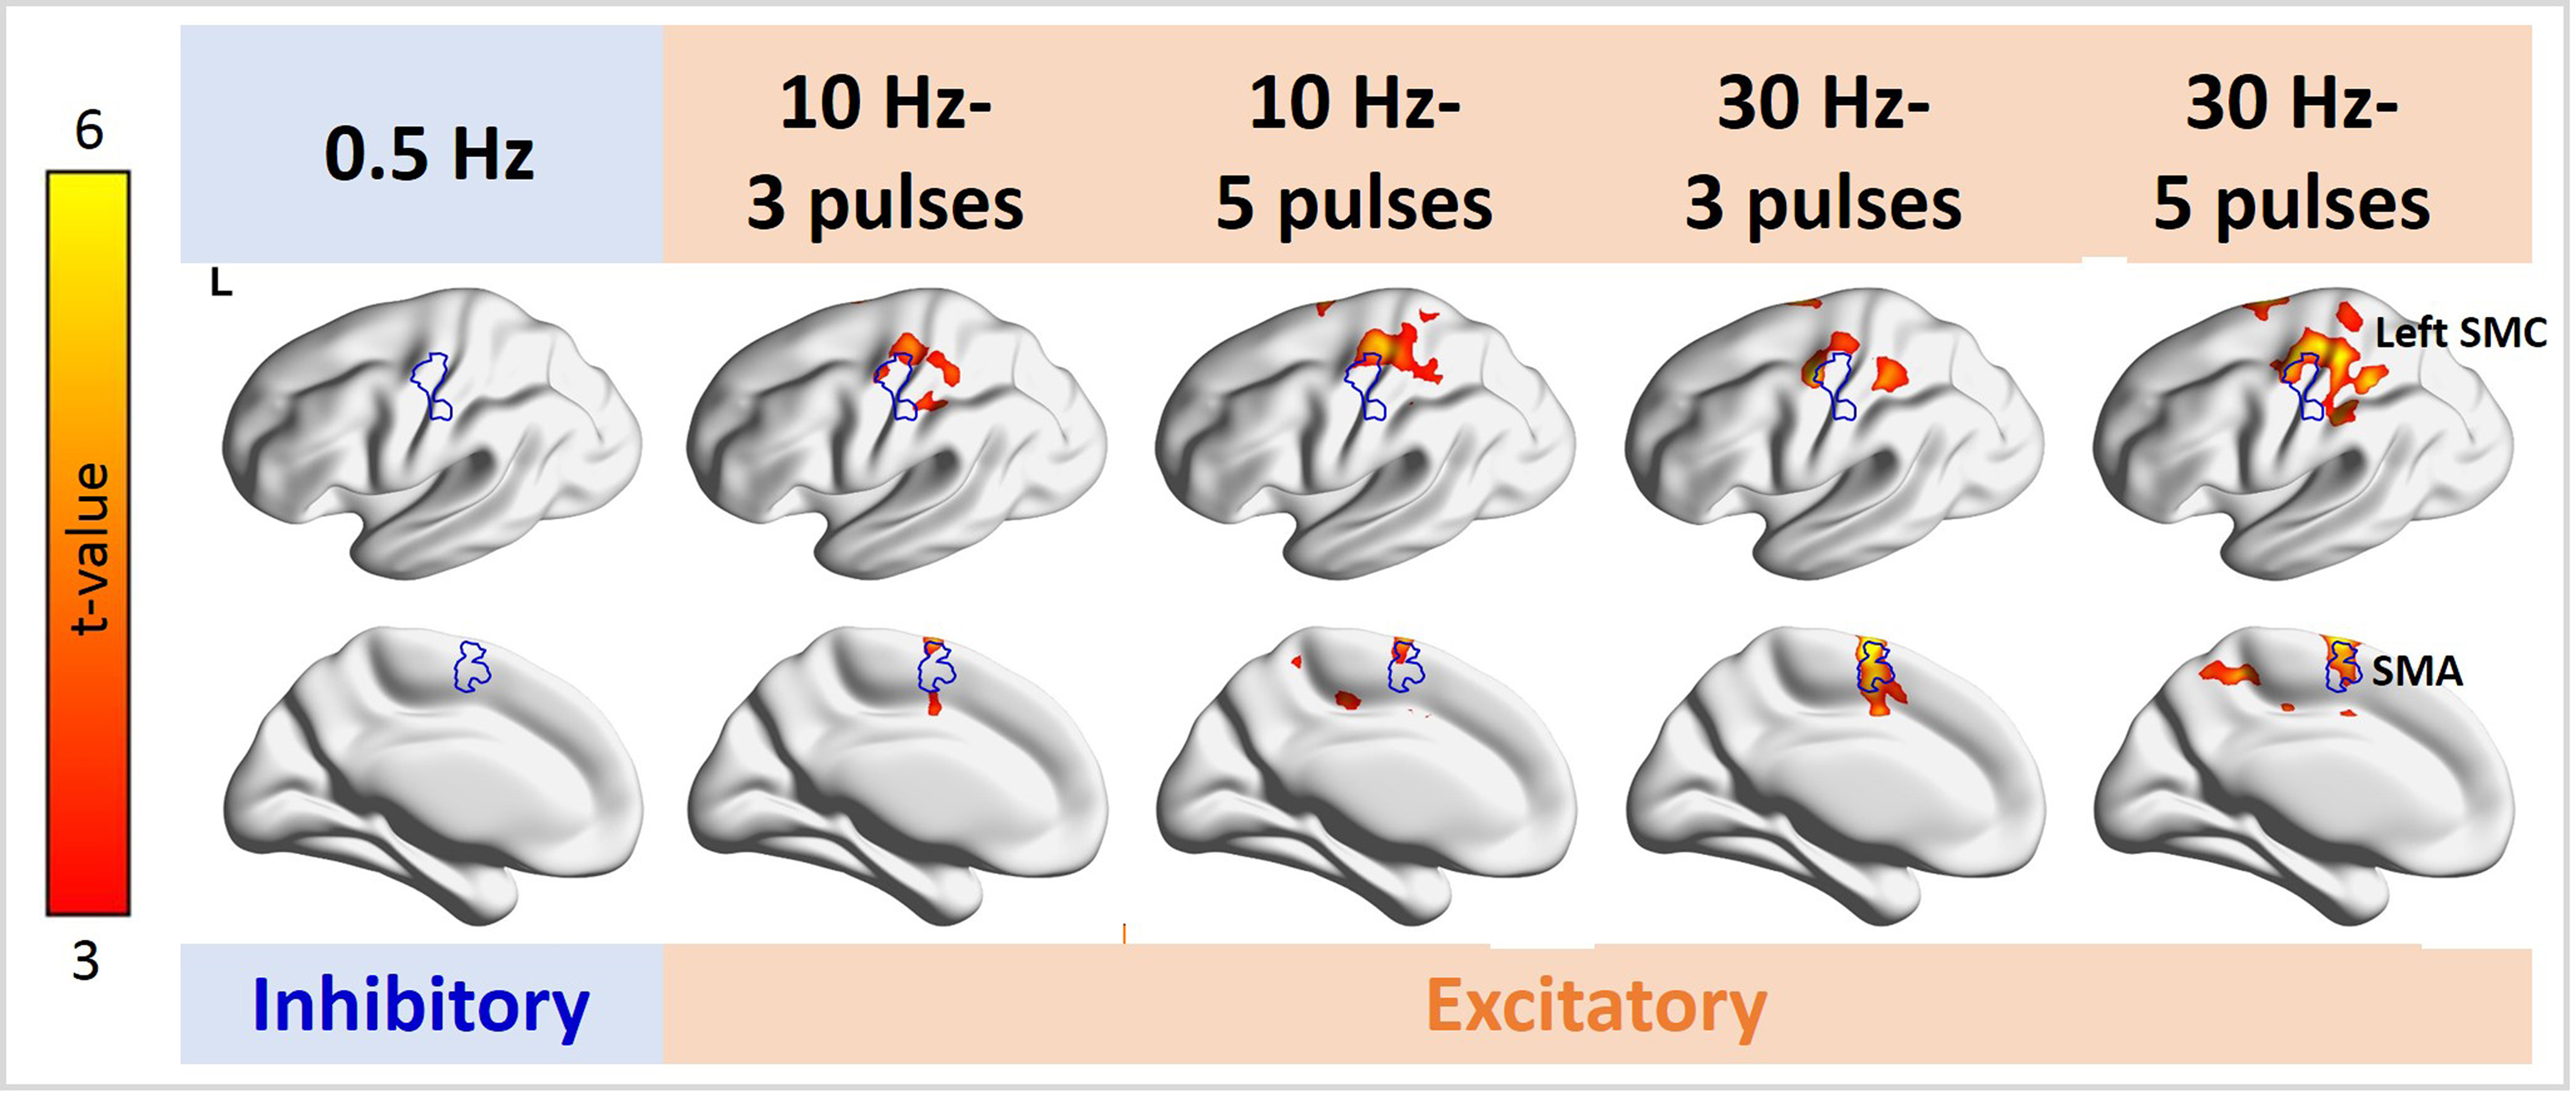
Figure 3. Distributions of significant fMRI signal changes in the individual TMS conditions. Positive fMRI signals were found at the SMC ipsilateral to the TMS target locus in all 10- and 30-Hz conditions, but not in the 0.5-Hz condition. The fMRI signal in the SMA was significantly increased in the 10-Hz–5-ppb, 30-Hz–3-ppb, and 30-Hz–5-ppb conditions.
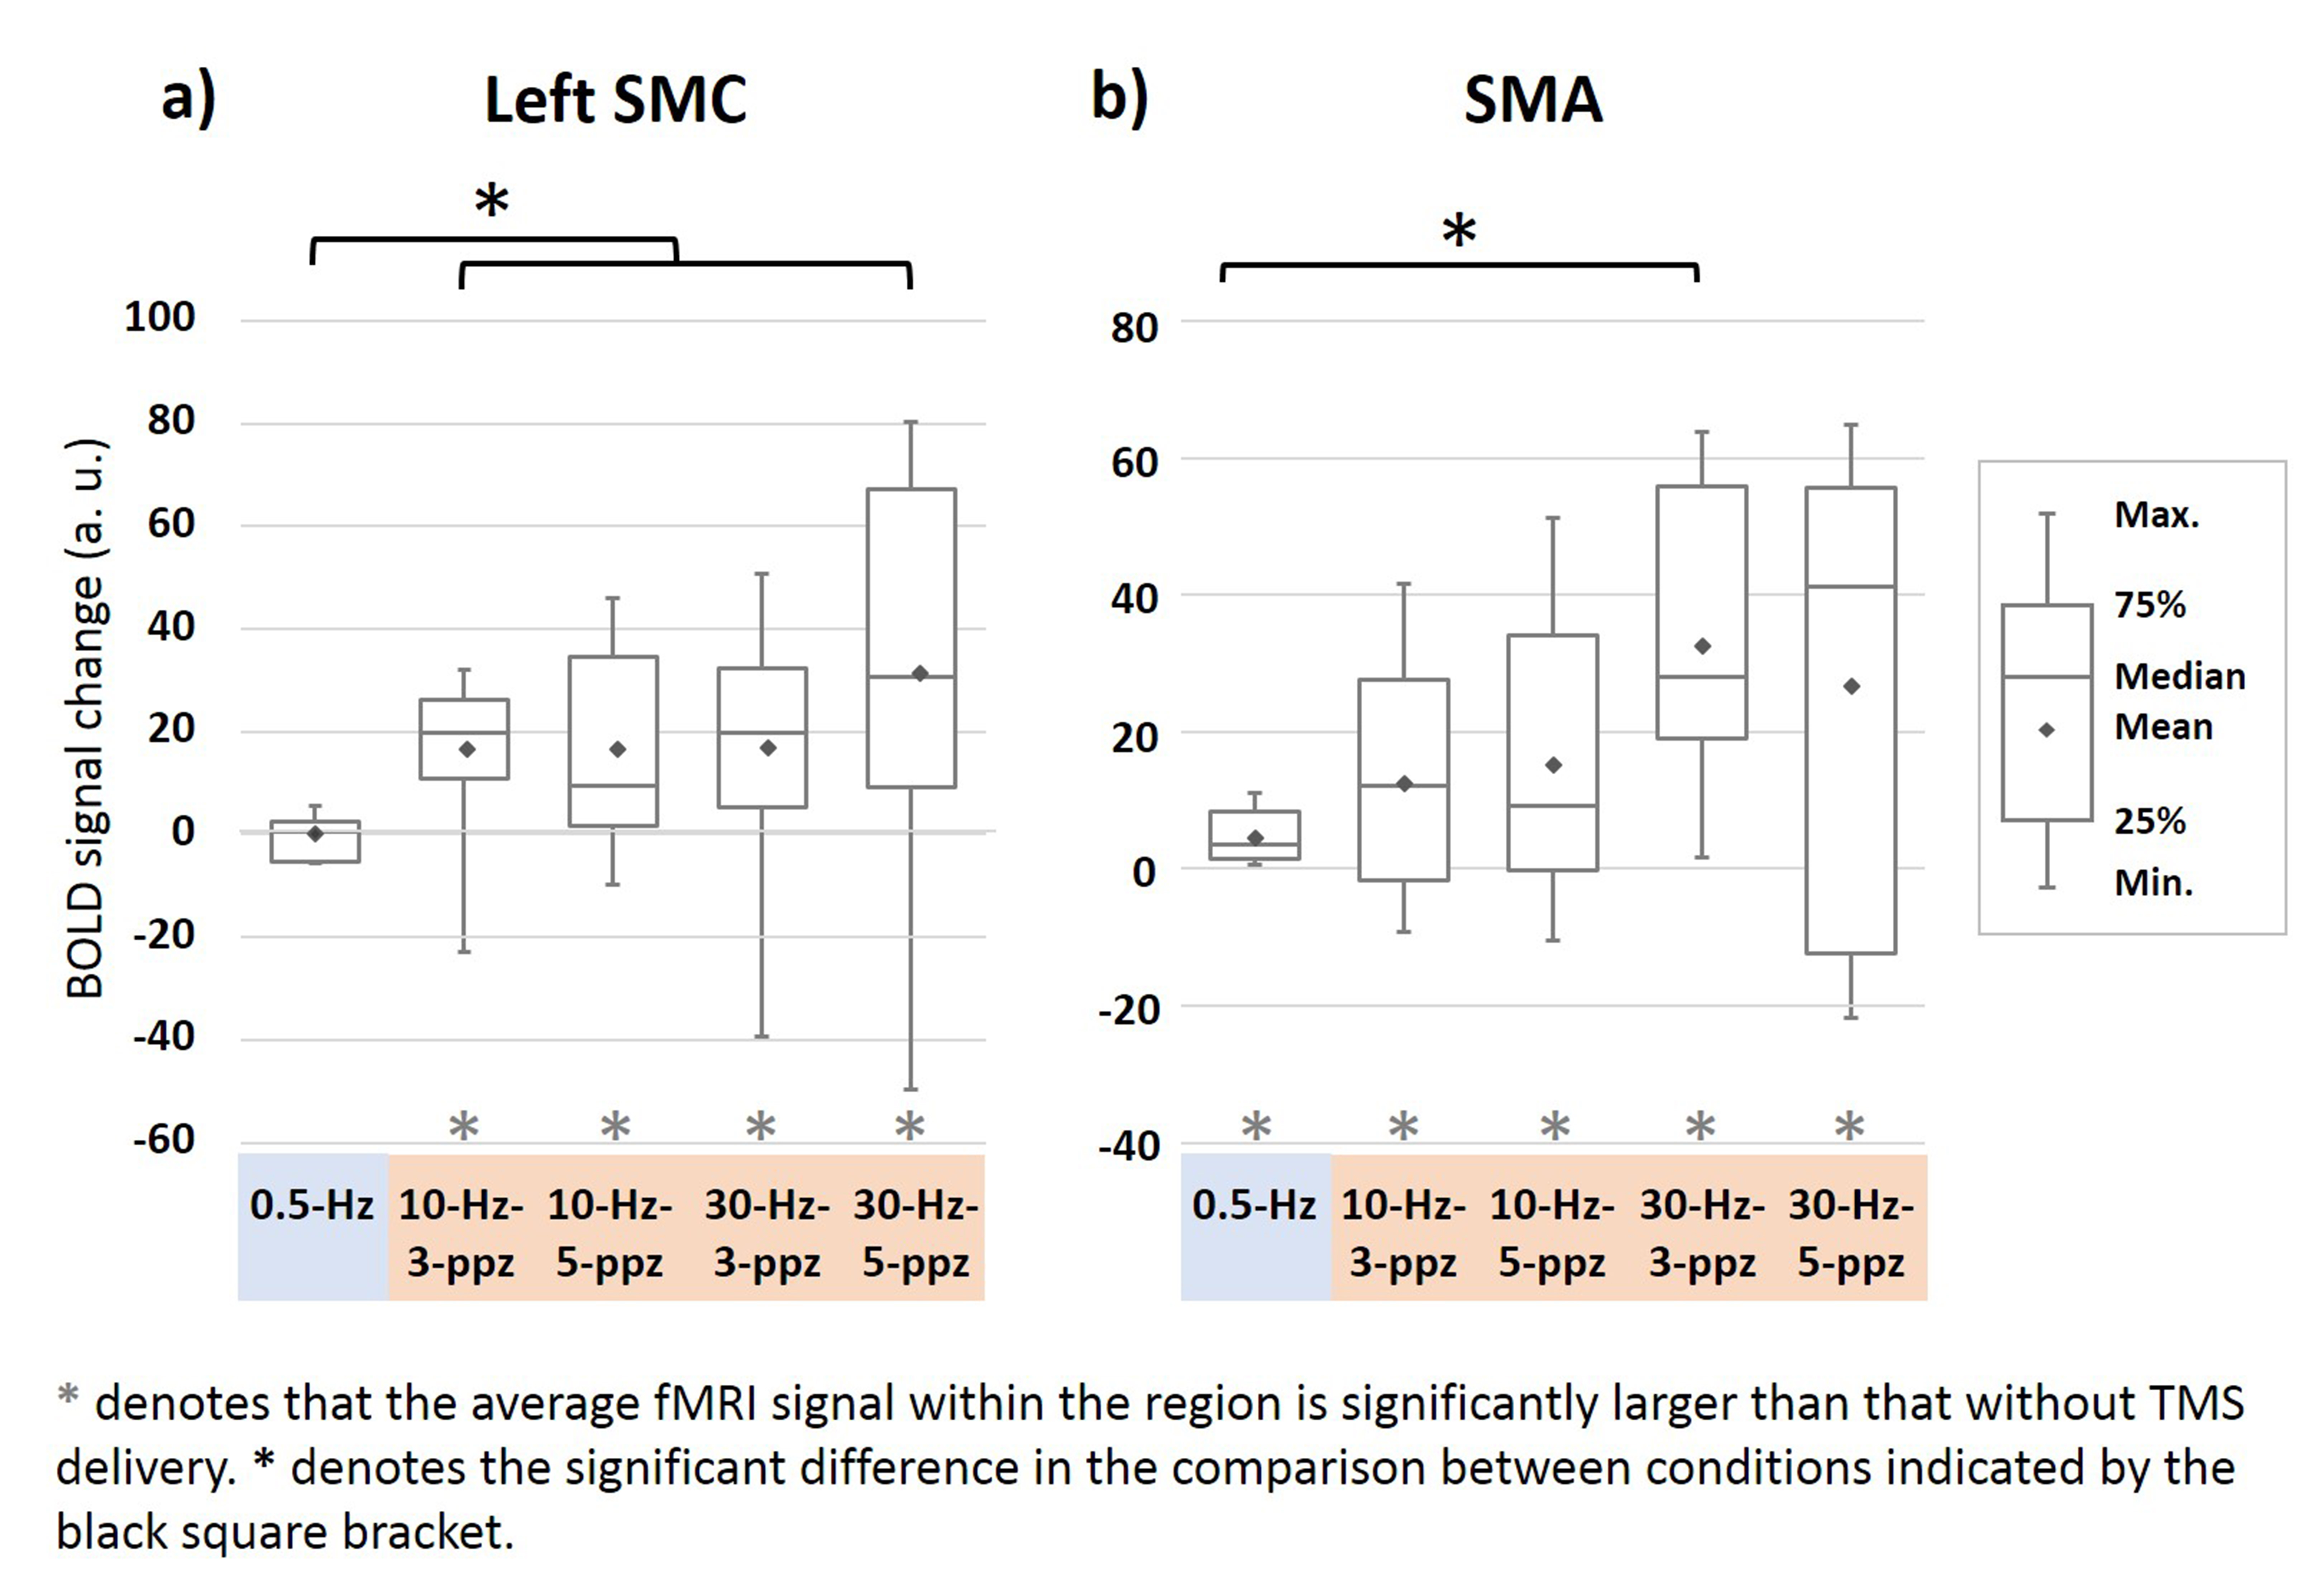
Figure 4. Functional MRI signal changes at the left SMC (a) and SMA
(b). (a) At the SMC, positive fMRI signals were found in each 10- and 30-Hz
condition. The fMRI signal in the 0.5-Hz TMS was not significantly different
from that without TMS. The fMRI signal at SMC by excitatory TMS was larger than
that by inhibitory TMS. (b) The fMRI signals at the SMA were significantly
increased in all TMS conditions. Significantly increased fMRI signals at SMA were
found between 30-Hz–3-ppb and 0.5-Hz TMS conditions.