3387
Closed-Loop tACS-fMRI: Online Optimization of tACS Stimulation to Enhance Fronto-parietal Connectivity
Beni Mulyana1,2, Aki Tsuchiyagaito1, Jared Smith1, Masaya Misaki1, Samuel Cheng2, Martin Paulus1, Hamed Ekhtiari1, and Jerzy Bodurka1
1Laureate Institute for Brain Research, Tulsa, OK, United States, 2Electrical and Computer Engineering, University of Oklahoma, Tulsa, OK, United States
1Laureate Institute for Brain Research, Tulsa, OK, United States, 2Electrical and Computer Engineering, University of Oklahoma, Tulsa, OK, United States
Synopsis
We designed a closed-loop concurrent transcranial alternating current stimulation and functional MRI (tACS-fMRI) to optimize fronto-parietal fMRI connectivity. Capacity for modulating fMRI connectivity are highly dependent on the transcranial electric stimulation (tES) parameters such as electric current frequency and phase. We proposed closed-loop tACS-fMRI optimization to search and find the tACS parameters resulting in the highest frontoparietal connectivity. Comparing to control group, experimental group shows an increased task-related frontoparietal functional connectivity (FC) during the training runs. The improvements in working memory was observed in participants in experimental tACS group (testing vs baseline run, 2-back task).
INTRODUCTION
tACS provides electric current stimulation over the scalp to modulate specific brain regions or functional connectivity (FC)1. Concurrent fMRI and tACS can measure activations in the areas beneath the electrodes2. Selection of the frequency and phase for the tACS stimulation influences capacity to modulate functional connectivity3. We aim to: (1) find the optimal frequency and phase for tACS stimulation that results in the highest frontoparietal FC; (2) examine in a working memory fMRI task whether the optimized tACS stimulation would improve frontoparietal connectivity and cognitive function compared to control parameters.METHOD
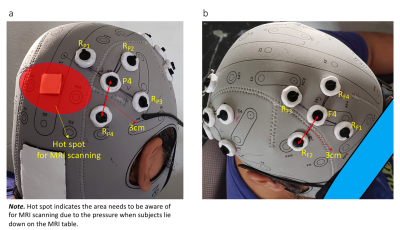
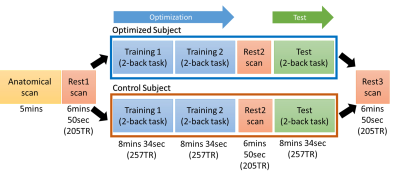
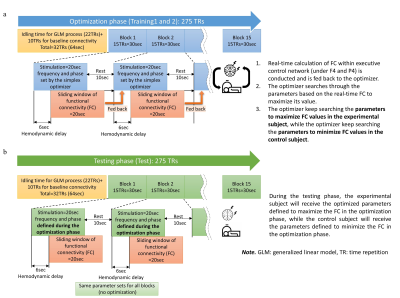
Eleven healthy participants (Female=8; Age=20-53 years) underwent the closed-loop tACS-fMRI targeting frontoparietal synchronization (FPS). 3T MRI scanner (Discovery MR750; GE Healthcare Systems, Milwaukee, WI) with the 8-channel receive-only head coil was used for fMRI; tACS was provided with (Starstim R32; Neuroelectrics Barcelona SLU; Spain). fMRI parameters were: FOV/slice thickness = 240/2.9mm, matrix=96×96, 39 axial slices,TR/TE=2000/27ms. FPS targets: the right middle frontal gyrus and right inferior parietal cortex; nodes of the frontoparietal network, approximated by electrode positions F4 and P4 of the 10-20 EEG system. we modified of MRI Sponstim (model: NE026MRI, brand: Neuroelectrics) electrode that is placed inside next generation (NG) Pistim's shell (model:NE029; Neuroelectrics, the metal part (Ag/AgCl) removed). This modification creates an MR conditional electrode (circular pad r = 1cm with carbon rubber as electrode pad). Conductive gel/paste (model: Abralyt HiCl, brand:Easycap) was used to improve contact conductivity between the scalp and the carbon rubber pad. We use head caps with holes indicating electrode positioning places (model: Neoprene Headcap/ NE019, brand: Neuroelectrics). The coordinates of the region of interests (ROIs) were assigned by the highest electric field on frontal and parietal montage sites using SimNIBS simulation under F4 and P4 electrodes4,5. ROIs: in frontal site (MNI F4 coordinates= [-45, 49, 27], 10mm radius) and in parietal site (MNI P4 coordinates= [-45, -75, 46], 10mm radius). The current of the center electrode at F4 and P4 were assigned constant 1mA current. Return-electrode for each site is four electrodes with the current on return-electrode 0.25mA. Return-electrode coordinates for the F4 site are: RF1=[37.99, 75.64, 22.32], RF2=[67.91, 48.88, 25.73], RF3=[52.23, 35.78, 60.45], and RF4=[ 22.31, 62.54, 57.04], and for P4 site are:(RP1=[22.12, -60.72, 59.04], RP2=[50.21, -35.60, 62.24], RP3=[69.58, -43.35, 30.70], and RP4=[48.22, -71.16, 16.55] in the position coordinates of the standard BioSemi head caps with circumference=550mm6. Figures 1a,1b show a montage of 10 high-definition electrodes for frontal and parietal sites. Participants underwent online FPS with tACS-fMRI, with study design shown on Figure 2. Protocol includes an anatomical scan, resting scans, a 2-back tasks and training scans with a 2-back tasks (Training 1, and 2 in optimization part), and testing the optimal or control parameters with a 2-back task (Testing), and 3rd resting scan. During the Training phase participants are divided into two groups (see Fig.2 captions). The training run is divided into 15 blocks (Figure 3a) where each block consists of 20 seconds tACS with parameters (frequency and phase) derived from the Simplex optimizer rules. This is followed by 10 seconds of rest. During each block, the Simplex optimizer searches the optimized parameter of the combination of frequency and phase from the parameters' field (range frequency:1-150Hz, and phase:0–359o) based on the fMRI frontoparietal FC measurements. The initial Simplex parameter is placed around of the highest frontoparietal connectivity7, which is in the center of theta band (6Hz) and phase difference = 0o to make it easier to find the highest frontoparietal FC. The edges of the initial Simplex parameter (equilateral triangle) are: (6Hz, 5o), (10Hz, -3o), and (2Hz, -3o). The sliding-window fMRI connectivity response is calculated in real-time and analyzed by the optimizer to predict what frequency and phase cause the highest increase or lowest decrease in frontoparietal FC. The testing run is similar to the training, which is divided into 15 blocks (Figure 3b). However, during the testing run, we do not use the optimizer to calculate optimized parameters but only use the optimized parameters obtained from Training 1,2.RESULTS
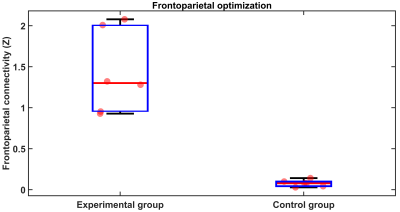
On the training 1,2 runs, the experimental and control groups' success to optimize the tACS parameters to get the highest or lowest frontoparietal connectivity (Figure 4). At the end of training 2, the experimental group vs. the control group has frontoparietal gap connectivity. On the testing-training1 average run (training1 as a baseline), the experimental group showed higher improvement of frontoparietal connectivity rather than control group (Figure 5a) [experimental group: mean=0.06, SD=0.09; control group: mean/SD=-0.1/0.06; t(9)=3.31, p=0.009]. Furthermore, within-group analysis of the percentage of 2-back task average (testing-training1), the experimental group improves accuracy to answer correctly rather than the control group [experimental group: mean/SD=6.02/3.96; control group: mean/SD=-2.41/7.95; t(9)=2.30, p=0.047] (Figure 5b).DISCUSSION and CONCLUSION
The closed-loop tACS-fMRI is feasible and can potentially find the optimal tACS parameters for modulating frontoparietal connectivity. The preliminary results show the optimized tACS parameters can enhance frontoparietal connectivity more in the active stimulation as compared to control. Furthermore, the optimized tACS parameters also improve working memory accuracy in the active stimulation compared to the control condition. This study supports the feasibility of concurrent tACS-fMRI and potentials for its efficacy.Acknowledgements
This work was supported by the Laureate Institute for Brain Research.References
- Bikson M, Esmaeilpour Z, Adair D, et al. Transcranial electrical stimulation nomenclature. Brain Stimul. 2019. doi:10.1016/j.brs.2019.07.010
- Brandt SA, Davis TL, Obrig H, et al. Functional magnetic resonance imaging shows localized brain activation during serial transcranial stimulation in man. Neuroreport. 1996. doi:10.1097/00001756-199602290-00013
- Antal A, Paulus W. Transcranial alternating current stimulation (tACS). Front Hum Neurosci. 2013. doi:10.3389/fnhum.2013.00317
- Saturnino G, Madsen K, Thielscher A. Efficient Electric Field Simulations for Transcranial Brain Stimulation. bioRxiv. 2019. doi:10.1101/541409
- Thielscher A, Antunes A, Saturnino GB. Field modeling for transcranial magnetic stimulation: A useful tool to understand the physiological effects of TMS? In: Proceedings of the Annual International Conference of the IEEE Engineering in Medicine and Biology Society, EMBS. ; 2015. doi:10.1109/EMBC.2015.7318340
- B.V. B. The position coordinates of the standard BioSemi headcaps. https://www.biosemi.com/download/Cap_coords_all.xls. https://www.biosemi.com/headcap.htm. Published 2020.
- Violante IR, Li LM, Carmichael DW, et al. Externally induced frontoparietal synchronization modulates network dynamics and enhances working memory performance. Elife. 2017. doi:10.7554/eLife.22001
Figures

a. Montage of 10 HD electrodes on the parietal site
with equidistant (3 cm) center and return electrodes. The red highlighted
area is a hot spot where we need to avoid placing the electrodes due to the
pressure when subjects lie down on the MRI table. b. Montage of 10 HD
electrodes on the frontal site with equidistant (3 cm) center and return
electrodes.

Overview of the closed-loop
tACS-fMRI-tACS runs. Training 1 and 2 on the experimental subject will find the
tACS parameters (frequency and phase) with the highest frontoparietal
connectivity. Otherwise, training 1 and 2 on the control subject will find the
tACS parameters (frequency and phase) with the lowest frontoparietal
connectivity.

Overview of the optimization approach. a. Training 1 and 2
runs to find optimal tACS parameters. b. Testing is to test the optimal
parameters which were found by training run.

The experimental group vs. the
control group result has a significant difference in frontoparietal
connectivity on the training run. It means the simplex optimizer at the end of
training runs can find the best tACS parameters to make the highest and lowest
frontoparietal connectivity on the experimental group and control group.

a. On testing – training1 average, The experimental group showed higher improvement of frontoparietal connectivity rather than control group [experimental group: mean=0.06, SD=0.09; control group: mean=-0.1, SD=0.06; t(9)=3.31, p=0.009]. b. On the same measurement (testing – training1 average), the experimental group showed higher improvement of 2-back task accuracy rather than control group [experimental group: mean=6.02, SD=3.96; control group: mean=-2.41, SD=7.95; t(9)=2.30, p=0.047].