3386
Evaluation of ECG-derived respiration signals in simultaneous EEG-fMRI acquisitions1ISR-Lisboa and Department of Bioengineering, Instituto Superior Técnico – Universidade de Lisboa, Lisbon, Portugal, 2Learning Health, Hospital da Luz, Lisbon, Portugal, 3Neurology Department, Hospital da Luz, Lisbon, Portugal
Synopsis
Physiological noise correction of the BOLD signal requires information concerning the cardiac and respiratory activity. For EEG-fMRI, the burden of performing extra recordings may be alleviated by retrieving an ECG-derived respiratory signal (EDR). This work aimed to evaluate different methods for EDR estimation and subsequent derivation of fMRI respiratory regressors, by comparison with the measured respiratory signal, for EEG-fMRI. The feasibility of EDR estimation was demonstrated, with KPCA and PCA methods achieving the best performance. Nevertheless, similarities between EDRs and respiration were not directly reflected by the regressors, and the impact of using EDR-based respiratory regressors should be further examined.
Introduction
The interpretation of BOLD-fMRI signals may be compromised by non-neuronal physiological processes, namely heartbeat and respiration1. Therefore, physiological noise correction based on the concurrently acquired cardiac and respiratory signals is often required. However, this is not always possible due to the additional experimental setup (e.g. using a photoplethysmography and a pneumatic belt)2. Simultaneous EEG-fMRI acquisitions inherently require the ECG for correction of the pulse artifact. Since ECG is modulated by respiration, a surrogate of respiratory fluctuations may be obtained by estimating an ECG-derived respiration signal (EDR)3, without needing additional equipment.Although EDR estimation has been explored for EEG-fMRI2, its validity in the MR environment has not been assessed. In fact, this is known to severely affect the ECG wave morphology4, potentially deteriorating EDRs compared with existing studies without MRI. Hence, we aim to evaluate the performance of different EDR estimation methods for EEG-fMRI, by comparing EDRs with a reference respiratory signal.
Methods
EEG-fMRI data was acquired from 5 episodic migraine patients without aura, in the interictal phase, while performing 6 tasks: “eegcalibration”, “facelocalizer”, “KDEF”, “mentalizing”, “nback” and “rest”. While the latter corresponds to resting-state (eyes open), the others involve an active participation of the patient, with varying degrees of intensity. fMRI was acquired on a 3T Siemens Vida with a 64-channel RF coil using 2D-EPI with TR/TE=1260/30ms in-plane GRAPPA-2, SMS-3, 60 slices, 2.2mm isotropic resolution. Respiratory signal was acquired at 400Hz using the integrated BioMatrix Sensors. ECG was acquired as part of the 32-channels MR-compatible EEG system (Brain Products), at 1000Hz. The median duration of the recordings was 283.65s (range: 101-286.7s).Gradient artifact correction of the ECG was performed5, followed by downsampling to 250Hz and bandpass filtering to 0.5-40Hz. EDRs were extracted using the following methods2, grouped into 7 categories: ECG envelope (ENV), heart-rate variability (HRV), amplitude modulation (AM), QRS area modulation (QRS-AM), principal component analysis (PCA), kernel principal component analysis (kPCA), and empirical mode decomposition (EMD). For some categories, several EDRs were obtained (e.g. variations relying on different ECG features), thus resulting in a total of 51 EDR methods.
To evaluate the performance of each EDR method, we computed similarity metrics6,7 (after normalization and downsampling to 10Hz), between each EDR and the measured respiration signal (Resp): correlation (maximum cross-correlation over a lag of 1s to consider phase delays); and coherence (magnitude squared coherence computed using Welch's method for the spectra), averaged over a band around the respiratory frequency). The performance of the EDR methods was compared using the non-parametric Durbin test for two-way repeated measures (using the task and EDR method as within-subjects factors) for each metric.
To explore the impact on fMRI physiological noise correction, respiratory nuisance regressors were obtained: RETROICOR respiratory terms up to the 2nd order8, 9 and respiratory volume per time (RVT)10. The similarity between the regressors obtained from EDR and Resp was assessed using the correlation coefficient (zero lag). Statistical analyses were performed using JASP11.
Results
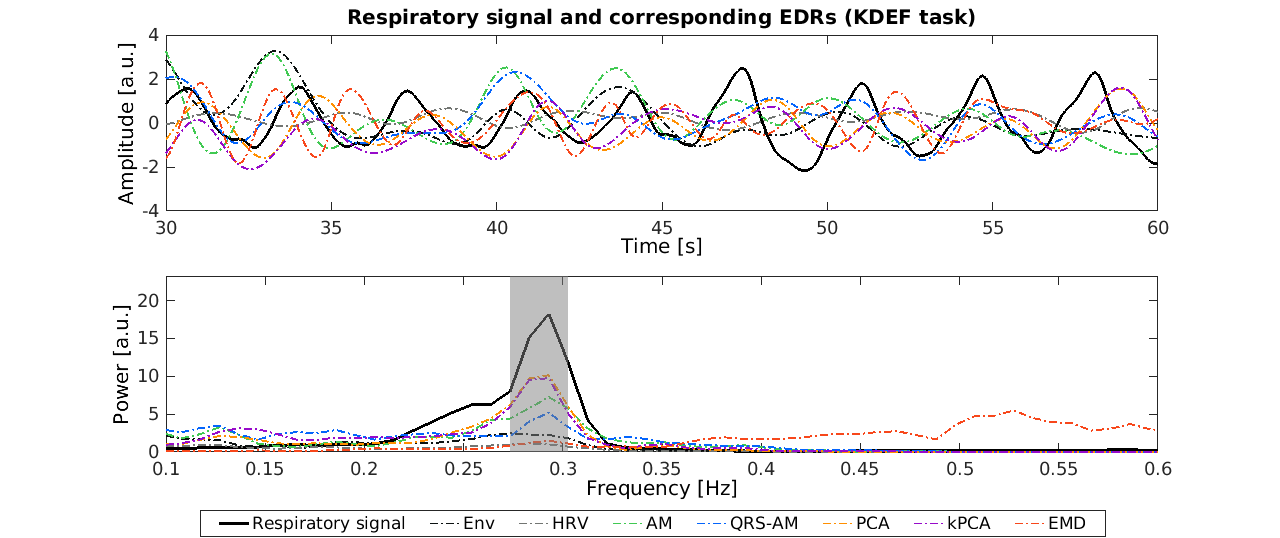
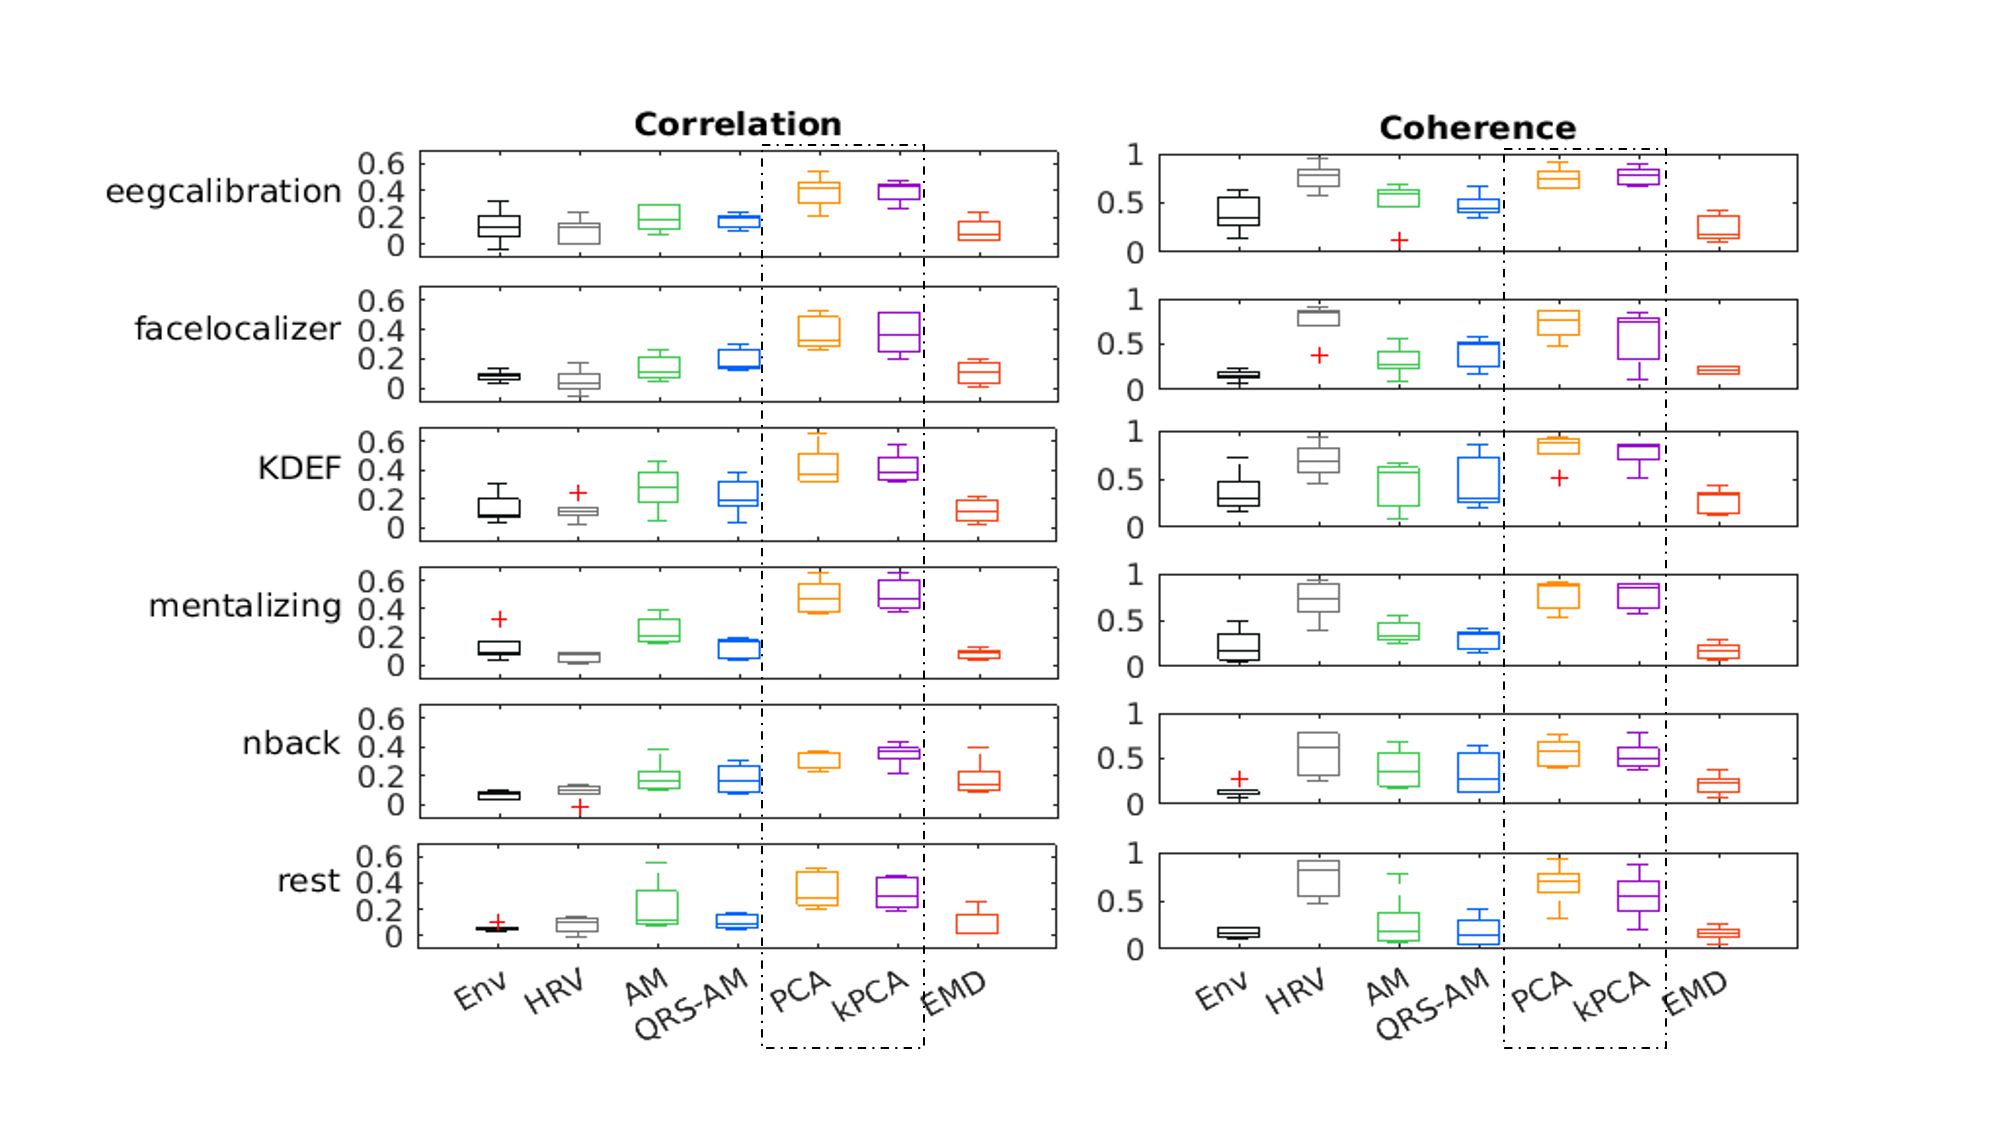
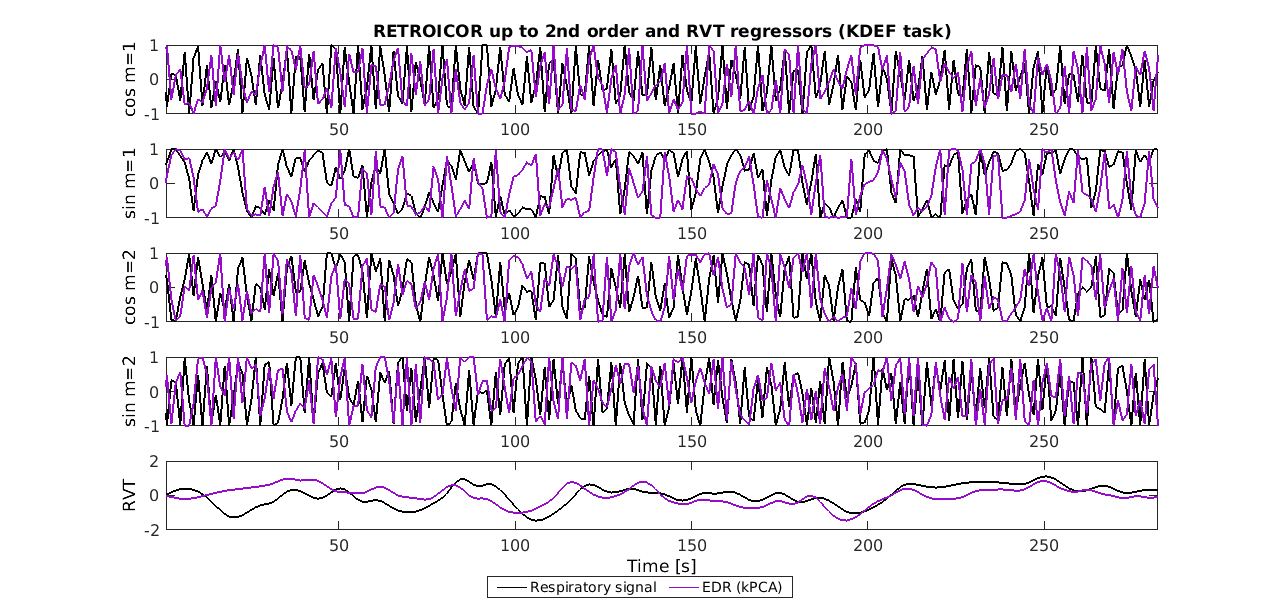
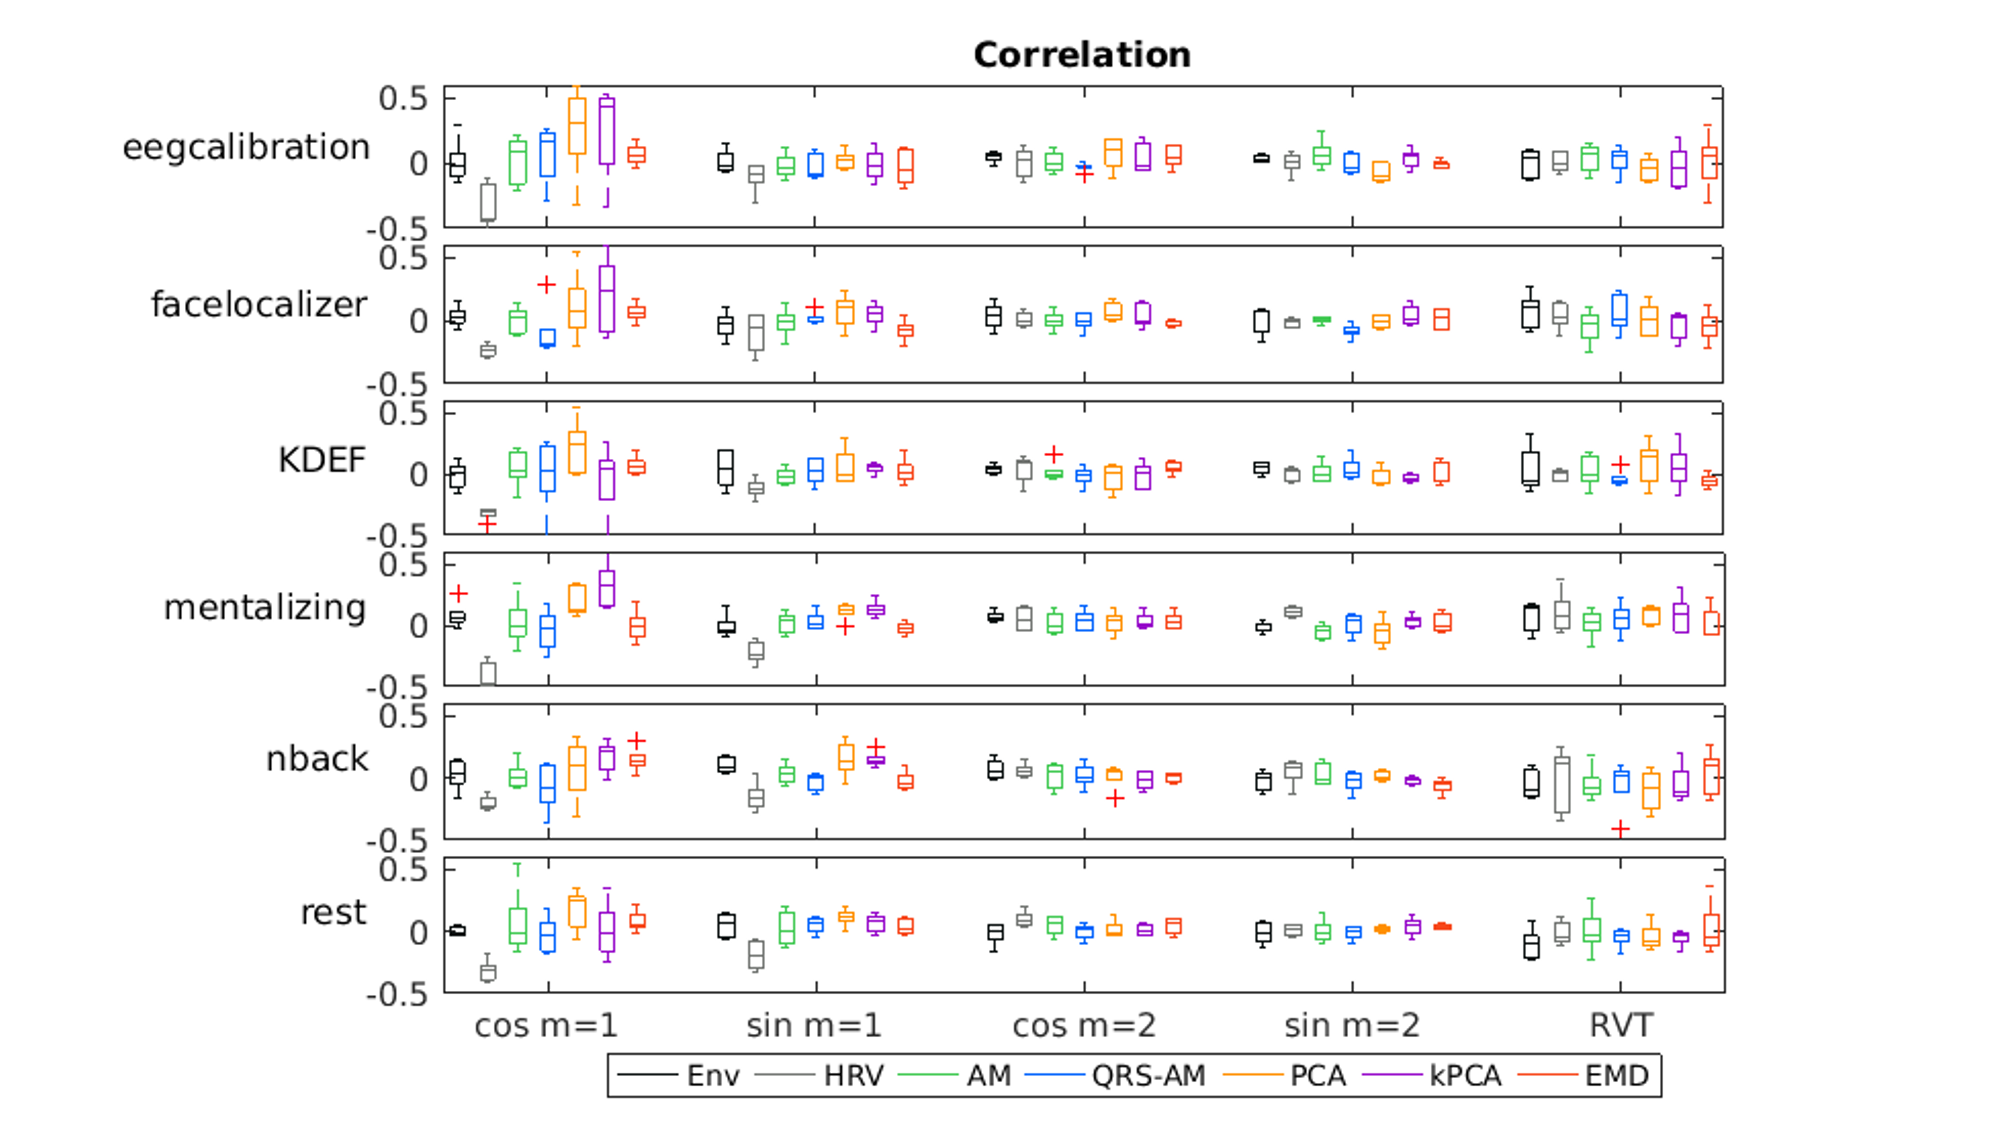
For simplicity, results are presented only for the EDR methods yielding the highest correlation coefficients with Resp for each category. Visual inspection indicates that the EDR waveforms in general resemble Resp, though with amplitude differences and a time shift, and their power spectra overlap the respiratory frequency band (Fig1). A statistically significant effect of the EDR method was found for both correlation and coherence, with an effect of the task only for coherence (Fig.2). kPCA and PCA yielded the highest correlation. Regarding coherence, these were only surpassed by HRV for some tasks. Importantly, the correlation across all tasks was statistically significantly greater than zero for kPCA and PCA (p< 0.001, Wilcoxon signed-ranks test).Concerning the fMRI respiration regressors (Fig.3), visual inspection indicates similarity between the RVT time courses extracted from Resp and from the EDR obtained using kPCA, while similarity of the RETROICOR regressors is less evident. In general, correlation between regressors obtained with EDR and Resp was low (Fig.4), with kPCA and PCA outperforming the others for the 1st order cosine regressor.
Discussion and conclusion
We found that EDRs obtained using kPCA and PCA were significantly correlated with the measured respiratory signal, in line with previous work6,7,12, indicating the possibility to obtain surrogates of respiratory signals from the ECG recorded in the MR environment. Interestingly, the EMD method, which performed best based on a power ratio criteria considering the frequency range 0.2-0.4Hz2, did not achieve the best performance in our study. Nevertheless, their study found kPCA and PCA as the second/third best methods, which is consistent with our findings.Although EDR methods provided signals that were similar in shape and frequency to the measured respiratory signal, the ensuing fMRI regressors did not reflect this similarity. This might be due to the identified time lags, which may result in different phases and consequently mismatching regressors. In fact, we considered a blind use of the EDRs to estimate the regressors, not shifting the EDRs by the optimal time lag found by cross-correlation. A systematic characterization of the time lags between EDRs and true respiratory signals may help understand if this may be accounted for. Future work should also assess the impact of using EDR-based respiratory regressors in the variance explained of BOLD-fMRI.
Acknowledgements
We acknowledge the Portuguese Science Foundation through grants PTDC/EMD-EMD/29675/2017, LISBOA-01-0145-FEDER-029675, UIDB/50009/2020 and PD/BD/150356/2019.References
[1] Chang, C., Cunningham, J. P., & Glover, G. H. (2009). Influence of heart rate on the BOLD signal: The cardiac response function. NeuroImage, 44(3), 857–869. https://doi.org/10.1016/j.neuroimage.2008.09.029
[2] Abreu, R., Nunes, S., Leal, A., & Figueiredo, P. (2017). Physiological noise correction using ECG-derived respiratory signals for enhanced mapping of spontaneous neuronal activity with simultaneous EEG-fMRI. NeuroImage, 154, 115–127. https://doi.org/10.1016/j.neuroimage.2016.08.008
[3] Varon, C., Morales, J., Lázaro, J., Orini, M., Deviaene, M., Kontaxis, S., Testelmans, D., Buyse, B., Borzée, P., Sörnmo, L., Laguna, P., Gil, E., & Bailón, R. (2020). A Comparative Study of ECG-derived Respiration in Ambulatory Monitoring using the Single-lead ECG. Scientific Reports, 10(1), 5704. https://doi.org/10.1038/s41598-020-62624-5
[4] Abreu, R., Leite, M., Jorge, J., Grouiller, F., van der Zwaag, W., Leal, A., & Figueiredo, P. (2016). Ballistocardiogram artifact correction taking into account physiological signal preservation in simultaneous EEG-fMRI. NeuroImage, 135, 45–63. https://doi.org/10.1016/j.neuroimage.2016.03.034
[5] Niazy, R. K., Beckmann, C. F., Iannetti, G. D., Brady, J. M., & Smith, S. M. (2005). Removal of FMRI environment artifacts from EEG data using optimal basis sets. NeuroImage, 28(3), 720–737. https://doi.org/10.1016/j.neuroimage.2005.06.067
[6] Widjaja, D., Varon, C., Dorado, A., Suykens, J. A. K., & Van Huffel, S. (2012). Application of Kernel Principal Component Analysis for Single-Lead-ECG-Derived Respiration. IEEE Transactions on Biomedical Engineering, 59(4), 1169–1176. https://doi.org/10.1109/TBME.2012.2186448
[7] Varon, C., & Van Huffel, S. (2015). ECG-derived respiration for ambulatory monitoring. 2015 Computing in Cardiology Conference (CinC), 169–172. https://doi.org/10.1109/CIC.2015.7408613
[8] Glover, G. H., Li, T.-Q., & Ress, D. (2000). Image‐based method for retrospective correction of physiological motion effects in fMRI: RETROICOR.6.
[9] Bianciardi, M., Fukunaga, M., van Gelderen, P., Horovitz, S. G., de Zwart, J. A., Shmueli, K., & Duyn, J. H. (2009). Sources of functional magnetic resonance imaging signal fluctuations in the human brain at rest: A 7 T study. Magnetic Resonance Imaging, 27(8), 1019–1029. https://doi.org/10.1016/j.mri.2009.02.004
[10] Birn, R. M., Murphy, K., & Bandettini, P. A. (2008). The effect of respiration variations on independent component analysis results of resting state functional connectivity. Human Brain Mapping, 29(7), 740–750. https://doi.org/10.1002/hbm.20577
[11] JASP Team (2020). JASP (Version 0.14)[Computer software]
[12] Jansen, K., Varon, C., Van Huffel, S., & Lagae, L. (2013). Ictal and interictal respiratory changes in temporal lobe and absence epilepsy in childhood. Epilepsy Research, 106(3), 410–416. https://doi.org/10.1016/j.eplepsyres.2013.07.008
Figures