3383
Are BOLD signal amplitude and synchronous low frequency fluctuations of EEG power related?1Radiology, Cleveland Clinic, Cleveland, OH, United States, 2Epilepsy, Cleveland Clinic, Cleveland, OH, United States
Synopsis
Resting state motor network is investigated using EEG theta to beta ratio (TBR) and compared with calibrated fMRI.
Introduction
Resting-state functional MRI (rs-fMRI) has become perhaps the most popularly method to investigate neuronal functional connectivity (FC) [1,2]. Integration of fMRI with direct neuronal measurement such as EEG enhances the utility of fMRI studies. [3,4]. Analysis of whole-brain temporal fluctuations of EEG signals and quantification of their spatial coherence within the resting-state network (RSN) is challenging since scalp-recorded EEG measurements are attenuated by the resistivity of skull and dura.In this study, we investigated low frequency fluctuation of EEG power within the resting-state motor network and compare it with simultaneously acquired fMRI, blood flow and cerebral metabolic rate of oxygen data, calibrated using a hypercapnia challenge.
Methods
Simultaneous EEG-fMRI data were collected from 7 MS patients. EEG was acquired using 64 channel gold-cup electrodes placed on the scalp. Seven minutes of eyes-closed resting-state EEG data were acquired before and during an MRI scan.MRI Data Acquisition: rsfMRI data were acquired at 3T using 2d GRE EPI PACE sequence (TR/TE=2800/27 ms, voxel size = 2x2x4 mm3, 31 slices). In addition, an in-house simultaneous multi-slice excited double echo pseudo-continuous tagging arterial spin labeling sequence was used for the following fMRI and hypercapnia scans [5]. Four blocks (48s On/Off periods) of 2 Hz paced unilateral finger tapping task was performed during the fMRI scan. The study was repeated two times inside the scanner. Five percent of CO2 mixed gas was delivered two times with 2 mins of periods during 12 mins of scanning.
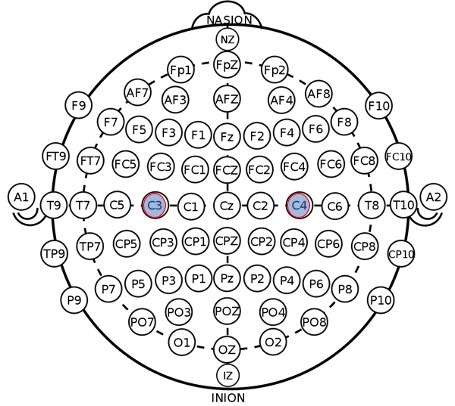
EEG analysis: For EEG acquired inside the scanner, template subtraction was used to remove the MR gradient artifact [6]. Cardioballistic artifacts, eyeblink artifacts were also identified and removed. EEG data were downsampled to 250 Hz and band-pass filtered using a Chebyshev filter at the following frequencies: 1-4 Hz (delta), 4-8Hz (theta), 8-13 Hz (alpha), 13-20 Hz (low beta), 20-30 (high beta), 30-40 Hz (low gamma), and 40–70 Hz (high gamma) [6]. The bandpassed EEG signals were Hilbert transformed and the absolute Hilbert envelope are calculated. The absolute Hilbert envelope values were averaged for every 2.8 seconds, equivalent to TR of fMRI [3]. We selected theta to low beta power ratio (TBR) to monitor the resting-state brain network [7]. Low-frequency bandpass filter (0.005Hz< < 0.1Hz) was applied to the TBR signal. Pearson correlation coefficient (CC) of the TBR signal between C3 (targeting left motor cortex ) and C4 (right motor cortex) was calculated, as shown in Fig1.
MRI analysis: Activation maps are produced by performing a standard GLM analysis convolving the ASL and BOLD timeseries data with the reference function corresponding to the task. Region-of-interest (ROI) of activated M1 is defined using voxels activated with p <0.01 in time series of perfusion-weighted signal (subtractin tagged and untagged ASL images). The percent change in CBF and BOLD contrast during the activation and hypercapnia condition is calculated within the activated ROI, and the change of the cerebral metabolic rate of oxygen (CMRO2) during the activation is calculated using the calibrated fMRI model [8,9].
Result
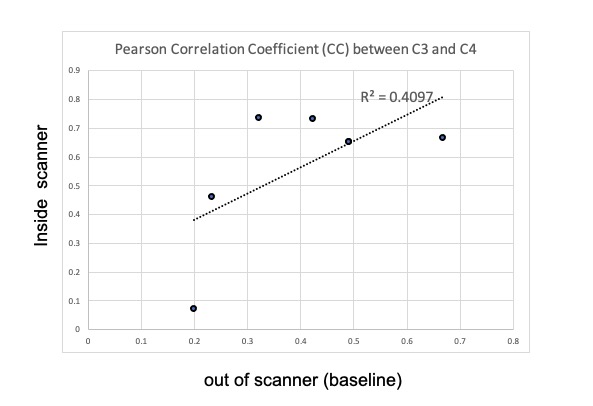
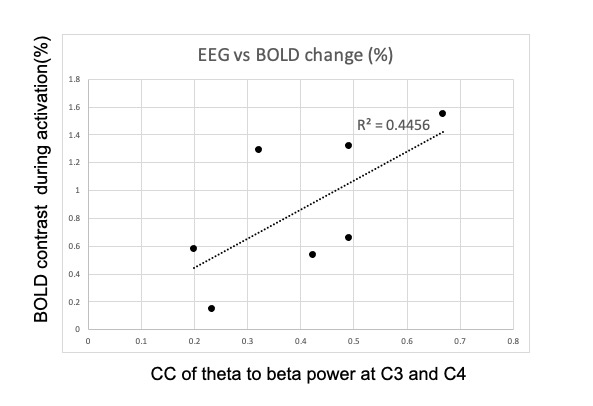
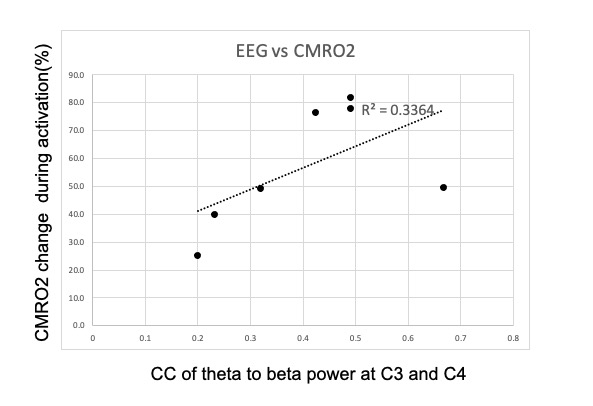
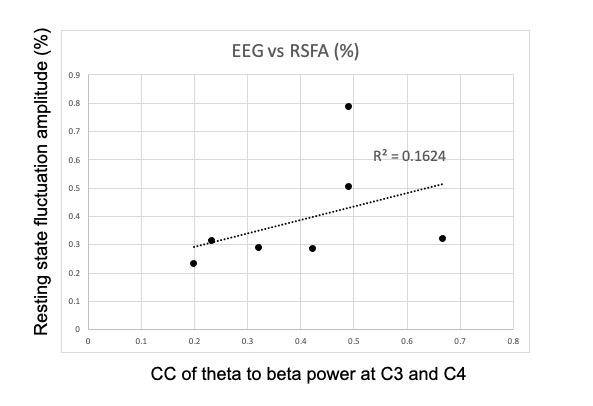
Figure 1 compares CC of TBR at EEG contact C3 (left central) and C4 (right central) for inside/outside MR scanner. The result indicates that EEG data during MR scanning, with all scanner-related artifact corrections, is comparable to resting-state EEG data recorded outside the scanner.Figure 2 shows CC of TBR at C3 and C4, and BOLD contrast change in the activated ROI. Although not significant (p<0.13), there is clearly a trend toward a relationship. Figure 3 compares CC of TBR at C3 and C4 with the calculated CMRO2 values in the activated ROI. A similar trend is noted. Figure 4 compares CC of TBR at C3 and C4 with the resting-state fluctuation amplitude (RSFA) values in the activated ROI [10]. It should be noted that the data in Figure 3 is calculated using data from Figure 2, so those results are not independent. However, Figures 2 and 4 are independent measurements and both clearly show a trend toward a relationship to correlated synchronous left/right motor cortex TBR low frequency fluctuations.
Discussion & Conclusion
As stated, the MRI data used to produce Figures 2 and 3 are related because CMRO2 is calculated using the BOLD signal change and the observed CBF change in the same scan. However, Figure 2 and Figure 4 are only related through a physiologic mechanism possibly related to cerebrovascular reactivity[13]. If these are truly correlated, and more data is needed to verify this, the result is highly suggestive that right/left primary motor cortex TBR synchrony is somehow related to cerebrovascular reactivity (CVR), i.e. higher network TBR synchrony implies higher BOLD signal amplitudes for a given underlying neuronal response.We presented the feasibility of low-frequency fluctuation of TBR signals to investigate the resting state network. Even though no statistical significance was observed in this preliminary data set (n=7), we demonstrated that there exists a relationship between low-frequency TBR signal estimated using EEG signal and fMRI functional connectivity analysis of resting-state networks.
TBR is known to be negatively related to cognitive control, showing the possible link to ADHD [11] and schizophrenia [14]. Quantification of temporal fluctuation of TBR could be a potential technique to investigate resting-state brain networks in simultaneous EEG and fMRI studies.
Acknowledgements
Authors appreciate the technical support from Siemens.References
1. Biswal B, Yetkin FZ, Haughton VM, Hyde JS. Functional connectivity in the motor cortex of resting human brain using echo-planar MRI. Magn Reson Med. 1995 Oct;34(4):537-41.
2. Lowe MJ, Mock BJ, Sorenson JA. Functional connectivity in single and multislice echoplanar imaging using resting-state fluctuations. Neuroimage. 1998 Feb;7(2):119-32.
3. Deligianni F, Centeno M, Carmichael DW, Clayden JD. Relating resting-state fMRI and EEG whole-brain connectomes across frequency bands. Front Neurosci. 2014;8:258.
4. Custo A, Van De Ville D, Wells WM, Tomescu MI, Brunet D, Michel CM. Electroencephalographic Resting-State Networks: Source Localization of Microstates. Brain Connect. 2017 Dec;7(10):671-682.
5. Kim T, Shin W, Zhao T, Beall EB, Lowe MJ, Bae KT. Whole brain perfusion measurements using arterial spin labeling with multiband acquisition. Magn Reson Med. 2013 Dec;70(6):1653-61.
6. Allen, P. J., Josephs, O. & Turner, R. A Method for Removing Imaging Artifact from Continuous EEG Recorded during Functional MRI. Neuroimage 12, 230–239 (2000).
7. Brookes MJ, Hale JR, Zumer JM, Stevenson CM, Francis ST, Barnes GR, Owen JP, Morris PG, Nagarajan SS. Measuring functional connectivity using MEG: methodology and comparison with fcMRI. Neuroimage. 2011 Jun 1;56(3):1082-104.
8. Lansbergen MM, Arns M, van Dongen-Boomsma M, Spronk D, Buitelaar JK. The increase in theta/beta ratio on resting-state EEG in boys with attention-deficit/hyperactivity disorder is mediated by slow alpha peak frequency. Prog Neuropsychopharmacol Biol Psychiatry. 2011 Jan 15;35(1):47-52.
9. Buxton RB, Wong EC, Frank LR. Dynamics of blood flow and oxygenation changes during brain activation: the balloon model. Magn Reson Med. 1998;39:855–864
10. Davis TL, Kwong KK, Weisskoff RM, Rosen BR. Calibrated functional MRI: mapping the dynamics of oxidative metabolism. Proc Natl Acad Sci USA. 1998;95:1834–1839
11. Kannurpatti SS, Biswal BB. Detection and scaling of task-induced fMRI-BOLD response using resting state fluctuations. Neuroimage. 2008 May 1;40(4):1567-74.
12. Arns M, Conners CK, Kraemer HC. A decade of EEG Theta/Beta Ratio Research in ADHD: a meta-analysis. J Atten Disord. 2013 Jul;17(5):374-83.
13. Kannurpatti SS, Motes MA, Biswal BB, Rypma B. Assessment of unconstrained cerebrovascular reactivity marker for large age-range FMRI studies. PLoS One. 2014 Feb 13;9(2):e88751.
14. Moran LV, Hong LE. High vs low frequency neural oscillations in schizophrenia. Schizophr Bull. 2011;37(4):659-663.
Figures