3382
Pipeline for processing EEG data acquired during block-design simultaneous EEG-fMRI-ASL study1Epilepsy Center, Cleveland Clinic Foundation, CLEVELAND, OH, United States, 2Mellen Center, Cleveland Clinic Foundation, CLEVELAND, OH, United States
Synopsis
EEG data acquired during simultaneous EEG-fMRI studies are prone to environmental and physiological artifacts. In this study, we detail an EEG artifact reduction pipeline for a block design task paradigm during a BOLD/ASL sequence. Briefly, the pipeline consists of removal of MR and cardioballistic artifact, ICA based correction for removing eyeblink and residual scanner artifacts, and source modeling of EEG data to remove additional artifacts. Pipeline was tested on 7 subjects (6 multiple sclerosis patients and 1 normal-control). The EEG data processed using the pipeline shows high fidelity and is comparable to similar data acquired outside the scanner.
Introduction
Simultaneous EEG-fMRI is a non-invasive tool for investigating neurovascular relationships in normal and abnormal neuronal functions1–3. The most common fMRI/EEG studies that are performed are either resting-state studies, examining spontaneous brain activity, or evoked-potential style designed to examine event-related neuronal activity. We performed a simultaneous EEG/fMRI/ASL (arterial spin labeling) study to understand the relationship between electrical, BOLD, and cerebral blood flow response to neuronal activation. The low contrast-to-noise ratio of ASL acquisitions does not lend itself to event-related designs, therefore we present a processing pipeline that was developed to permit high-quality analysis of the resulting block-design EEG data in the presence of MRI artifact from the BOLD/ASL acquisition.Methods
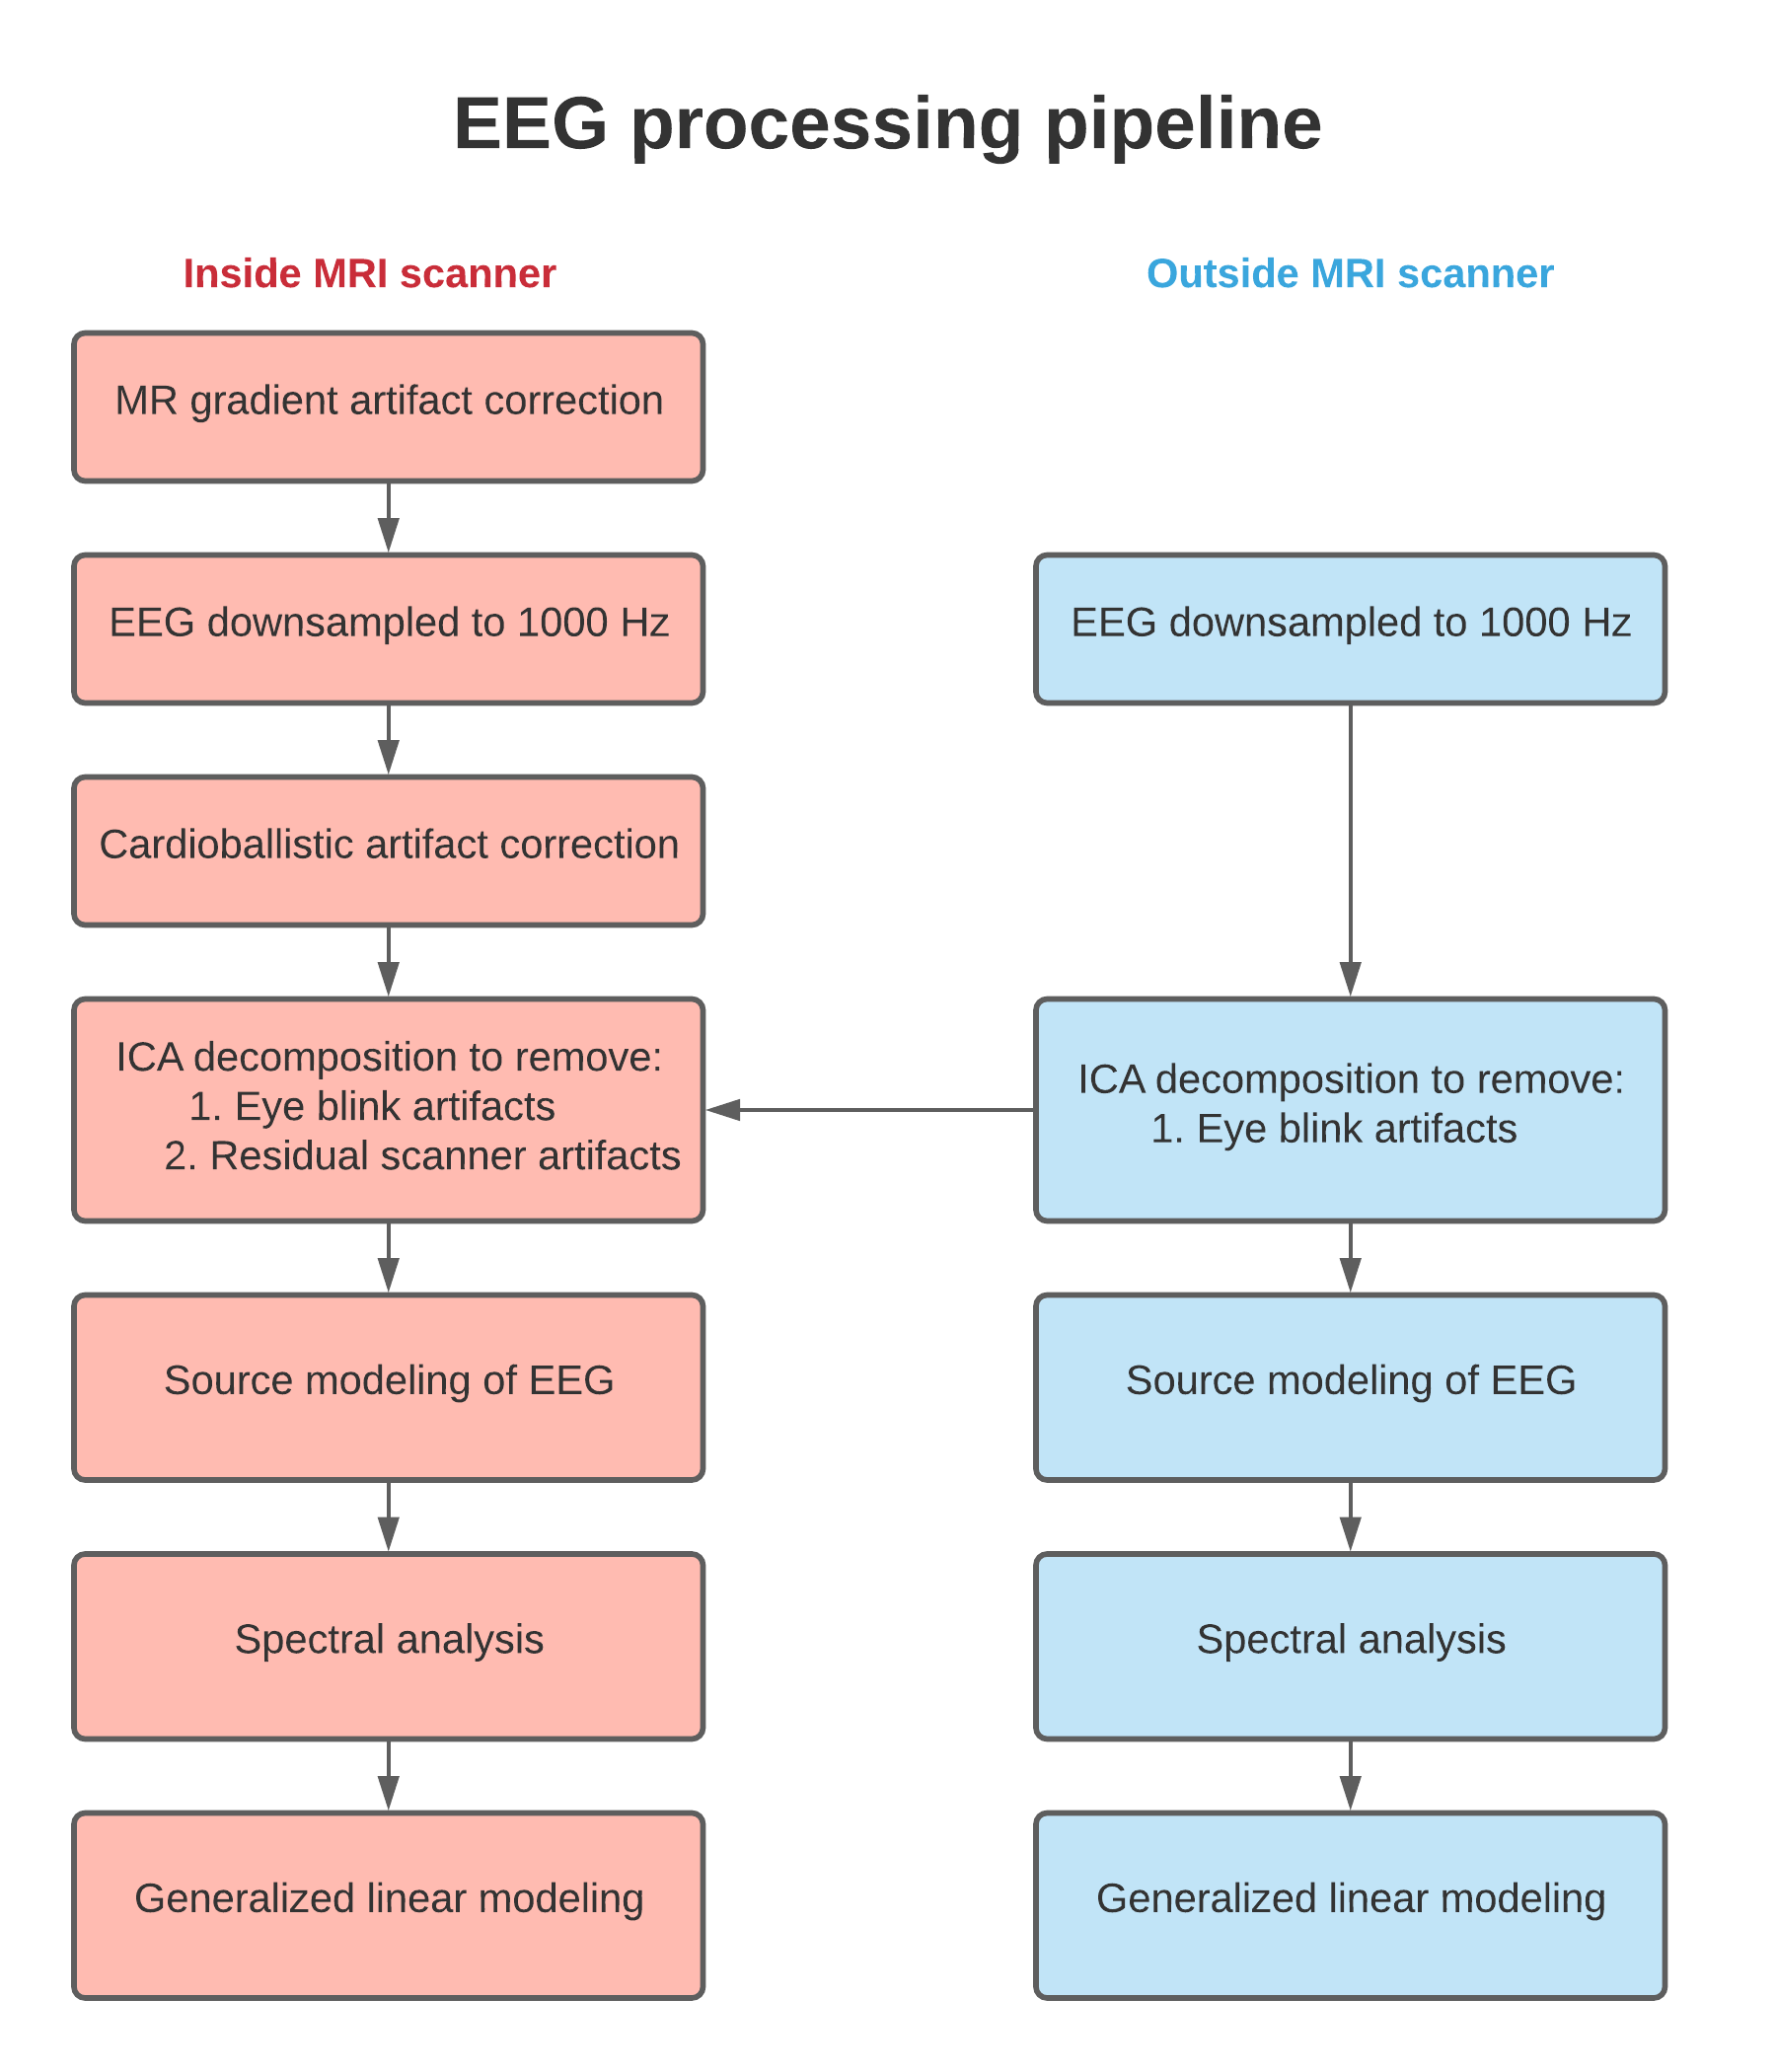
Simultaneous EEG-fMRI was acquired using 64 channel gold-cup electrodes placed on the scalp using a standard 10-10 EEG electrode montage system (Ives EEG Solutions, Newburyport, MA). Study subjects included patients with multiple sclerosis (n=6) and normal controls (n=1). EEG was recorded both inside and outside the scanner during the following experimental conditions: (1) resting state, (2) block design visual checkerboard task (4 Hz, four 48s on/off blocks), and (3) block design finger-tapping task (2 Hz paced, four 48s on/off blocks). Inside the MRI scanner, EEG leads and connectors were bundled together and displaced away from the subject's scalp to minimize imaging artifacts. The cables were routed to a Brainvision EEG amplifier located at the rear end of the MRI scanner bore. The cold head was switched off before EEG collection to minimize artifacts. EEG data were acquired at a 5000 Hz sampling frequency for three experimental conditions described previously. The acquired EEG data were preprocessed using the pipeline described in Figure 1. Template subtraction was used to remove MR gradient artifacts and the EEG data were downsampled to 1000 Hz4. Cardioballistic artifacts were identified and removed from the EEG data. ICA decomposition was used to identify and remove eye blink artifacts, vibration relation artifacts, and residual scanner artifacts. ICA components inside the scanner were compared to ones outside the scanner and the artefactual sources were identified and removed. Source modeling of EEG data was performed to remove additional scanner related artifacts. Cortical reconstruction of MRI data was performed using Brainsuite5. The reconstructed cortical data along with artifact corrected EEG data were exported to Brainstorm6. Source modeling was used to correct residual artifacts not removed by conventional artifact reduction procedures7. The leadfield matrix was constructed using a 3-sphere forward model and dynamical statistical parameter mapping (dSPM) was used for generating the inverse model8. Source modeling was performed on 5000 sources distributed uniformly over the grey matter volume of the reconstructed cortical surface. The first 30 seconds of EEG data during the baseline epoch was used for estimating the noise covariance matrix. Spectral decomposition of source modeled EEG data was performed for every 4-second segment and the normalized power changes at 4 Hz and 2 Hz were estimated for visual and motor tasks, respectively. A generalized linear model was fit on the estimated spectral quantity to identify cortical regions associated with statistically significant EEG change and compared to regions associated with BOLD activation.Results
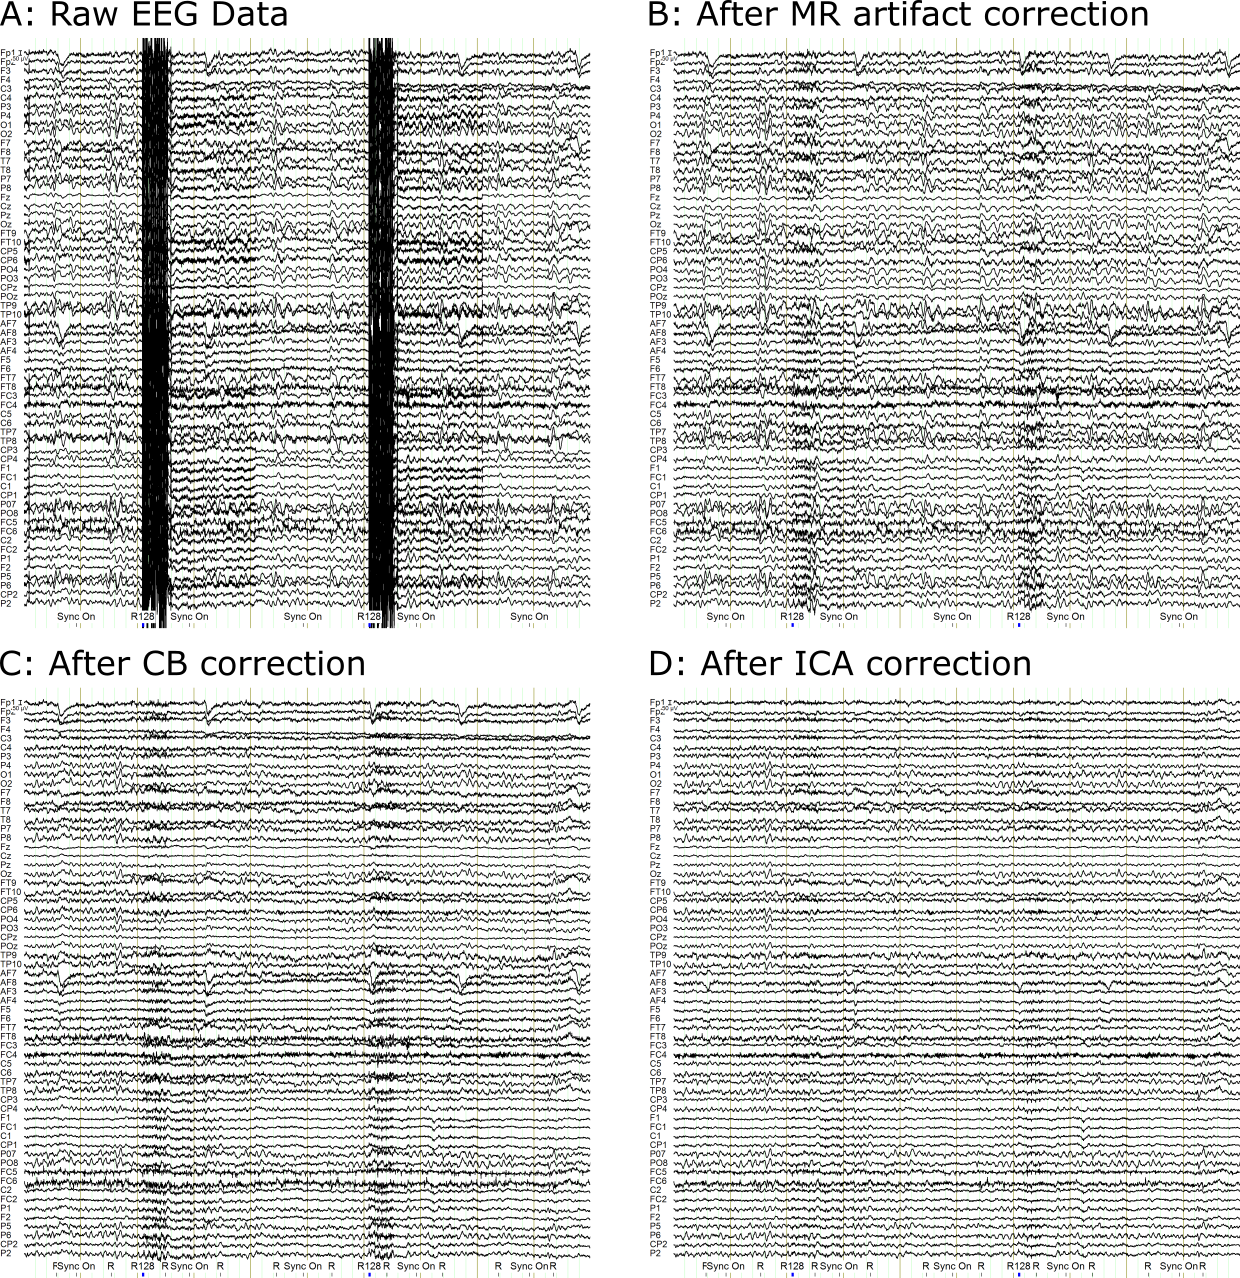
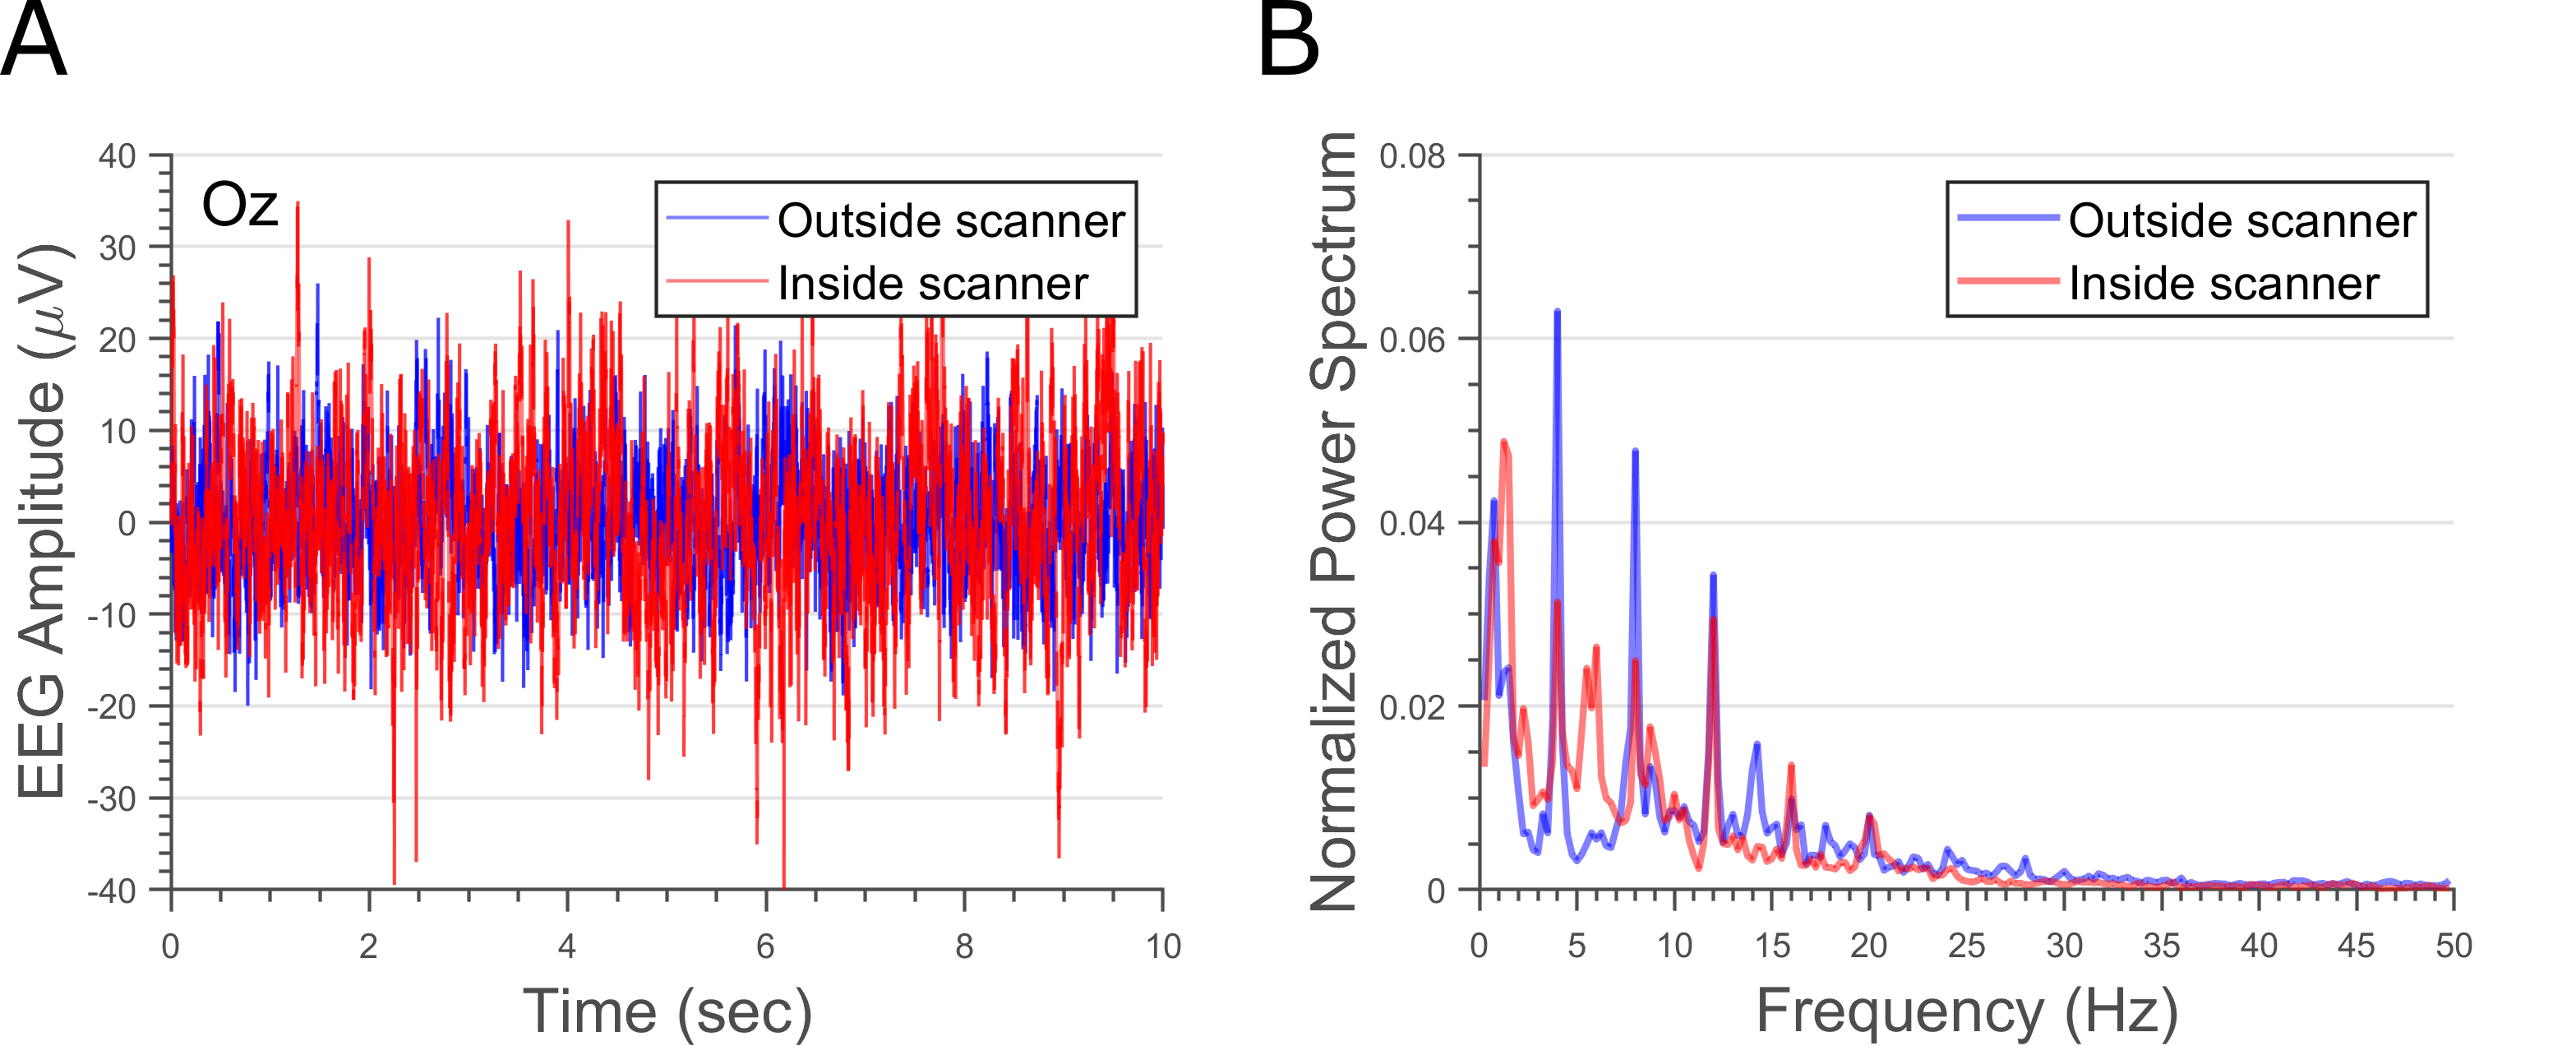
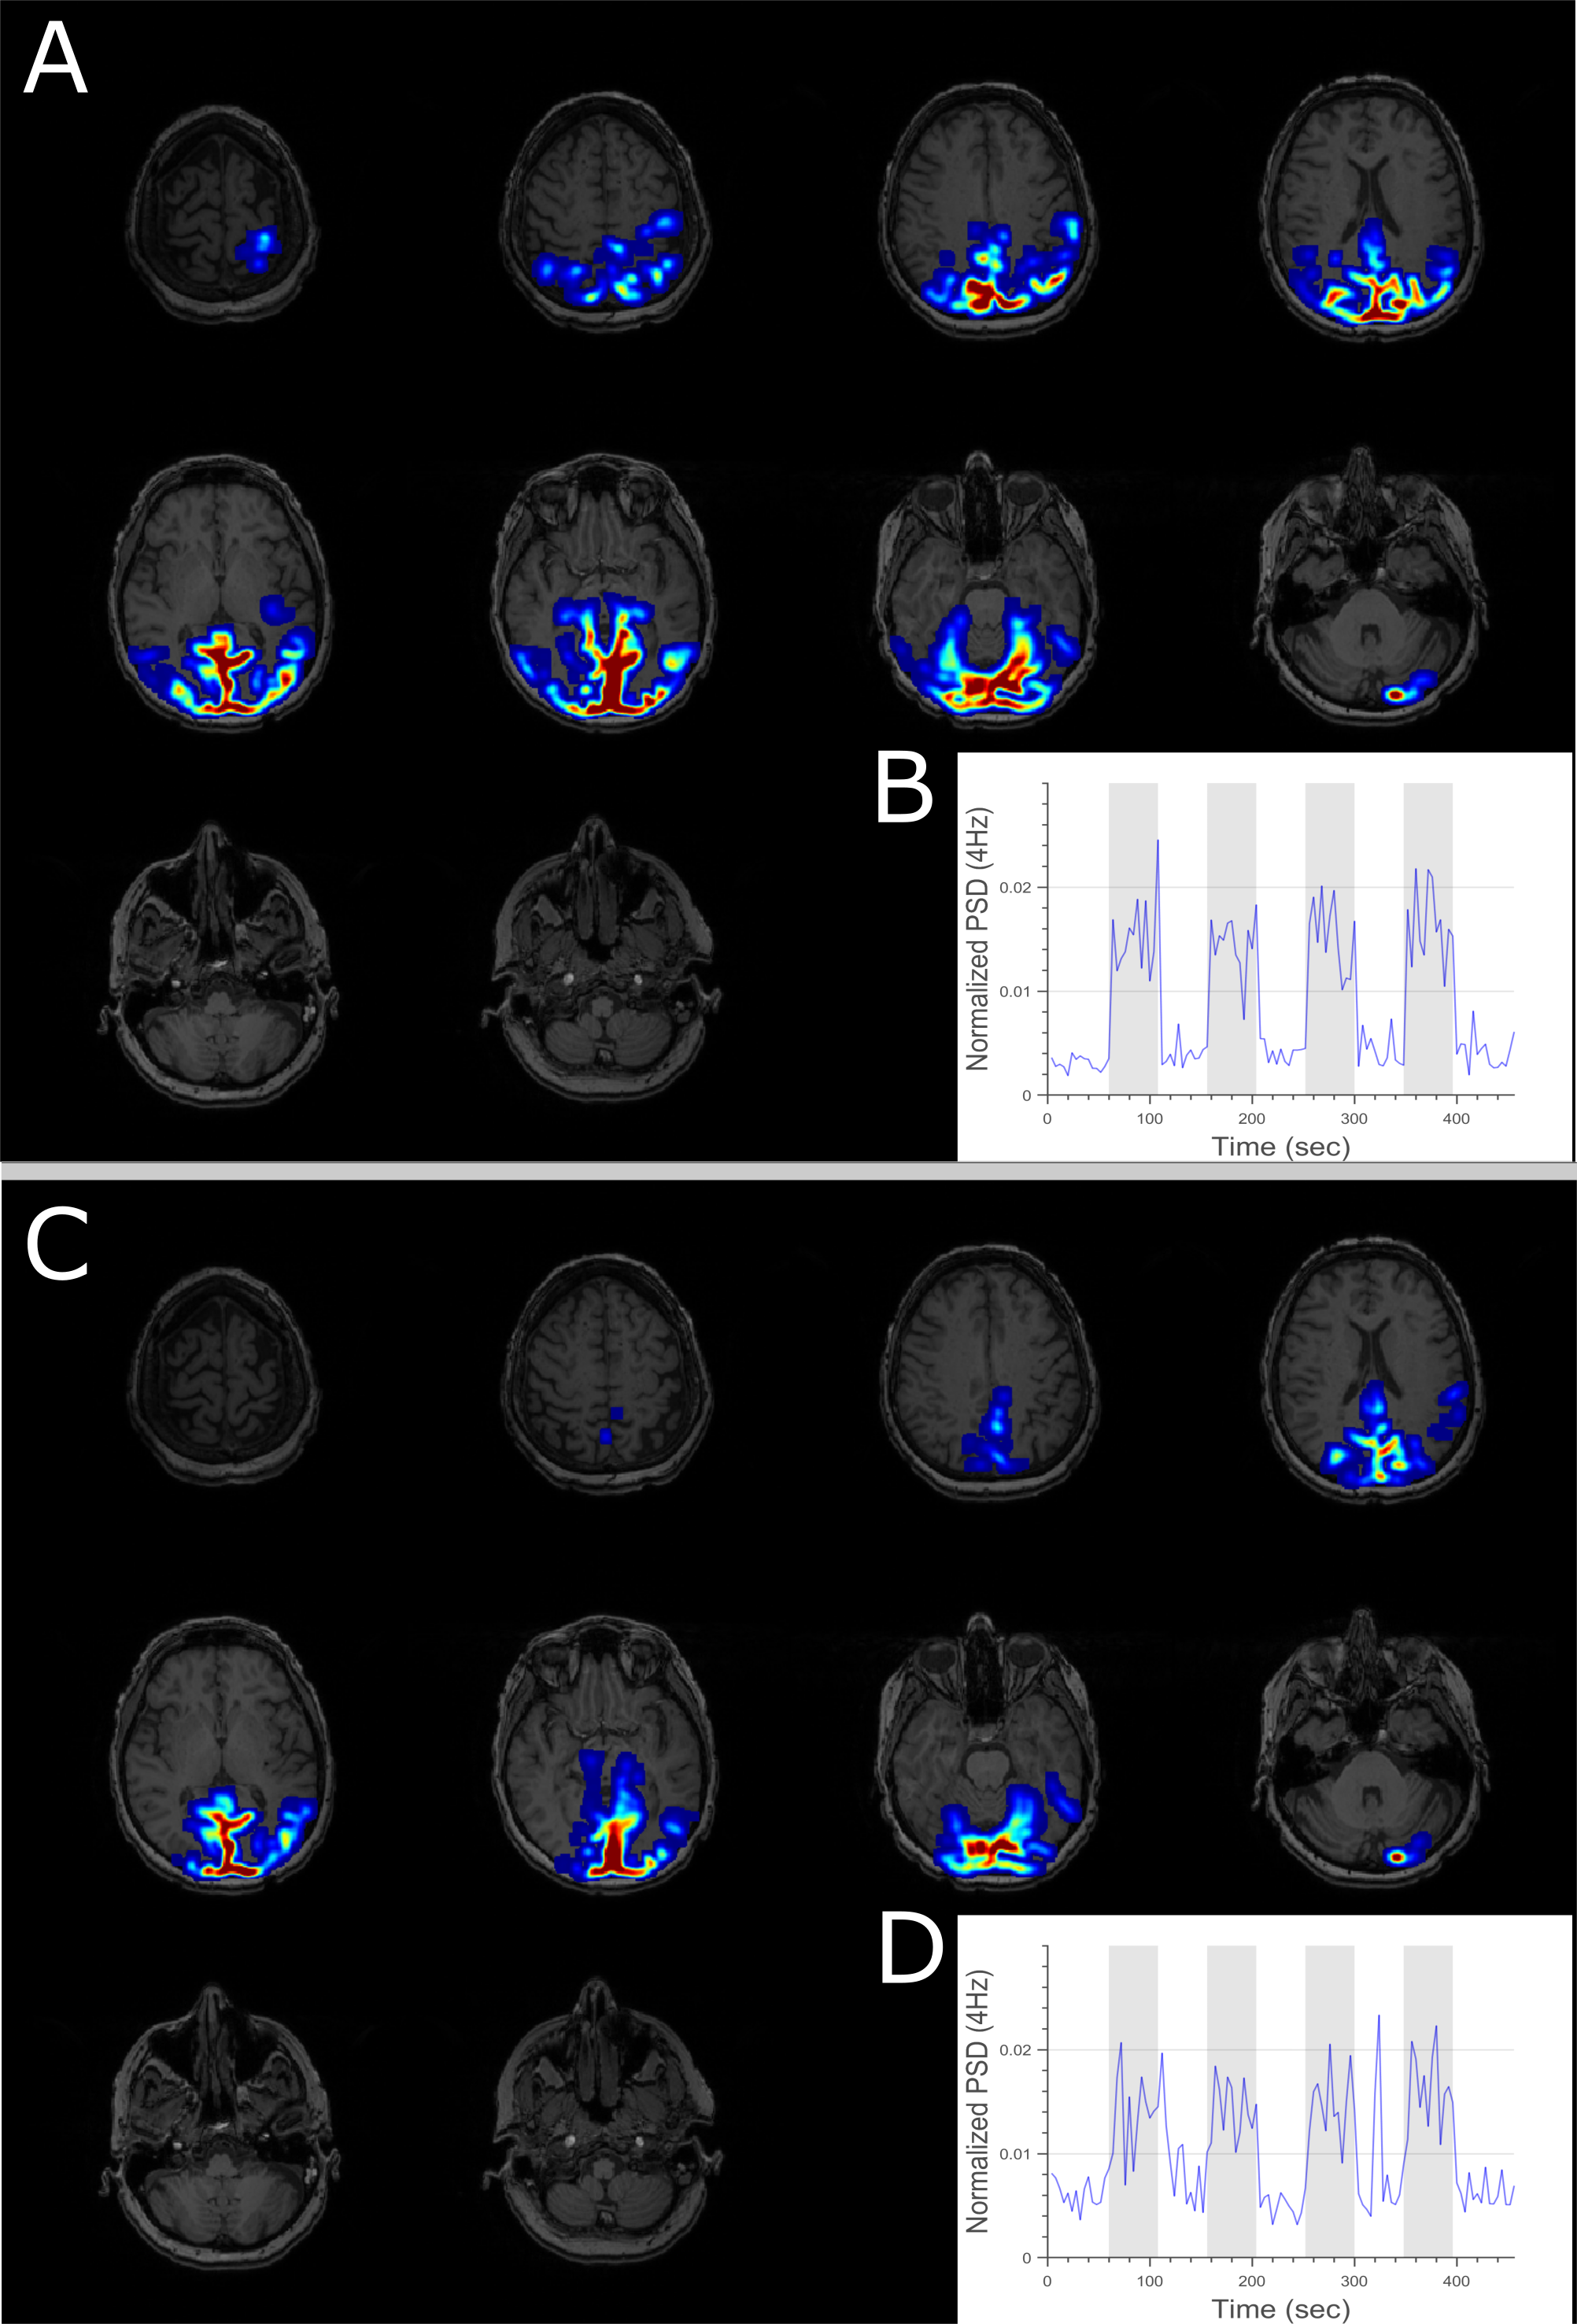
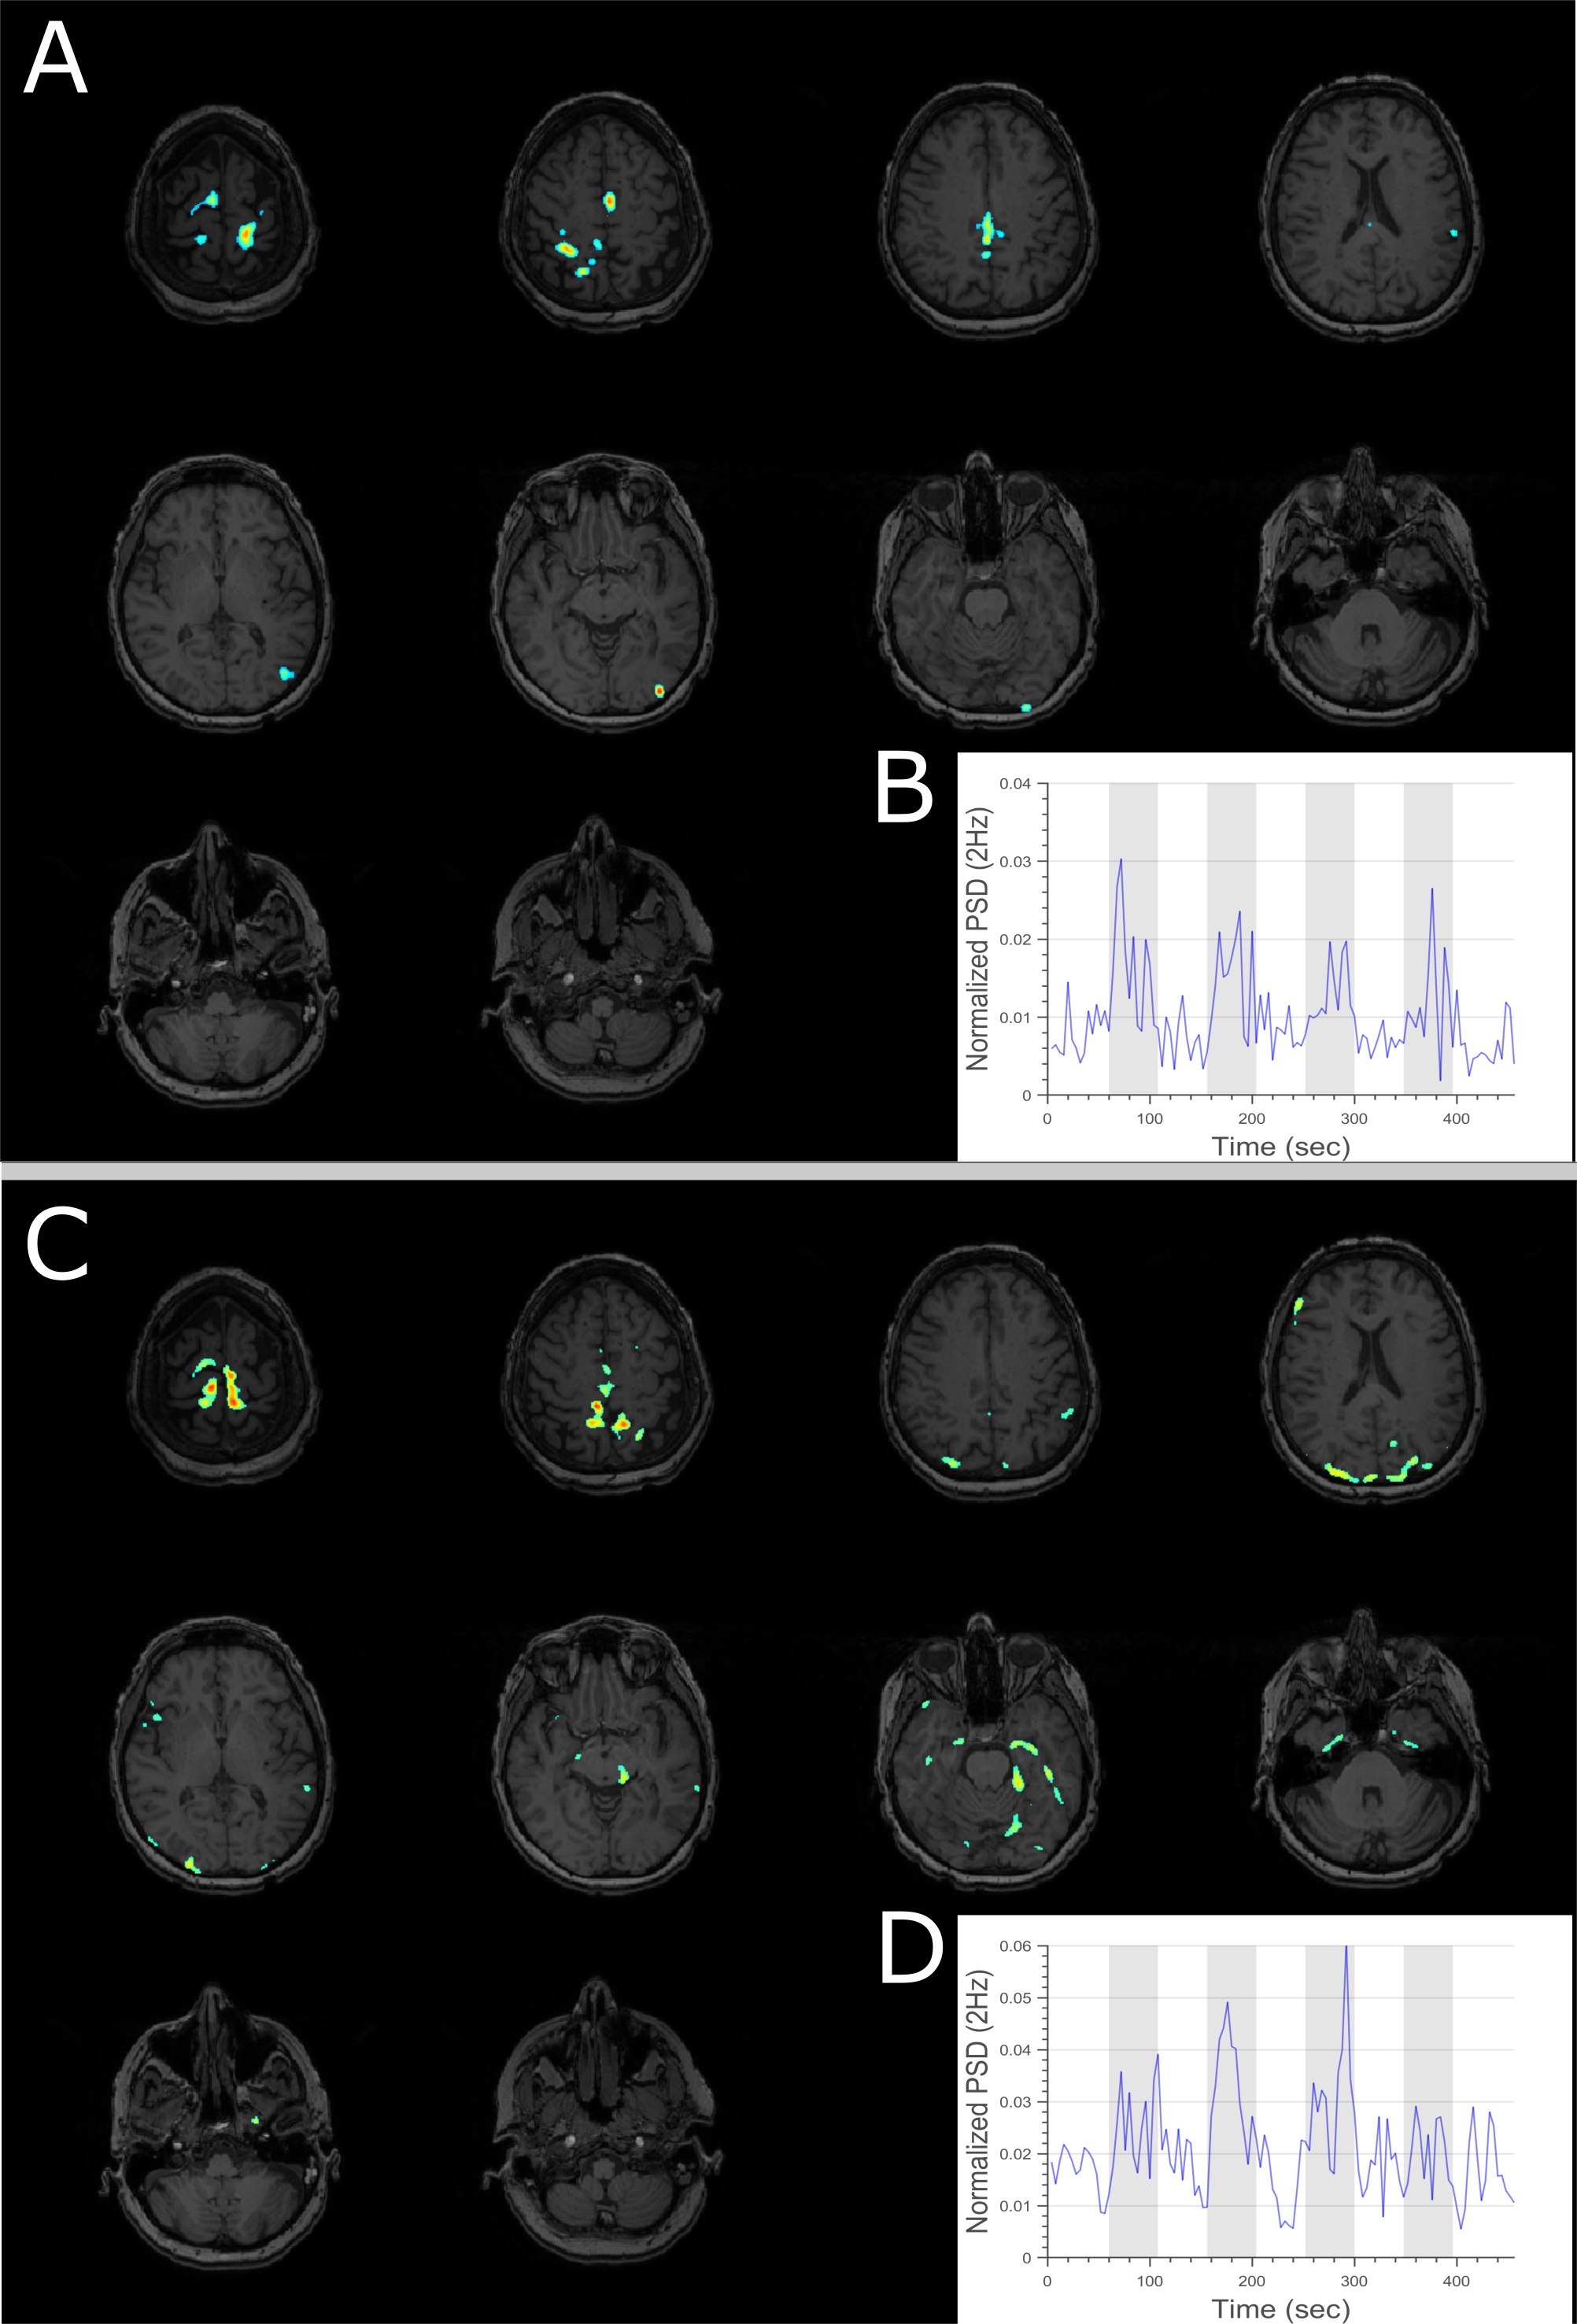
Figure 2 shows representative EEG data at each stage of the artifact correction pipeline for a 10-second segment. Figure 3 shows representative data and power spectral density from an EEG electrode located on the occipital gyrus (Oz) during the visual task for both outside (A) and inside (B) the scanner. Dynamics of EEG power spectrum at the specific frequency band of interest were computed for both visual and motor tasks for EEG data outside and inside the scanner (Figure 4A). Generalized linear modeling of source modeled EEG data reveals similar regions of activation during the specific task for both EEG data acquired outside and inside the scanner (Figure 4-5). In 2 subjects, motion-related EEG fluctuation was observed during motor-task and it correlated with the frequency of finger-tapping.Discussion
The preprocessing pipeline described in this study removes environmental and physiological EEG artifacts with high fidelity. Spectral changes during block designed visual and motor task for EEG acquired inside the scanner show similar dynamical patterns as that of EEG acquired outside the scanner. Finally, source modeling of EEG data can remove residual artifacts and extract activation patterns in specific brain regions associated with the task. Subject motion is a critical artifact source in EEG-fMRI studies and proper patient education and mitigation measures such as a bite-bar should be utilized to minimize it.Conclusion
Our study describes a novel EEG artifact reduction pipeline in a block design task paradigm during a BOLD/ASL sequence. Source modeling of EEG allows the direct comparison of task-related EEG changes with fMRI activation patterns. Our study demonstrates that adequate hardware design and software mediated correction can significantly reduce environmental and physiological EEG artifacts from simultaneous EEG-fMRI experiments. Using this pipeline, we were for the first time able to robustly produce source-localized EEG maps of activation blocks similar to that observed in the simultaneously acquired fMRI data.Acknowledgements
No acknowledgement found.References
1. Gotman, J. Epileptic networks studied with EEG-fMRI. Epilepsia 49 Suppl 3, 42–51 (2008). PMID: 18304255.
2. Laufs, H. et al. EEG-correlated fMRI of human alpha activity. Neuroimage 19, 1463–1476 (2003).
3. Kaufmann, C. et al. Brain activation and hypothalamic functional connectivity during human non-rapid eye movement sleep: an EEG/fMRI study. Brain 129, 655–667 (2005).
4. Allen, P. J., Josephs, O. & Turner, R. A Method for Removing Imaging Artifact from Continuous EEG Recorded during Functional MRI. Neuroimage 12, 230–239 (2000).
5. Shattuck, D. W. & Leahy, R. M. BrainSuite: an automated cortical surface identification tool. Med. Image Anal. 6, 129–42 (2002). PMID: 12045000.
6. Tadel, F., Baillet, S., Mosher, J. C., Pantazis, D. & Leahy, R. M. Brainstorm: a user-friendly application for MEG/EEG analysis. Comput. Intell. Neurosci. 2011, 1–13 (2011). PMID: 21584256.
7. Brookes, M. J., Mullinger, K. J., Stevenson, C. M., Morris, P. G. & Bowtell, R. Simultaneous EEG source localisation and artifact rejection during concurrent fMRI by means of spatial filtering. Neuroimage (2008) doi:10.1016/j.neuroimage.2007.12.030.
8. Dale, A. M. et al. Dynamic statistical parametric mapping: combining fMRI and MEG for high-resolution imaging of cortical activity. Neuron 26, 55–67 (2000). PMID: 10798392.
Figures