3379
Laminar analysis of luminance-dependent visual activation in human V1 with voxel centroid mapping method1Center for Neuroscience Imaging Research, Institute for Basic Science, Suwon, Korea, Republic of, 2Department of Biomedical Engineering, Sungkyunkwan University, Suwon, Korea, Republic of, 3Techna Institute & Koerner Scientist in MR Imaging, University Health Network, Toronto, ON, Canada
Synopsis
Luminance-dependent laminar activation analysis in human V1 is presented. White and black dot-shaped visual stimuli were used to evoke BOLD responses in the early visual cortex. Traditional on/off block stimulation paradigm and continuous stimulation paradigm without interleaved rest periods were used. With voxel centroid mapping, where each voxel’s relative cortical depth is estimated, activation ROIs across multiple image slices and subjects can be analyzed collectively with minimum smoothing and no resampling of functional data. Results show black-dominant responses in V1, with laminar profiles from continuous stimulation emphasizing the role of middle layers by minimizing the effect of ascending vein drainage.
Introduction
Layer-specific analysis of neuronal activity in the human brain using MRI can be difficult to perform because of restrictions imposed by available signal-to-noise ratio (SNR) and hardware limitations. However, ultra-high-field MRI scanners (≥ 7T) enable obtaining high-resolution functional images with submillimeter resolution and thus cortical depth sensitivity1,2. In this study, we analyze laminar profiles in the primary visual cortex (V1) of human subjects using black and white-colored visual stimuli. This is motivated by a previous study where distinct layer activation differences were observed in primate V1 electrophysiology recordings3. We analyzed functional data acquired with a 7T human MRI scanner using voxel centroid mapping method, which calculates relative cortical depth of voxels, therefore accurately illustrating depth-dependent cortical laminar BOLD responses without the necessity of resampling functional data. The results from this study can help elucidate the underlying laminar-specific mechanisms in which visual objects with varying luminance are processed in the human visual cortex.Materials and Methods
Functional data were acquired using a 7T whole-body scanner (Magnetom Terra, Siemens Healthineers, Erlangen, Germany) and a 32-Rx/1-Tx head coil (Nova Medical, Wilmington, MA, USA). Four healthy subjects were scanned (two subjects were scanned twice) pursuant to the procedures approved by the institutional review board.Vendor-provided 2D echo-planar imaging (EPI) sequence with the following imaging parameters was used for functional data acquisition: 0.8 mm isotropic spatial resolution, 64 slices, TR/TE = 3000/29 ms, matrix size = 240 x 240, acceleration (phase4 x slice5) = 2 x 3. The anatomical data acquired with MP2RAGE sequence were distorted using a field map acquired with a double-echo gradient-recalled echo (GRE) sequence to match the distortion of the EPI images. FSL software package was used for motion-correction and co-registration of functional data6,7,8.
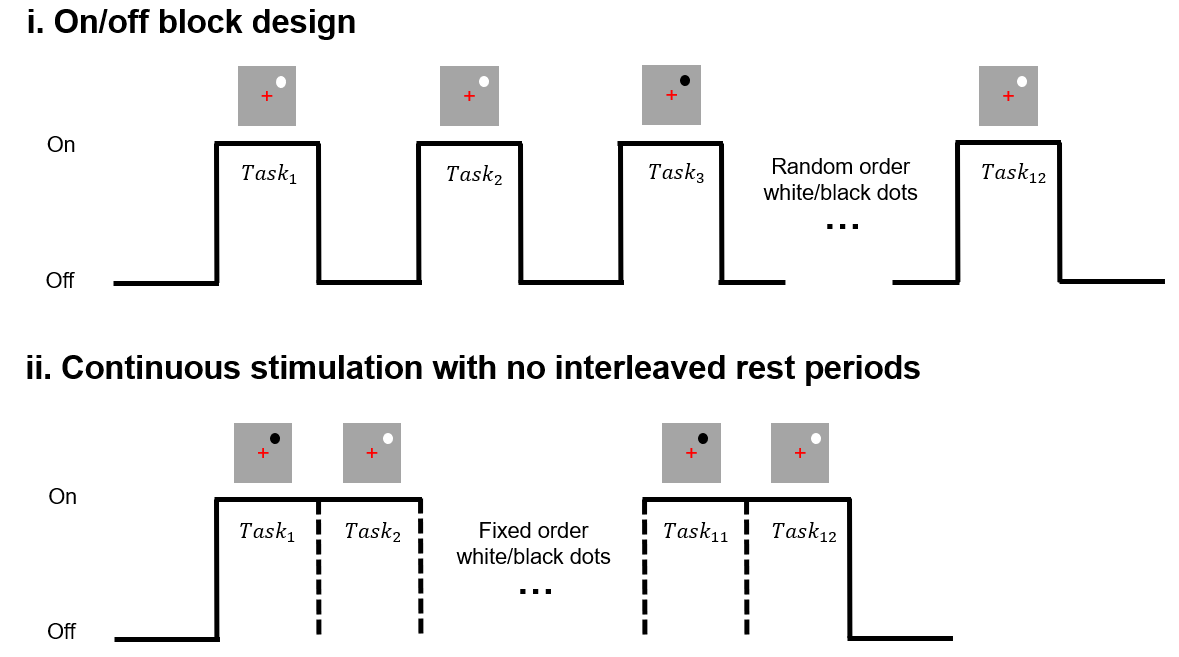
For every scan session, four functional datasets were acquired with visual stimulation. Each dataset comprised of 12 task periods with simple stimuli: a white or black dot appearing for 21 seconds in the first quadrant (upper right corner) of the screen, as shown in Figure 1. Two datasets were acquired with on/off stimulation blocks. The other two datasets were acquired with continuous stimulation with no interleaved rest periods. For both stimulation paradigms, the dot stimuli made continuous random walk motion (restricted within an invisible wall stretching 5% of the width and the height of screen from the center of the first quadrant) with the intention of reducing adaptation during the task periods. Subjects were instructed to fixate their eyes on a small cross located at the center of the screen and press a button whenever its shade changed from bright red to dark red to promote attention.
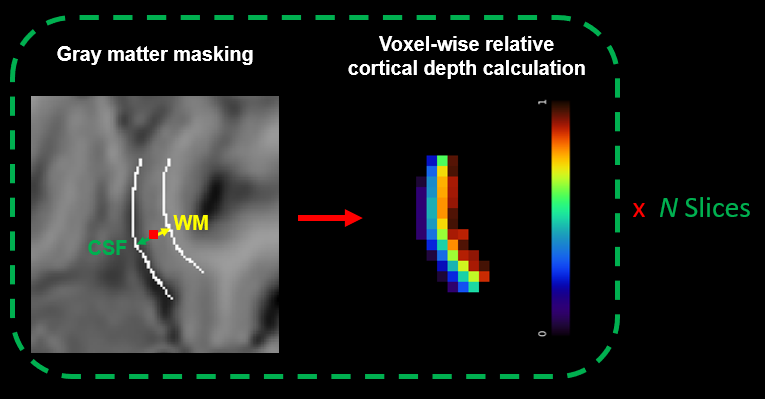
Voxel centroid mapping method was used for estimating the relative cortical depth of every voxel in the ROI. Without resampling the functional data or the activation map, each voxel’s center coordinate is “mapped,” defining its relative distance between the GM-CSF and the GM-WM borders. This practice can help perform laminar activation analysis with minimum smoothing of data and enable plotting results from ROIs in multiple slices across different subjects, taking full advantage of high spatial resolution available in ultra-high-field MRI scanners. Figure 2 illustrates an example of single-slice masking and cortical depth calculation.
Results and Discussion
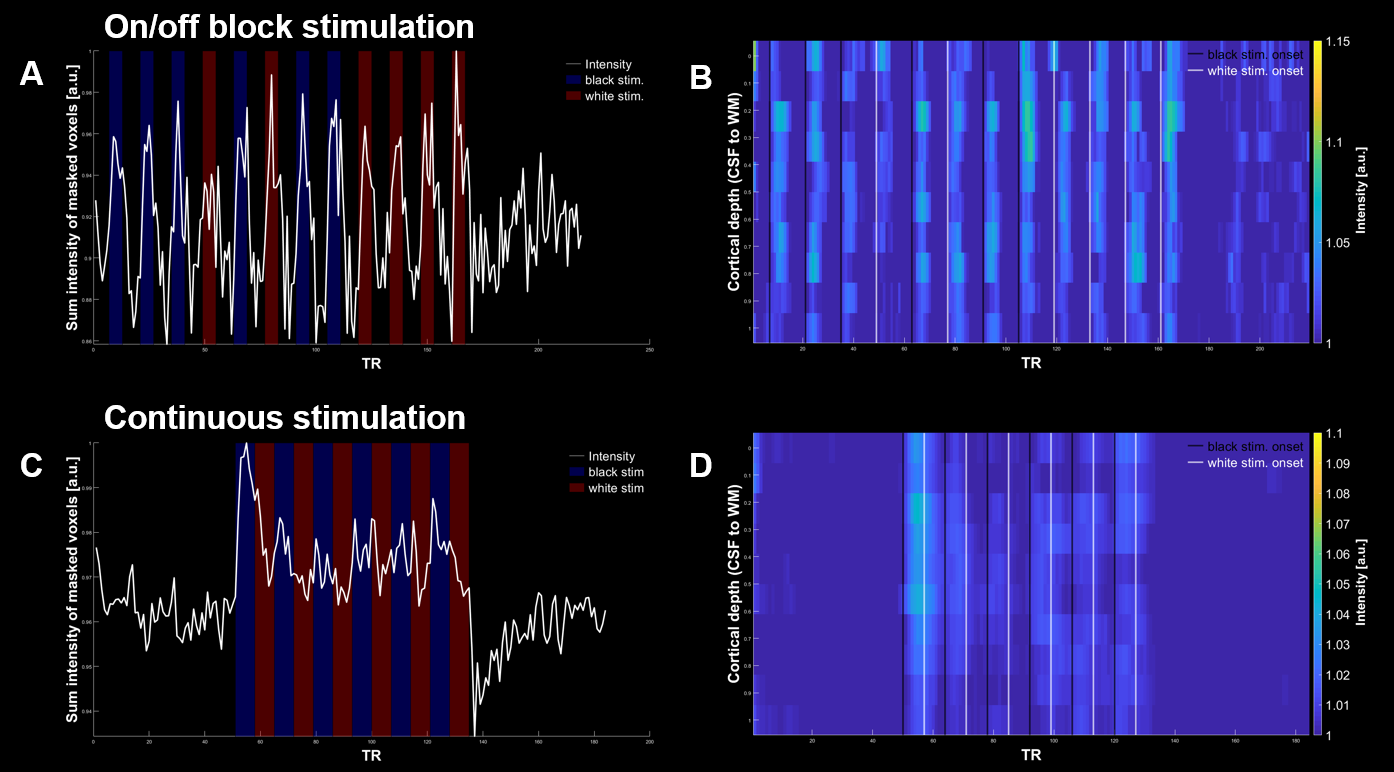
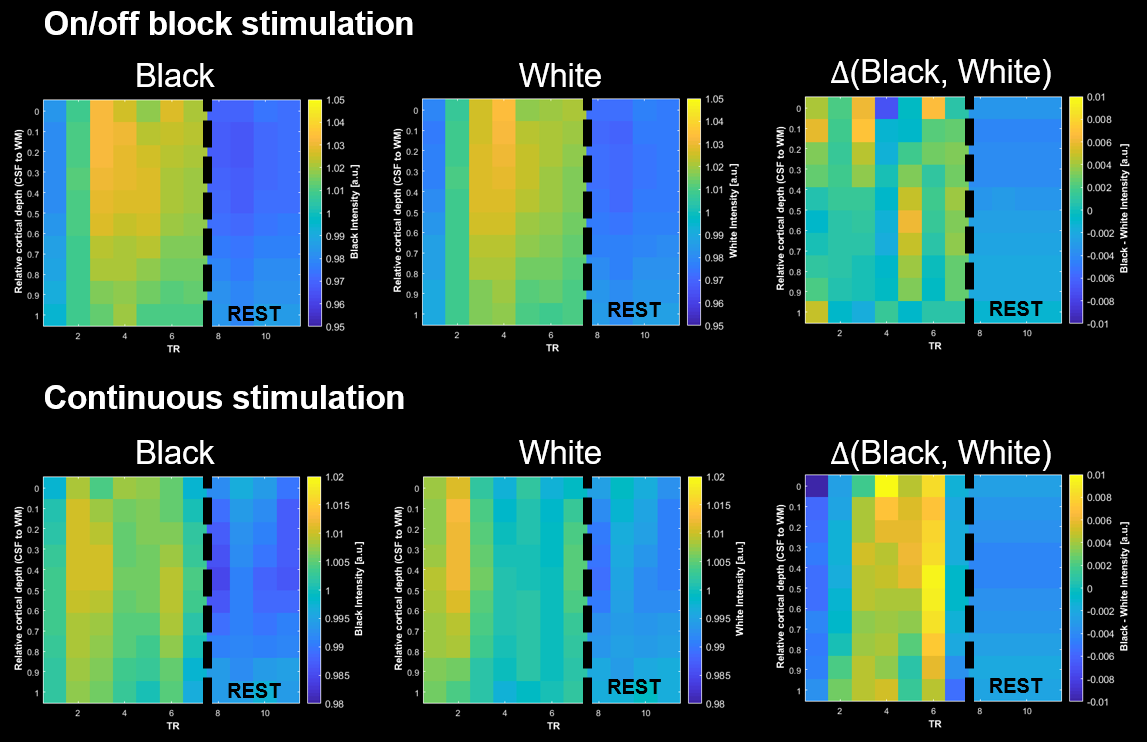
Figure 3 shows cortical depth-dependent time-course intensity plots of masked voxels (B and D). These match well with the stimulation onsets and average time-course intensity of all activation regions (A and C). Although V1 gray matter thickness is limited to ~2mm, covering many voxels with distinct cortical depth values helped divide the cortical depth into 10 bins and average intensity profiles per bin, resulting in an effective spatial resolution greater than the imaging resolution without data resampling.Figure 4 shows the time-course intensity of task blocks averaged for black and white dot task periods. The subtracted time-course data (normalized) of each stimulus shows the black dot response delayed by 1~2 TRs compared to the white dot response. This behavior was observed again more clearly with continuous stimulation.
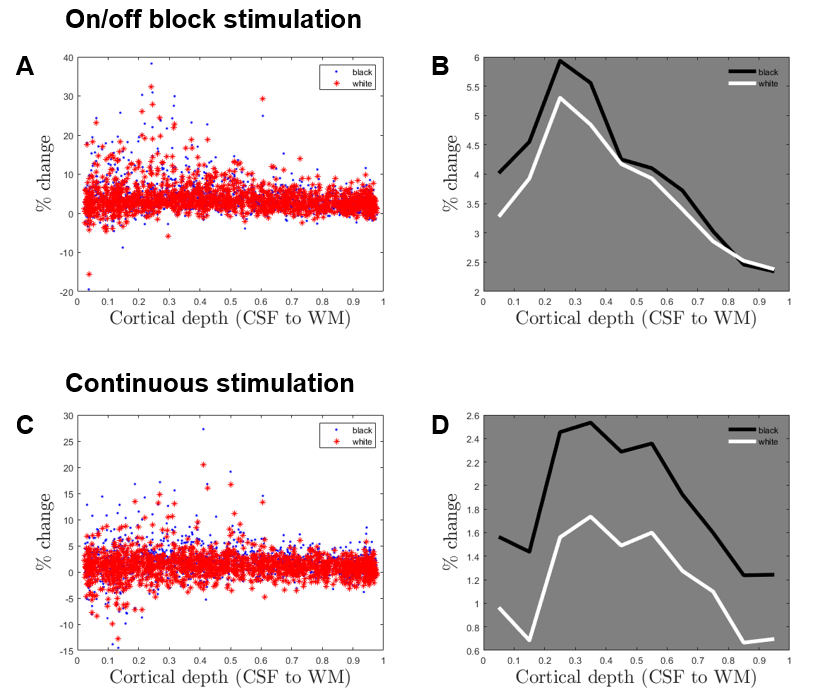
BOLD activation induced by black dot was greater compared to the activation by the white dot. As shown in Figure 5, block stimulation paradigm yielded greater activation for both black and white dot stimuli overall, having maximum activation near the gray matter surface. The voxel-wise activation averaged per 10 cortical depth bins reached 6% and 5%, for black and white dots, respectively. The data acquired with continuous stimulation, however, showed peak activation near the middle layers, where average activation per cortical depth bin neared 2.5% and 1.5%, for black and white dots, respectively. The differences in magnitude of white dot and black dot-induced activations were more distinct for the data acquired with continuous stimulation. Additional data acquisition is planned with data analysis ongoing.
Conclusion
Data shown here indicate low luminance (black dot) visual stimulus inducing a greater BOLD activation overall in V1. This aligns well with the findings from electrophysiology recordings in macaque V1. Forthcoming inter-subject analysis with additional data can help define black-or-white dominant layers in human V1.Acknowledgements
This work was supported by the Institute of Basic Science under grant IBS-R015-D1.References
1. Havlicek M, Uludağ K. A dynamical model of the laminar BOLD response. NeuroImage 2020;204:116209 doi: 10.1016/j.neuroimage.2019.116209. [2] Koopmans, et al., 2010, HBM; 31:1297-1304
2. Koopmans PJ, Barth M, Norris DG. Layer-specific BOLD activation in human V1. Hum. Brain Mapp. 2010;31:1297–1304 doi: 10.1002/hbm.20936.
3. Xing D, Yeh C-I, Shapley RM. Generation of Black-Dominant Responses in V1 Cortex. Journal of Neuroscience 2010;30:13504–13512 doi: 10.1523/jneurosci.2473-10.2010.
4. Griswold MA, Jakob PM, Heidemann RM, et al. Generalized autocalibrating partially parallel acquisitions (GRAPPA). Magn. Reson. Med. 2002;47:1202–1210 doi: 10.1002/mrm.10171.
5. Moeller S, Yacoub E, Olman CA, et al. Multiband multislice GE-EPI at 7 tesla, with 16-fold acceleration using partial parallel imaging with application to high spatial and temporal whole-brain fMRI. Magn. Reson. Med. 2010;63:1144–1153 doi: 10.1002/mrm.22361.
6. Jenkinson M, Beckmann CF, Behrens TEJ, Woolrich MW, Smith SM. FSL. NeuroImage 2012;62:782–790 doi: 10.1016/j.neuroimage.2011.09.015.
7. Smith SM, Jenkinson M, Woolrich MW, et al. Advances in functional and structural MR image analysis and implementation as FSL. NeuroImage 2004;23:S208–S219 doi: 10.1016/j.neuroimage.2004.07.051.
8. Woolrich MW, Jbabdi S, Patenaude B, et al. Bayesian analysis of neuroimaging data in FSL. NeuroImage 2009;45:S173–S186 doi: 10.1016/j.neuroimage.2008.10.055.
Figures