3378
Multi-echo line-scanning for ultra-high spatiotemporal resolution: optimal settings for BOLD sensitivity enhancement1Spinoza Centre for Neuroimaging, Amsterdam, Netherlands, 2VU University, Amsterdam, Netherlands, 3Experimental and Applied Psychology, VU University, Amsterdam, Netherlands, 4Radiology, University Medical Centre Utrecht, Utrecht, Netherlands
Synopsis
We present multi-echo line-scanning fMRI results in humans. The potential of this technique lies in the combination of both high spatial and temporal resolution while sacrificing spatial coverage outside the region of interest. We reached a 250 μm resolution along the line direction with a temporal resolution of ~100 ms. We compared BOLD sensitivity and tSNR of 5 different multi-echo acquisitions to select the optimal protocol, and three methods for echo combination. Although differences were small, the 5 echo protocol and tSNR-weighted combination were found to yield the highest BOLD sensitivity in a visual cortex ROI.
Introduction
Neurons with similar properties cluster together into sub-millimeter columnar and laminar structures and neural activity occurs at millisecond resolution. Usually, advances in fMRI approaches increase either the spatial or temporal resolution but not both. Recently, line-scanning fMRI in rodents1 achieved very high resolution across cortical depth (50 μm) and time (50 ms), by sacrificing volume coverage and resolution along the cortical surface. This high spatiotemporal resolution can also allow us to isolate microvessel responses and to characterize the distribution of blood flow and laminar fMRI profiles across cortical depth. Our first human line-scanning implementation still contained dead time within the TR, albeit with a single echo readout with minimized bandwidth2, hence permitting additional echo readouts with no need to increase the TR. The BOLD contrast is known to be maximal when the TE is equal to the local tissue T2* relaxation rate. However, when imaging at more TEs, the T2* signal decay curve can be measured, which can be used to disentangle BOLD-like (T2*) changes from non BOLD-like signal changes3. These can be caused by drift, motion, physiological noise or other contaminating signals that impact the initial signal intensity (S0) of the T2* decay curve. In addition, acquiring more echoes will improve the line-scanning efficiency and BOLD sensitivity4,5,6. In this work, we investigated five different multi-echo line-scanning protocols with different numbers of echoes and readout bandwidth whilst keeping the overall acquisition and repetition time (TR) constant, to determine the best set of parameters for a functional experiment in human visual cortex. In addition, we compared different echo combination approaches to assess the best strategy for multi-echo line-scanning in terms of BOLD sensitivity4,5.Methods
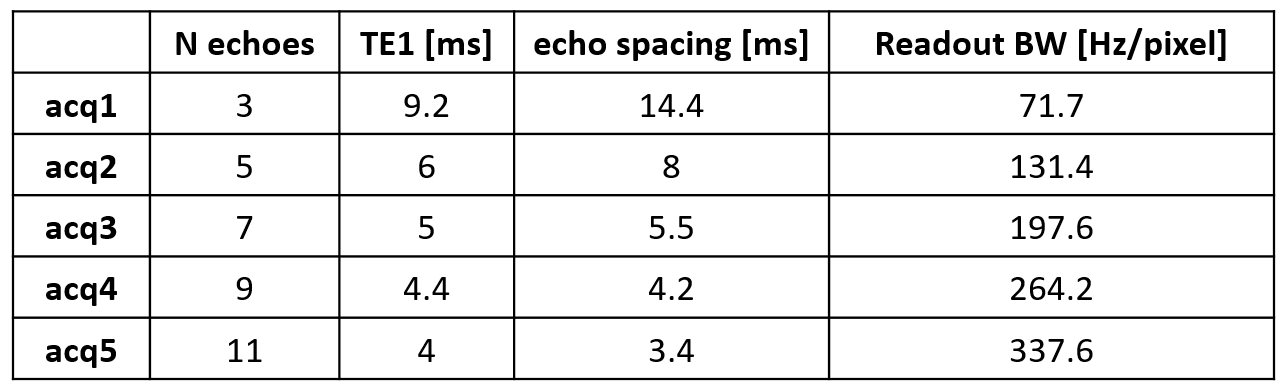
We scanned six healthy volunteers at 7T MRI (Philips) with a 32 channel receive surface coil7 positioned close to the visual cortex. Line-scanning data acquisition used a modified 2D multi echo-gradient-echo sequence where the phase-encoding in the direction perpendicular to the line was turned off1,2: line resolution=250μm, TR=105ms, flip angle=16°, array size=720, line thickness=2.5mm, in-plane line width=4mm, fat suppression using SPIR. Two saturation pulses (7.76 ms pulse duration) suppressed the signal outside the line of interest. Five different numbers of echoes were acquired, each with the last echo of the train with TE=38ms, adapting the readout bandwidth between different acquisitions. Details are provided in Figure1. The line was positioned as perpendicular to the cortex as possible. We acquired one run of functional data with each protocol, using a block design visual task consisting of a 20 Hz flickering checkerboard, presented for 10 s on/off. Runs lasted 5 minutes and 40 seconds. The 11 echoes acquisition runs were shortened for 4 subjects due to technical constraints and skipped for another one subject. Reconstruction was performed offline (MatLab, Gyrotools). We combined multi-channel coil data with temporal signal-to-noise ratio (tSNR) and coil sensitivity-weighted sum of squares (SoS) per echo2. Across echoes data were combined in 3 different ways: SoS, T2* fit and a tSNR weighted combination (wtSNR) based on Poser et al4. Functional data were analyzed using a GLM approach and t-statistic values (t-stats) were computed to identify active voxels. We compared the mean and maximum t-scores in a region of interest (ROI) between the 5 different acquisitions and the three echo combination methods and also calculated the tSNR value in the same ROI. The ROIs were defined as 11 voxels covering the gray matter area in a region showing significant activation for all acquisitions.Results
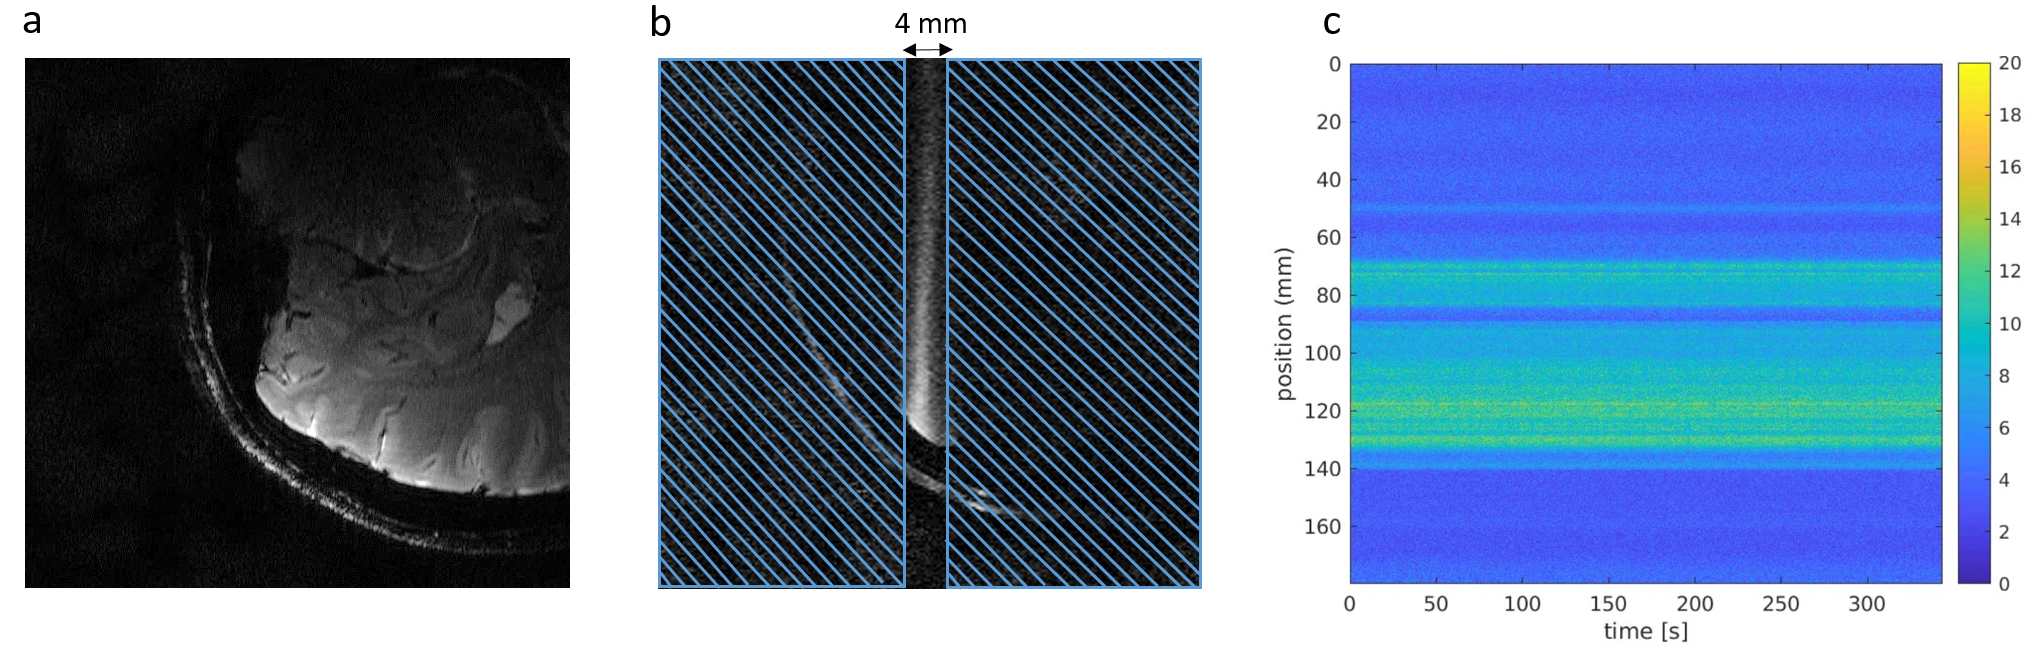
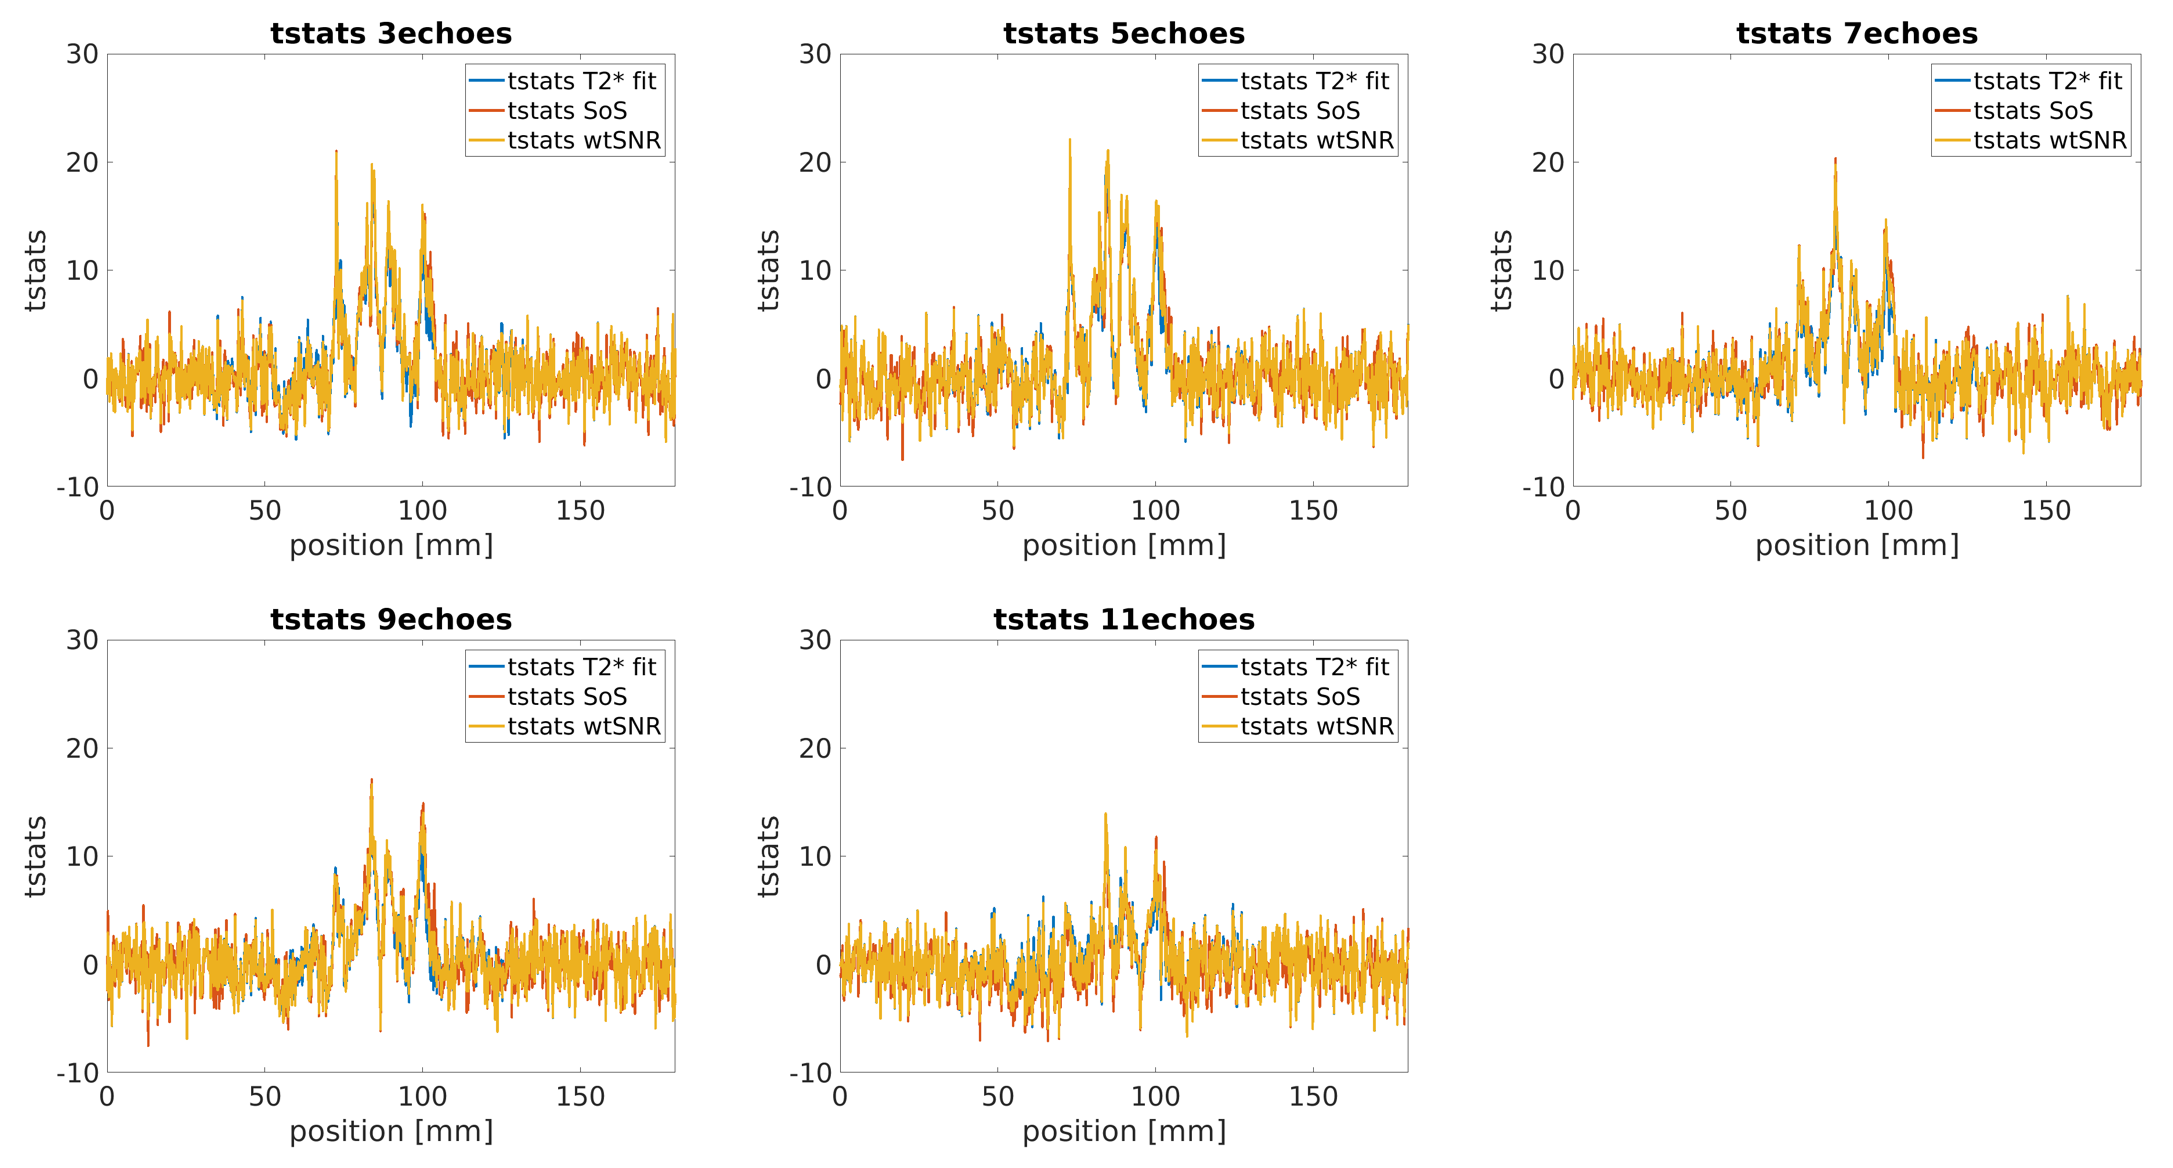
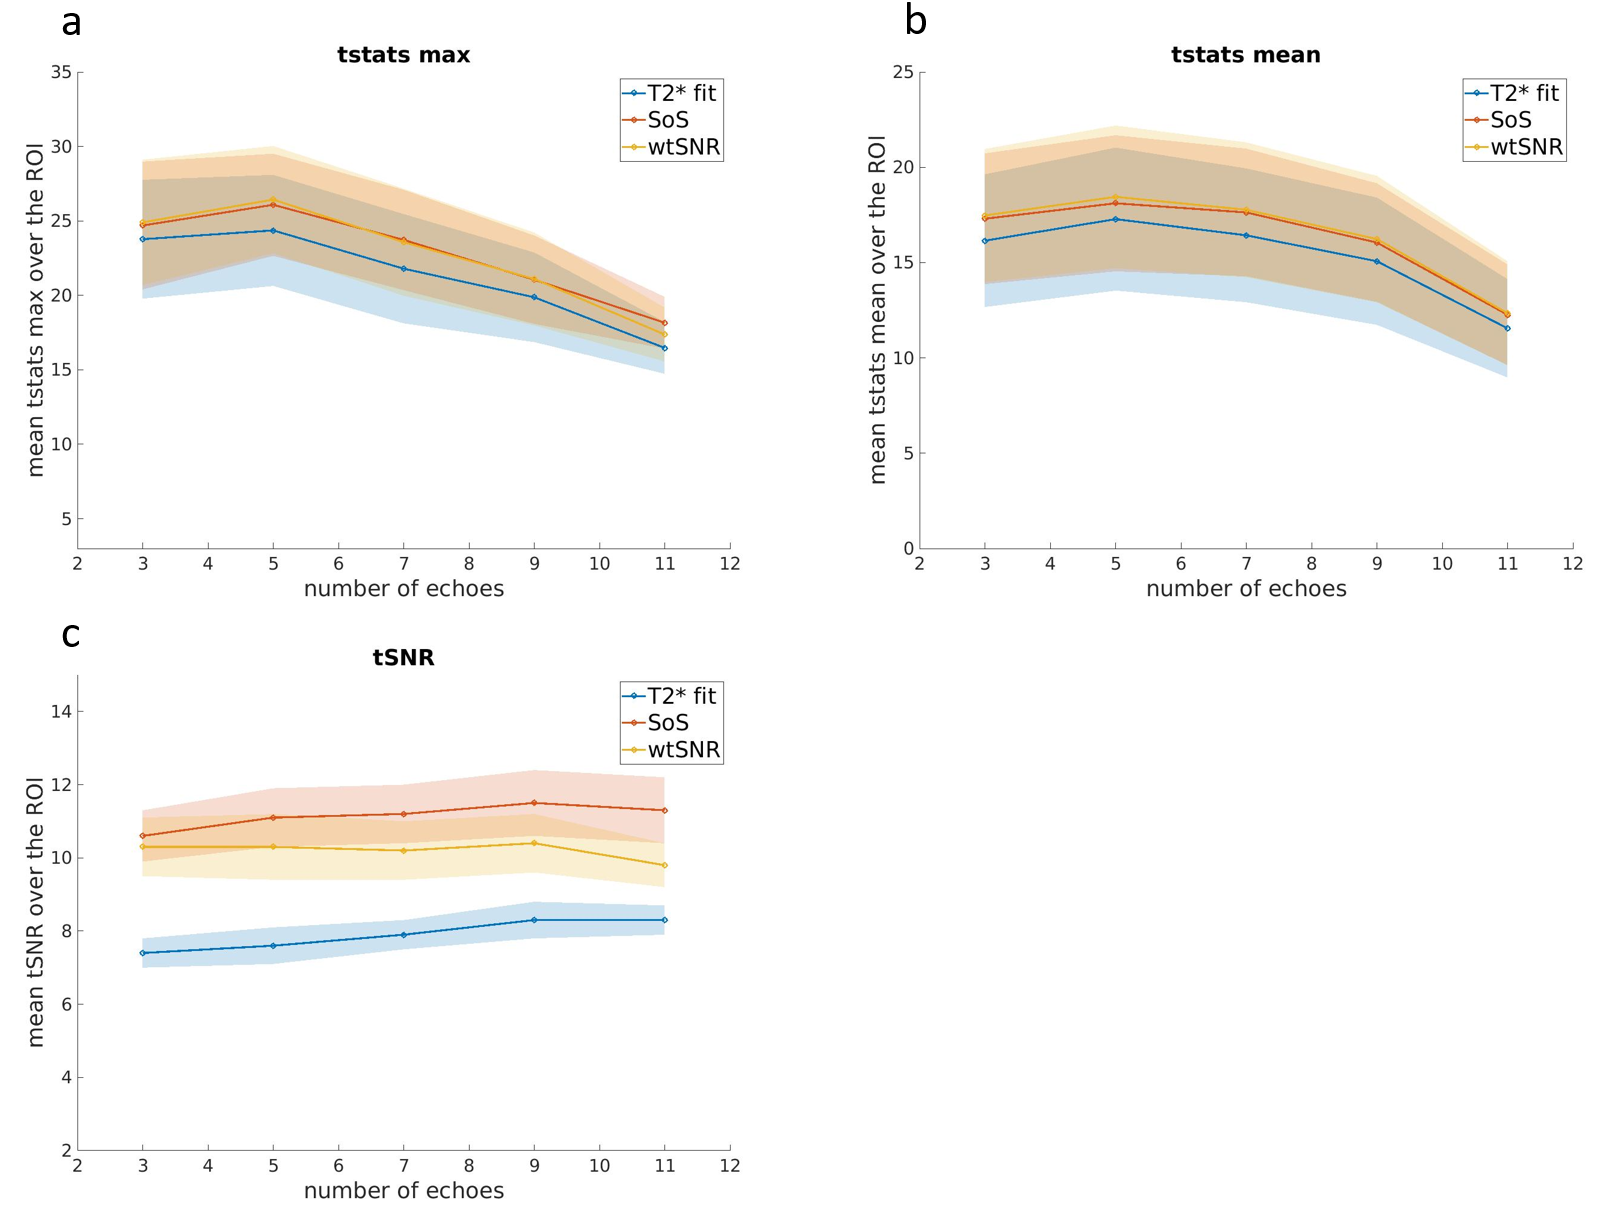
Figure 2 shows a multi-echo line dataset: the position of the line (2a), the line-scan signal distribution image (with saturation slabs) (2b) and finally an example of line-scanning acquisition. In Figure 3, the functional data of a representative subjects are shown. We evaluated t-stats for every echo combination method. As the echo combination methods use the same data, the variance is higher between acquisition types, than between echo combination methods. Averaging the values of maximum ROI t-stats and averaging the ROI t-stats over subjects we found significantly higher max and mean t-values for SoS and tSNR weighted echo combination compared to the T2* fit method (Student t-test, p<0.05) (Figure 4a and b). Regarding the mean tSNR in the ROI (Figure 4c), the SoS echo combination here gives slightly higher tSNR compared to the other two methods. We also observed that increasing the number of echoes leads to somewhat higher tSNR values for T2* fit and SoS echo combinations. Considering the optimal multi-echo version for functional line-scanning, acquisition nr2 with 5 echoes leads to the highest mean, as well as maximum t-stats values.Discussion & Conclusion
Line-scanning is a new powerful technique to detect BOLD signal at extremely high spatial and temporal resolution. Using a multi-echo version can strengthen the potential of line-scanning fMRI by enhancing the sensitivity to BOLD signal and distinguishing it from other contaminating signal components. Overall, the 5 echo line-scanning protocol yielded the highest values of t-stats for a functional experiment in human visual cortex. In addition, the SoS and tSNR-weighted echo combination allow significantly higher BOLD sensitivity compared to T2* fit echo combination method. Future experiments will examine physiological noise contributions and its removal in these multi-echo line-scanning data.Acknowledgements
This study was supported by the Royal Netherlands Academy of Arts and Sciences Research Fund 2018 (KNAW BDO/3489) and the Visiting Professors Programme 2017 (KNAW WF/RB/3781) granted to the Spinoza Centre for Neuroimaging.References
1. Yu, X., Qian, C., Chen, D. Y., Dodd, S. J., & Koretsky, A. P. (2014). Deciphering laminar-specific neural inputs with line-scanning fMRI. Nature Methods, 11(1), 55–58.
2. Raimondo, L., et al. ISMRM 2020, #3876.
3. Kundu, P., Voon, V., Balchandani, P., Lombardo, M. V., Poser, B. A., & Bandettini, P. A. (2017). Multi-echo fMRI: A review of applications in fMRI denoising and analysis of BOLD signals. NeuroImage, 154(March), 59–80.
4. Kundu, P., Inati, S. J., Evans, J. W., Luh, W. M., & Bandettini, P. A. (2012). Differentiating BOLD and non-BOLD signals in fMRI time series using multi-echo EPI. NeuroImage, 60(3), 1759–1770.
5. Poser, B. A., Versluis, M. J., Hoogduin, J. M., & Norris, D. G. (2006). BOLD contrast sensitivity enhancement and artifact reduction with multiecho EPI: Parallel-acquired inhomogeneity-desensitized fMRI. Magnetic Resonance in Medicine, 55(6), 1227–1235.
6.
Morgan, Andrew T Nothnagel, N., Petro, L. S., Goense, J., & Muckli, L. (2020). High-resolution line-scanning reveals distinct visual response properties across human cortical layers. Biorxiv.
7. Petridou, N., Italiaander, M., van de Bank, B. L., Siero, J. C. W., Luijten, P. R., & Klomp, D. W. J. (2013). Pushing the limits of high-resolution functional MRI using a simple high-density multi-element coil design. NMR in Biomedicine, 26(1), 65–73.
Figures