3375
Combining functional and structural information for optimal planning during ultrahigh temporal resolution line-scanning
Jurjen Heij1, Luisa Raimondo1, Jeroen C.W. Siero1,2, Serge O Dumoulin1,3, Wietske van der Zwaag1, and Tomas Knapen1,3
1Spinoza Centre for Neuroimaging, Amsterdam, Netherlands, 2Radiology, University Medical Centre Utrecht, Utrecht, Netherlands, 3Experimental and Applied Psychology, VU University, Amsterdam, Netherlands
1Spinoza Centre for Neuroimaging, Amsterdam, Netherlands, 2Radiology, University Medical Centre Utrecht, Utrecht, Netherlands, 3Experimental and Applied Psychology, VU University, Amsterdam, Netherlands
Synopsis
Depth-resolved
fMRI is an emerging field growing in popularity given the potential of
separating feedforward from feedback signals. When employing line-scanning
methods, we sacrifice coverage in order to sample BOLD-responses with ultra-high
temporal and spatial resolution. With a limited field-of-view being targeted,
one needs to know precisely where to place the line. Here we describe a multi-session
approach that combines functional and structural information for an optimal
acquisition of line-scanning data based on user-defined properties. We show its
feasibility of obtaining hemodynamic response functions of a specific cortical
patch.
Introduction
With ultrahigh field fMRI, we can target mesoscopic features of brain function, including laminar processing. To achieve sufficient spatial and temporal resolution to distinguish features of laminar BOLD responses, we recently implemented line-scanning fMRI1. In line-scanning, a single line is acquired with ~250 um resolution and ~100ms TR. The highly convoluted folding of the neocortex requires us to very precisely position the line, as it needs to be perpendicular to the cortical manifold to maximize effective laminar resolution2. To this end, we developed a framework which bases the planning of the line on functional (population receptive field4 parameters) and structural (minimal curvature) information. Such a strategy allows us to plan the line through a patch of cortex with distinct functional (e.g., visual field coverage, visual polar angle or eccentricity) and structural properties (e.g., laminae, curvature, or thickness), which greatly enhances the utility of the line-scanning data.Methods
The pipeline includes two different scan sessions at two different days (see Figure 1 for sequence parameter, Figure 2 for overview). In the first session, a high resolution MP2RAGE and 6-8 functional runs are acquired at 7T (Philips, Netherlands) using a 2 channel transmit and a 32 channel receive head coil (Nova Medical, Wilmington, MA, USA). The second session included a low-resolution MP2RAGE using 2 channels from the NOVA volume coil and line-scanning data using local receive coils. The line-scanning acquisition used a modified 2D gradient-echo sequence where the phase-encode gradients are removed and outer volume suppression (OVS) is used to suppress signal outside the line1. From the first session anatomy, the surface was reconstructed with FreeSurfer and a pRF-model was fit to preprocessed functional data. For all subjects, we selected a point-of-interest in the left hemisphere that had a minimal curvature with an eccentricity of 3 degrees of visual angle and a pRF r2 of at least 0.4, representing a location that performs foveal visual processing, is located on the posterior end of the calcarine sulcus3,4, and where signals are void of large draining veins effects. The second session started with a fast lower resolution anatomical scan. Immediately after this acquisition, the first session anatomical scan was registered to this low-resolution scan. The resulting matrix was applied to the selected best vertex and normal vector and the rotation/translation values were entered back in the MR-console to plan the line (Figure 3). Successful planning was confirmed by visual inspection. We used a hemifield visual stimulus to elicit positive and negative BOLD-responses for contralateral and ipsilateral visual stimulation, respectively5,6. Four 5-minute line-scanning runs were acquired with flashing checkerboard presented on left and right side in a randomized event-related design for 4 volunteers (Figure 5A). Fixation was confirmed with task to detect changes of shape in the fixation cross.Results
The positioning of the point was stable across the different spaces, indicating that the registration cascade was successful (Figure 3). The point-of-interest was inside or bordering the line in all participants, with the line almost perfectly perpendicular to the cortical band (Figure 4). To determine which voxels of the line belonged to grey matter, we assessed the cortical thickness at the vertex location (Figure 5B). After fitting Fourier-basis impulse response functions to the line data we observed a strong BOLD response in the left hemisphere following stimulation to the right visual hemifield (Figure 5C). Ipsilateral stimulation, however, evoked an expected negative BOLD-response only in a few cortical voxels per subject. As expected, positive BOLD responses increased towards the cortical surface. The exact localizations are yet to be determined using more accurate methods to estimate which voxels fall inside the cortical ribbon.Discussion
We present here a method to combine functional and structural data to increase the accuracy of planning and enrich the information obtained with line-scanning fMRI. Lines were successfully planned in the left hemisphere of all subjects and promising functional data was obtained. A hemifield experiment evoked a strong positive BOLD-effect in response to stimulation of the right visual field, while stimulation of the left visual field evoked more negative responses5,6. Despite these promising results, we aim to optimize the pipeline further with a variety of ways. Selecting positions somewhat further from the foveal representation might enhance the sensitivity and localization of the signal. Additionally, to increase the power we will incorporate the cortical thickness in the pipeline so that more voxels cover the cortical ribbon. We eventually aim to project various types of structural information into the line, such as laminar delineation (for precise delineation of gray matter voxels to estimate the HRF across cortical depth) and tissue segmentation (to create nuisance regressors).Conclusion
Line-scanning is a promising, emerging technique capable of acquiring functional MRI data at unprecedented spatiotemporal resolution at the cost of spatial coverage. This makes the acquisition tricky: where to position the line? Here we present a strategy that combines functional and structural information spanning multiple sessions to find an optimal coordinate to plan the line through. With a hemifield experiment, we obtained hemodynamic response functions in the cortical patch containing the point-of-interest using this strategy.Acknowledgements
This study was supported by the Royal Netherlands Academy of Arts and Sciences Research Fund 2018 (KNAW BDO/3489) and the Visiting Professors Programme 2017 (KNAW WF/RB/3781) granted to the Spinoza Centre for Neuroimaging.References
1. L. Raimondo, et al. (2020): (ISMRM). Sydney. #3876
2. Kay K, et al. (2019): Neuroimage. 189:847-869.
3. Engel SA, et al. (1994): Nature. 369:525.
4. Sereno M, et al. (1995): Science. 268:889-893.
5. Goense J, et al. (2012): Neuron. 76:629-639.
6. Jorge J, et al. (2018): Hum Brain Mapp. 39:2426-2441.
Figures
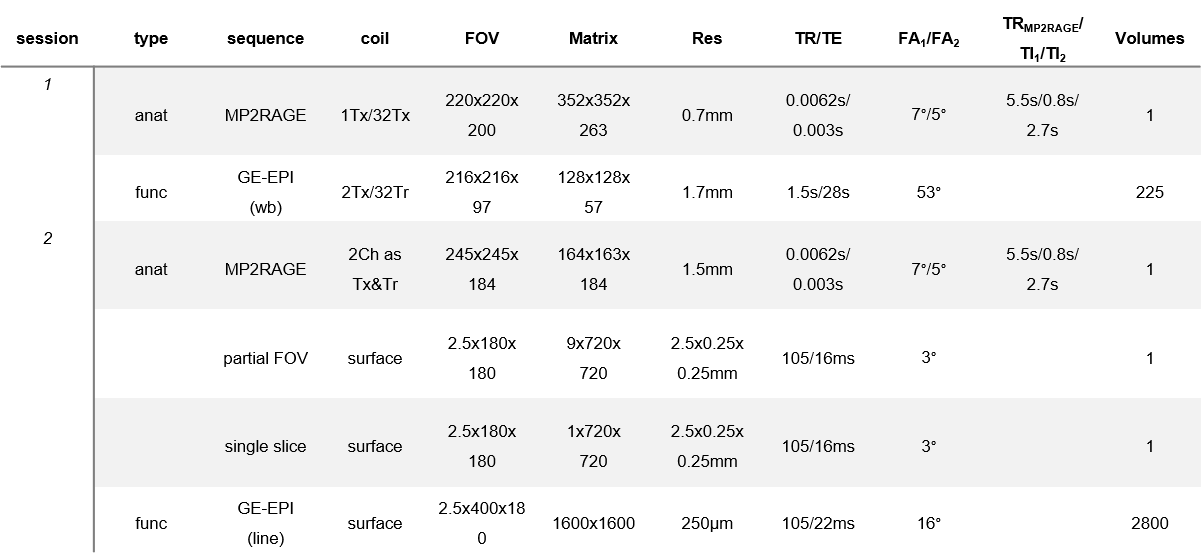
Figure 1. Acquisition parameters of sequences
used during the two sessions. The first session consisted of a high-resolution
anatomical scan and a pRF-mapping paradigm, while the second session consisted
of a lower resolution anatomical scan for registration purposes, partial and
single slice anatomical scan for reference, and the line scanning experiment.
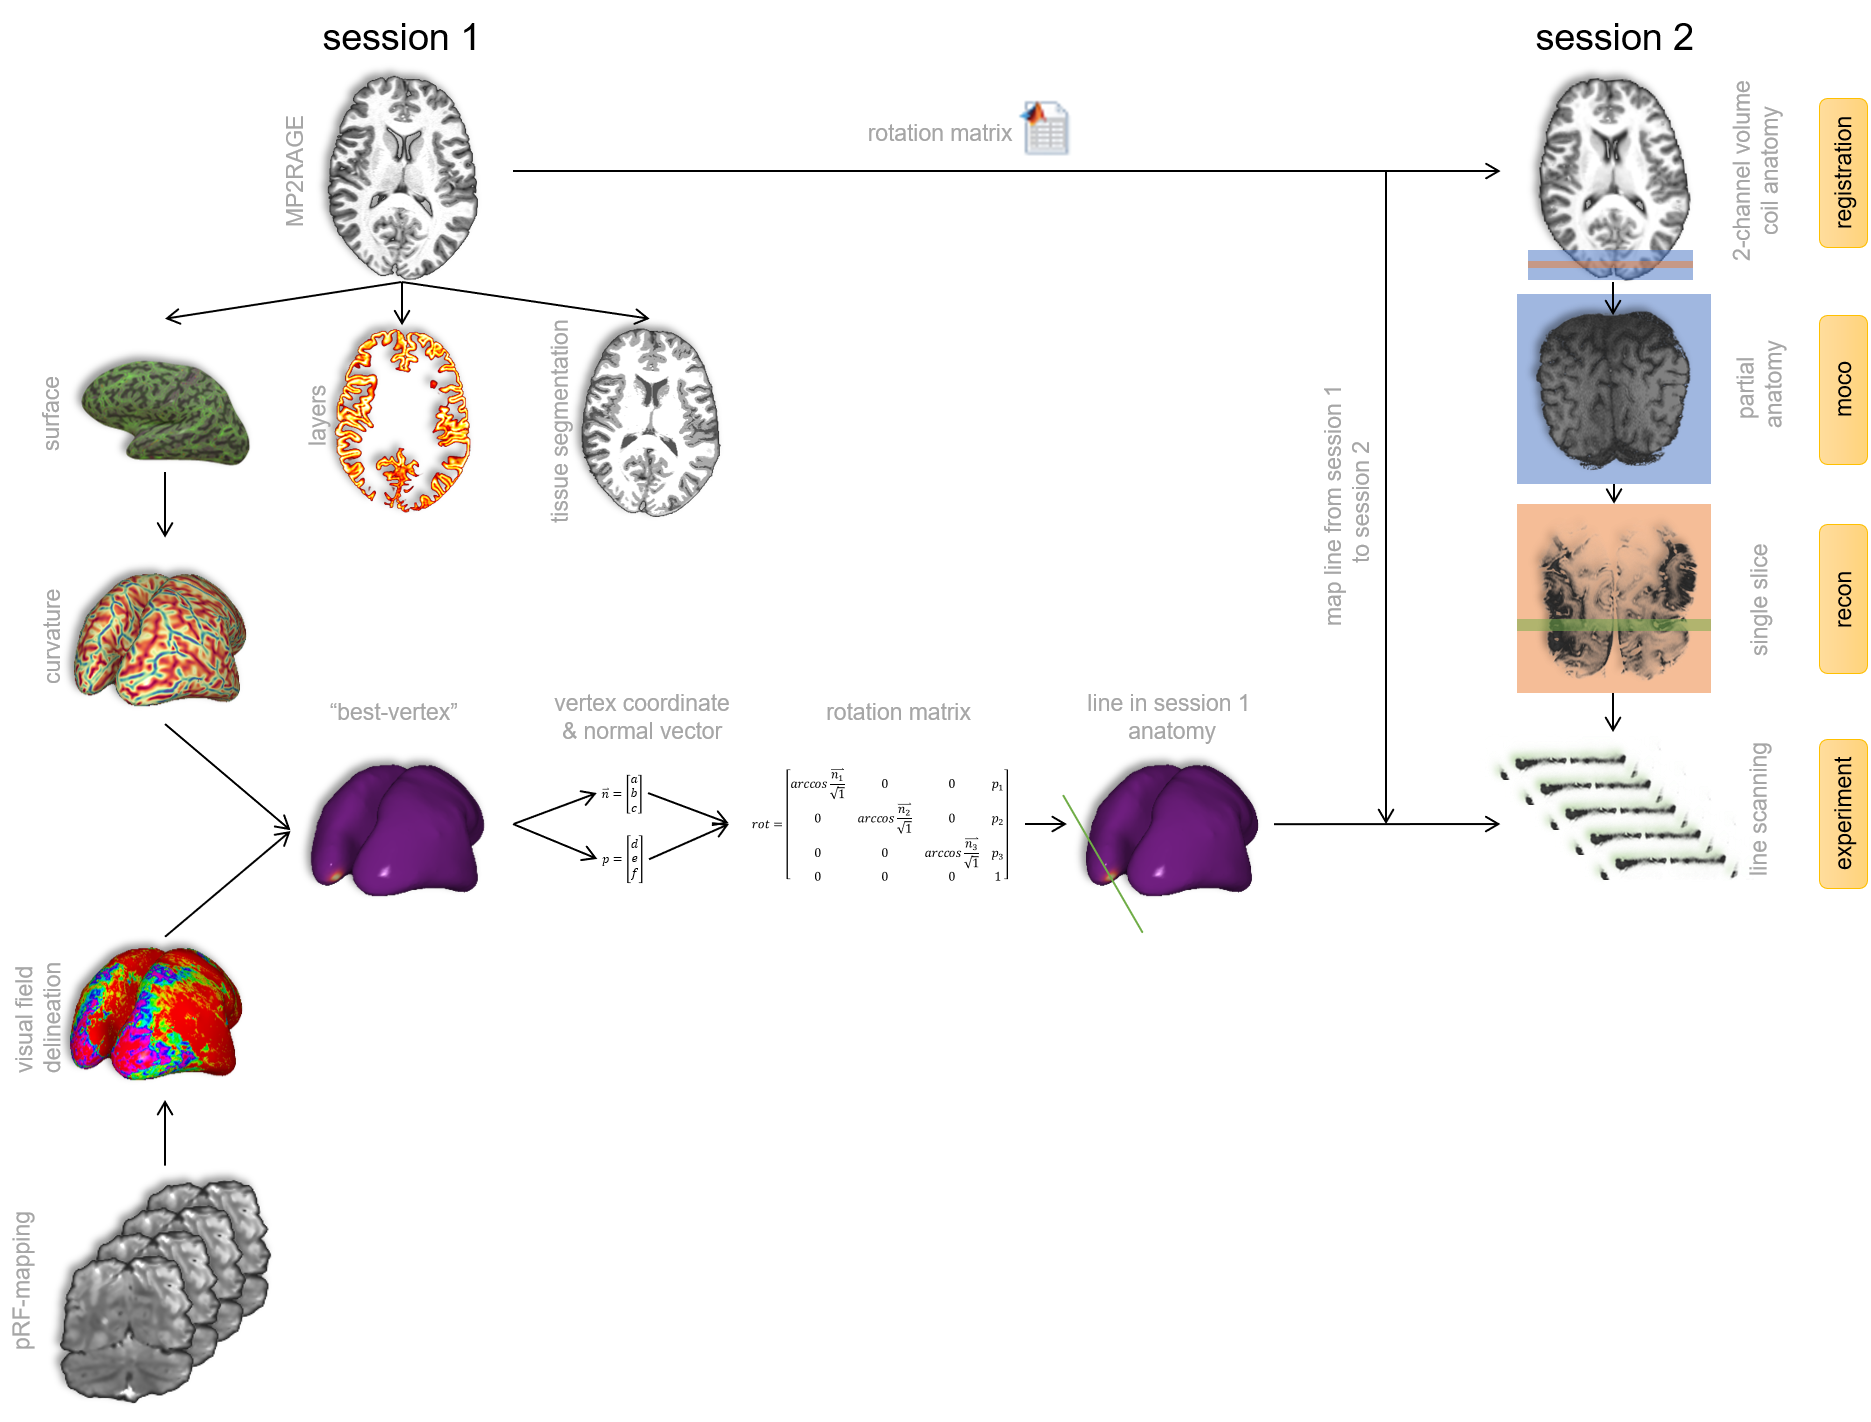
Figure
2. Acquisition and
processing workflow. Surface reconstruction and segmentations were
obtained from the first MP2RAGE. The best vertex was derived from pRF-data and
minimal curvature indices. A registration matrix between the MP2RAGE from
session 1 and session 2 was applied to our best vertex, resulting in the
optimal position in the second session.
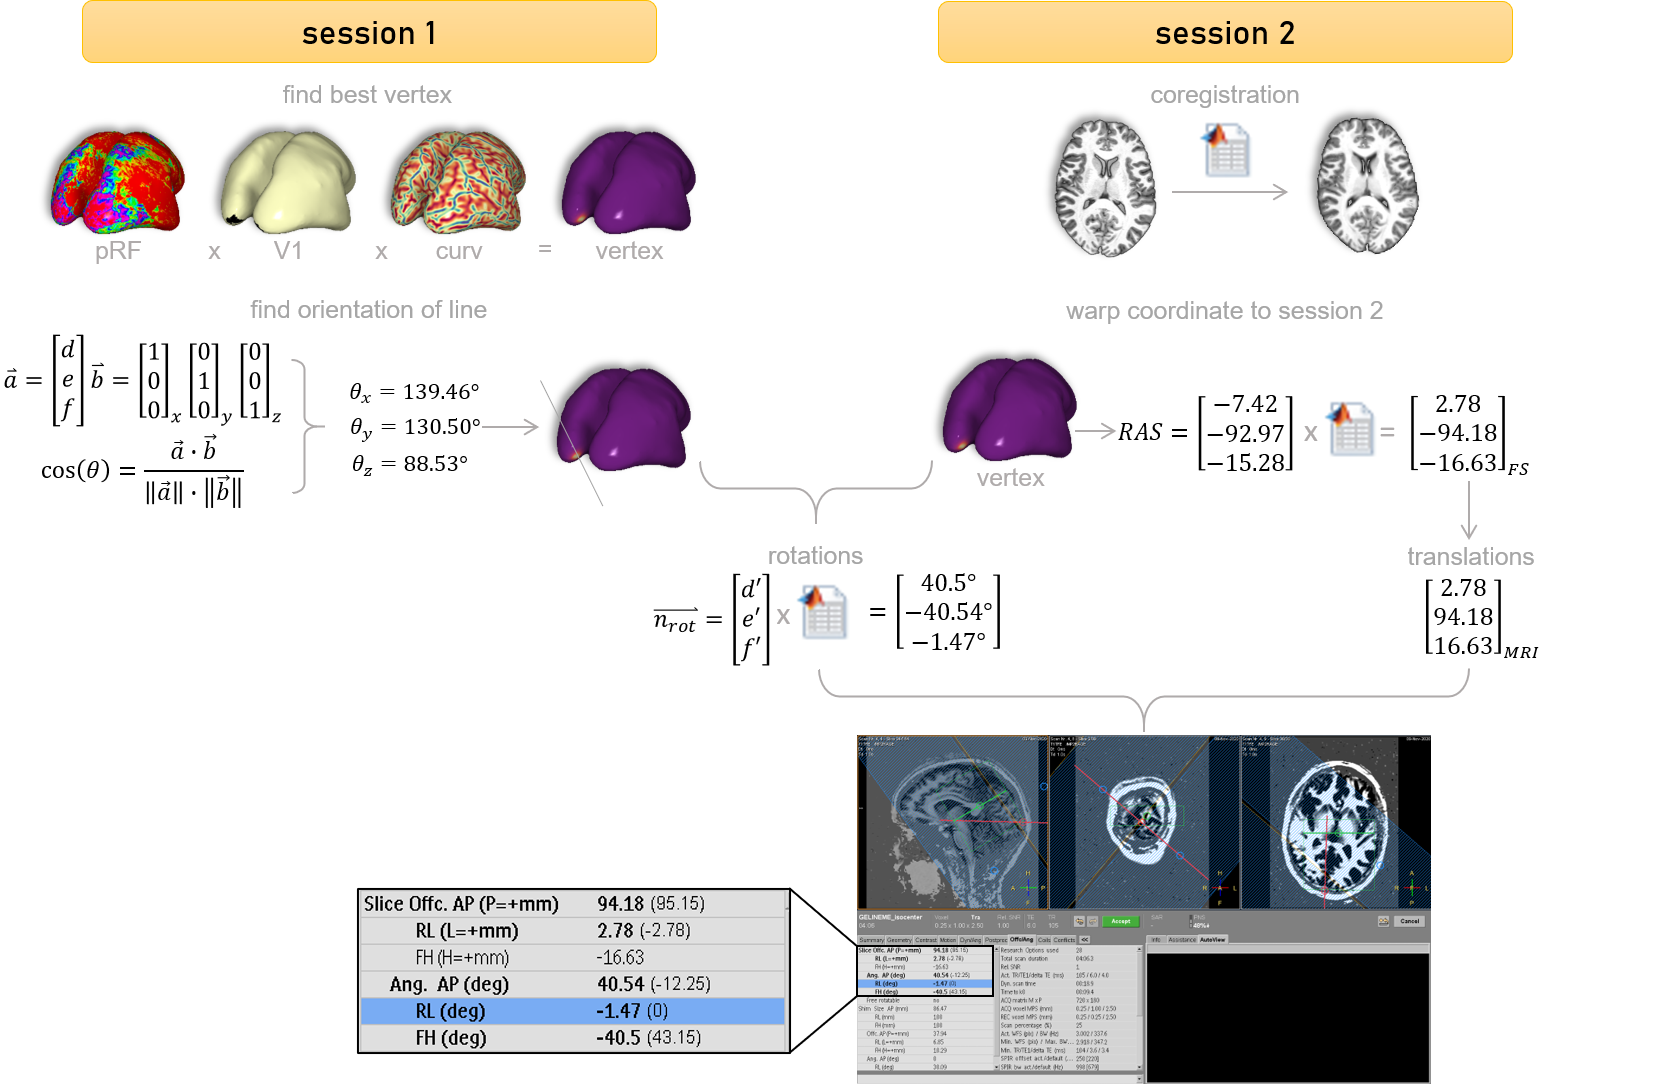
Figure 3. From surface to MR-console. The
vertex was determined based on pRF-parameters, a V1 mask, and the minimal
curvature. The angles were derived by calculating the angle with each cardinal
axis and the normal vector. Applying the matrix from session 1 to session 2
resulted in the appropriate values for the MR-console.
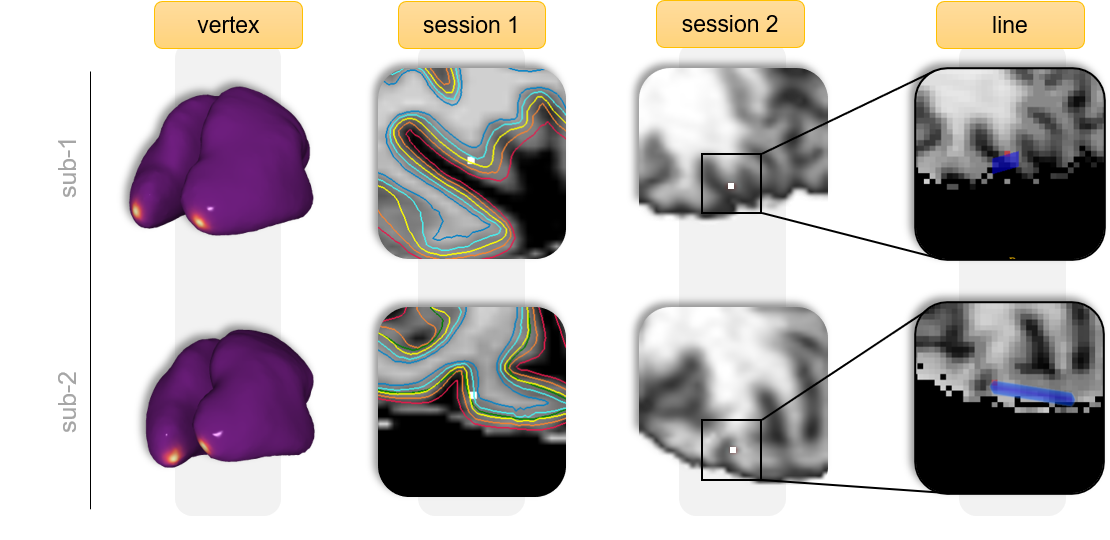
Figure 4. Vertex position across intra-subject
spaces. Two representative subjects illustrating the registration cascade to
warp the vertex from surface, to session 1, to session 2. Following the procedure
outlined in Figure 2, we calculated the angles of the normal with each cardinal
axis to obtain a line mostly perpendicular to the patch of cortex that
colocalized with the point-of-interest (neurological convention; subject left is on the left).
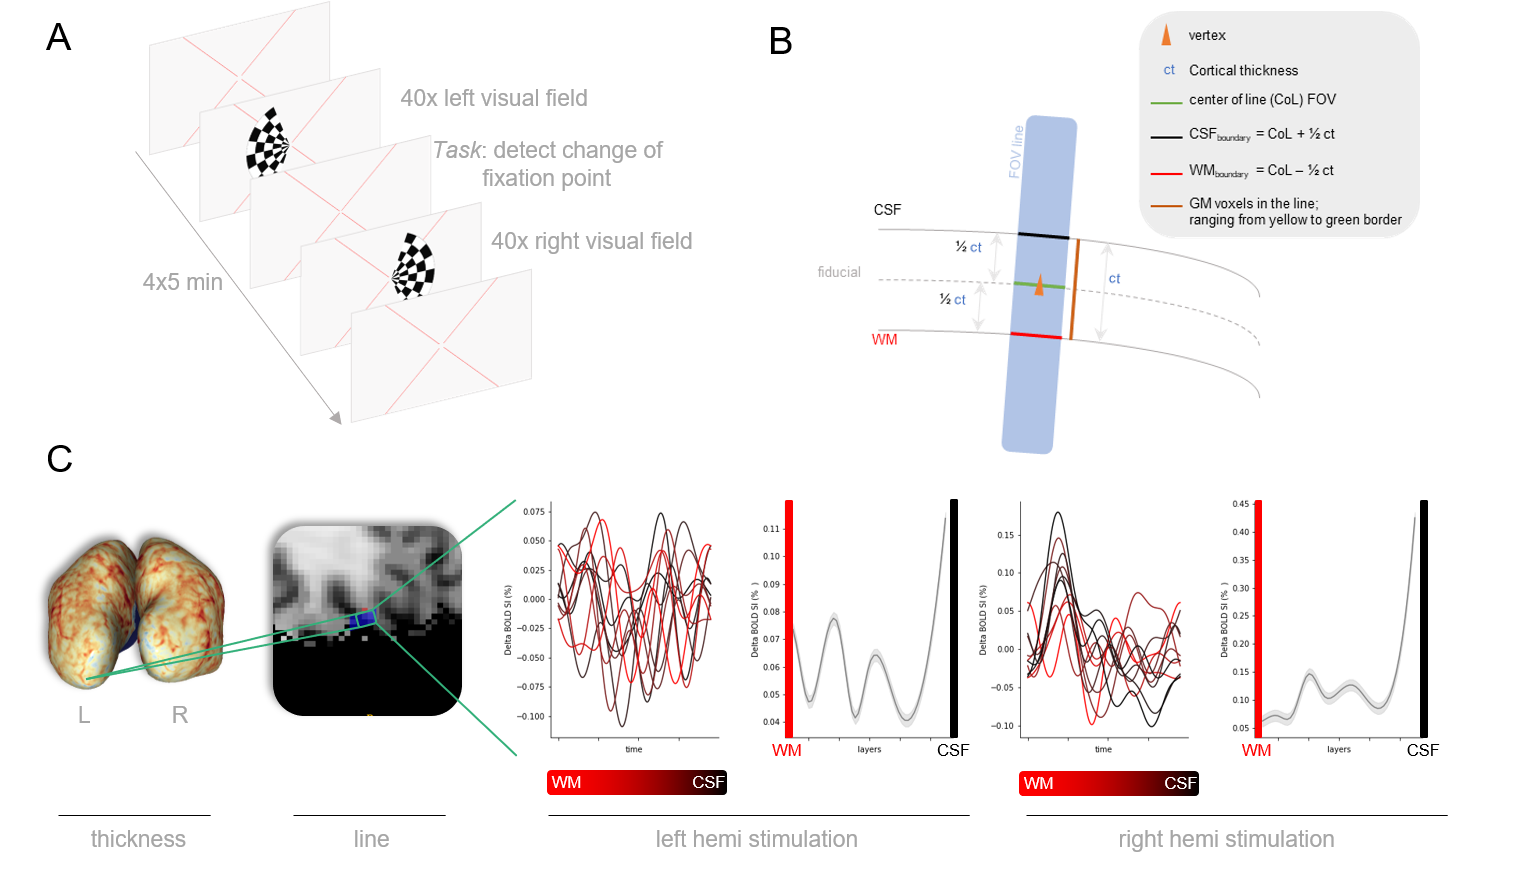
Figure 5. Hemifield experiment. (A) Experimental
paradigm for hemifield experiments. (B) Method to select line-voxels falling
inside the cortical gray matter ribbon. (C) HRF time courses and cortical depth
profiles from a representative subject, ordered from GM/WM border (red) to
GM/CSF (black).