3371
In vivo mapping of human locus coeruleus functional connectivity at 7T: a feasibility study1Laboratory of Alzheimer’s Neuroimaging and Epidemiology, IRCCS Istituto Centro San Giovanni di Dio Fatebenefratelli, Brescia, Italy, 2CIBM - Center for Biomedical Imaging, Ecole Polytechnique Fédérale de Lausanne, Lausanne, Switzerland, 3Systems Division, Swiss Center for Electronics and Microtechnology (CSEM), Nêuchatel, Switzerland, 4Human Neuroscience Platform, Fondation Campus Biotech Geneva, Geneva, Switzerland, 5Memory Clinic and LANVIE - Laboratory of Neuroimaging of Aging, University Hospitals and University of Geneva, Geneva, Switzerland, 6Department of Molecular and Translational Medicine, University of Brescia, Brescia, Italy, 7Division of Nuclear Medicine and NIMTlab, University Hospitals and University of Geneva, Geneva, Switzerland, 8Center for Mind/Brain Sciences, University of Trento, Trento, Italy
Synopsis
The locus coeruleus (LC) is a brainstem nucleus whose functional disruption may be an early signature of Alzheimer’s disease. Potentially due to its small size, mixed results exist about its functional connectivity to core memory, attention and salience networks. This limits a baseline definition for patient studies. Here we use high-resolution high-field resting-state fMRI to investigate the pattern of LC connectivity in healthy young subjects. Preliminary findings show positive correlations with the cerebellum and the frontal cortex. The default mode and frontoparietal networks, but not the salience network, show FC with the brainstem. Data acquisition is ongoing.
Introduction
The locus coeruleus (LC) is a brainstem nucleus that regulates cognition, vigilance, and arousal1. LC integrity is associated with memory function in normal aging2,3, and LC disconnection may contribute to memory impairment in Alzheimer’s Disease (AD)4. However, the assessment of LC functional connectivity in-vivo is complicated by its small size (~15-50 mm3), which makes it difficult to reliably discriminate the LC from other regions on conventional 3T MRI systems and to robustly assess correlations between the LC and cortical areas. These issues may in part account for the heterogeneity of previous results, some reporting that the LC is functionally connected with default mode network (DMN) regions4 and others reporting connectivity with the frontoparietal (FPN) or salience (SN) networks5,6.Ultra-high field (7T) fMRI may overcome these limitations thanks to its enhanced functional contrast-to-noise ratio, which can be traded for higher spatial resolution. In this study, we aimed to assess the pattern of LC functional connectivity in a sample of healthy adults using 7T MRI.
Methods
Participants: Eight young healthy volunteers (age: 23+3y, education: 16+3y, sex: 3f/5m) underwent MRI on a 7T Siemens Magnetom scanner, including the following sequences: resting-state functional MRI (rs-fMRI; TE=26ms, TR=1550ms, flip angle=63°, voxel size: 1.3x1.3x1.4mm, 93 slices, 250 volumes), magnetization transfer (MT7: TE=4ms, TR=538ms, flip angle=8°, voxel size=0.4x0.4x0.5mm, 60 slices, 2 averages), and a T1-weighted anatomical scan (MP2RAGE: TE=2ms, TR=6000ms, flip angle=7°/5°, voxel size = 0.6x0.6x0.6mm, 256 slices).Preprocessing: Rs-fMRI data pre-processing included the removal of the first 5 volumes, Marchenko-Pastur principal component analysis denoising8, motion correction with MCFLIRT (part of FSL), susceptibility-induced distortions correction with TOPUP (FSL) by concatenating rs-fMRI images acquired with opposite polarities, spatial smoothing (2mm FWHM filter), removal of motion artifacts with ICA-AROMA (FSL), regression of white matter (WM) and cerebrospinal fluid (CSF) signal, linear detrending and high-pass filtering (0.01Hz). CSF and WM masks were extracted from the anatomical scans with FAST (FSL).
Seed connectivity analysis: A study-specific LC ROI was used for the connectivity analysis. The ROI was created from the MT data using the antsMultivariateTemplateConstruction function of the Advanced Normalization Tools (ANTs) software and a semi-automated threshold-based method9, as previously described10. The seed ROI was registered to individual EPI images using a combination of rigid, affine and non-linear transformations with ANTs (antsRegistrationSyN) and FSL. Individual anatomical images were used as an intermediate step for the registration between the MT space and rs-fMRI space. Pearsons’ linear correlation between the BOLD signal in the seed and the BOLD signal in all the other brain voxels was computed. Correlation r coefficients were transformed into z scores using Fisher’s transformation. One sample test was used to extract the corresponding LC connectivity map (non parametric test, FSL’s randomise; p<0.01 uncorrected).
The seed connectivity analysis was verified i) using an independent 7T LC atlas11 and ii) assessing whether the DMN, FPN and SN showed connectivity with the brainstem. To this aim, we used previously published DMN, FPN and SN spatial maps12 as seeds to extract the whole brain connectivity map.
Results
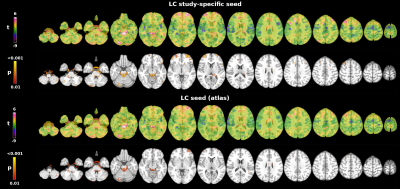
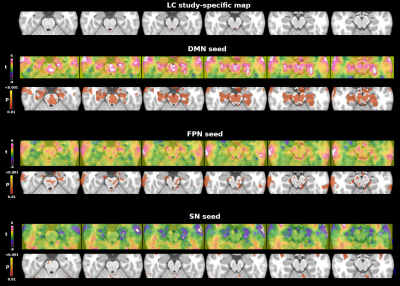
Whole brain tSNR increased on average by 129+14% after denoising and motion correction, brainstem tSNR by 152+15%. The tSNR in the brainstem was on average 13+7% lower than in the rest of the brain. Figure 1 shows the mean LC connectivity map using the custom LC ROI and a 7T LC atlas. Both seeds showed consistent results: positive correlations with the brainstem, the cerebellum, the bilateral dorsolateral and prefrontal cortex. Figure 2 shows the functional connectivity between each network (DMN, FPN and SN seeds) and the brainstem. The DMN showed the strongest connectivity pattern, including positive correlations with the ventral tegmental area, the pedunculopontine nucleus, the pontis oralis, and areas close to the rostral LC. The FPN showed a less pronounced connectivity pattern, involving mainly the cerebral peduncle with no clear involvement of brainstem nuclei. Finally, the SN showed no functional connectivity with brainstem regions.Discussion and Conclusions
In-vivo assessment of functional LC connectivity with high-resolution high-field fMRI has the potential to provide insights into the earliest pathological changes in AD and other neurological diseases. To the best of our knowledge, this is one of the few full-brain 7T functional connectivity LC studies13. Consistently with previous studies, our preliminary 7T results show a distributed pattern of positive correlations with the frontal cortex and the cerebellum, yet not clearly associated with previously reported core cognitive networks (DMN, FPN or SN). Interestingly, the DMN and FPN, but not SN, showed distinct connectivity patterns in the brainstem, sometimes close to our LC mask in the case of the DMN. Further work is needed to evaluate potential misregistrations between anatomical LC masks and functional data in a larger group. Data acquisition is ongoing to evaluate LC connectivity in clinical populations, including cognitively normal elderly and patients with AD and other neurodegenerative diseases.Acknowledgements
This work was supported by the Swiss National Science Foundation (grant SNF 320030_169876) and EU Horizon (grant 667375). This work was made possible thanks to the CIBM Center for Biomedical Imaging, founded and supported by Lausanne University Hospital (CHUV), University of Lausanne (UNIL), Ecole Polytechnique Federale de Lausanne (EPFL), University of Geneva (UNIGE) and Geneva University Hospitals (HUG).References
1. Betts MJ, Kirilina E, Otaduy MCG, et al. Locus coeruleus imaging as a biomarker for noradrenergic dysfunction in neurodegenerative diseases. Brain. 2019 Sep 1;142(9):2558-2571.
2. Dahl MJ, Mather M, Düzel S, et al. Rostral locus coeruleus integrity is associated with better memory performance in older adults. Nat Hum Behav. 2019 Nov;3(11):1203-1214.
3. Hämmerer D, Callaghan MF, Hopkins A, et al. Locus coeruleus integrity in old age is selectively related to memories linked with salient negative events. Proc Natl Acad Sci U S A. 2018 Feb 27;115(9):2228-2233.
4. Jacobs HI, Wiese S, van de Ven V, et al. Relevance of parahippocampal-locus coeruleus connectivity to memory in early dementia. Neurobiol Aging. 2015 Feb;36(2):618-26.
5. Bär KJ, de la Cruz F, Schumann A, et al. Functional connectivity and network analysis of midbrain and brainstem nuclei. Neuroimage. 2016 Jul 1;134:53-63.
6. Serra L, D'Amelio M, Di Domenico C, et al. In vivo mapping of brainstem nuclei functional connectivity disruption in Alzheimer's disease. Neurobiol Aging. 2018 Dec;72:72-82.
7. Priovoulos N, Jacobs HIL, Ivanov D, et al.
High-resolution in vivo imaging of human locus coeruleus by magnetization transfer MRI at 3T and 7T. Neuroimage. 2018 Mar;168:427-436.
8. Ades-Aron B, Lemberskiy G, Veraart J, et al. Improved Task-based Functional MRI Language Mapping in Patients with Brain Tumors through Marchenko-Pastur Principal Component Analysis Denoising. Radiology. 2020 Dec 8:200822.
9. Chen X, Huddleston DE, Langley J, et al. Simultaneous imaging of locus coeruleus and substantia nigra with a quantitative neuromelanin MRI approach. Magn Reson Imaging. 2014 Dec;32(10):1301-6.
10. Pievani M, Jelescu IO, Jorge J, et al. In-vivo imaging the locus coeruleus integrity at ultra-high field: a feasibility study. AAIC 2020 conference.
11. Ye R, Rua C, O'Callaghan C, et al. An in vivo probabilistic atlas of the human locus coeruleus at ultra-high field. Neuroimage. 2020 Oct 24;225:117487.
12. Shirer WR, Ryali S, Rykhlevskaia E, et al. Decoding subject-driven cognitive states with whole-brain connectivity patterns. Cereb Cortex. 2012 Jan;22(1):158-65.
13. Jacobs HIL, Müller-Ehrenberg L, Priovoulos N, Roebroeck A. Curvilinear locus coeruleus functional connectivity trajectories over the adult lifespan: a 7T MRI study. Neurobiol Aging. 2018 Sep;69:167-176.
Figures

