3368
Temporal deviant detection in human auditory cortex using high-field fMRI1Faculty of Psychology and Neuroscience, Maastricht University, Maastricht, Netherlands, 2Maastricht Centre for Systems Biology, Maastricht University, Maastricht, Netherlands
Synopsis
Layer-fMRI probes the mesoscopic neural architecture in humans non-invasively. We studied the behavioral relevance of layer-specific processing by investigating temporal deviance detection in the auditory system. Preliminary results indicate increased response in superficial layers to a temporal deviant, in line with a feedback signal entering superficial layers during deviant detection.
Introduction
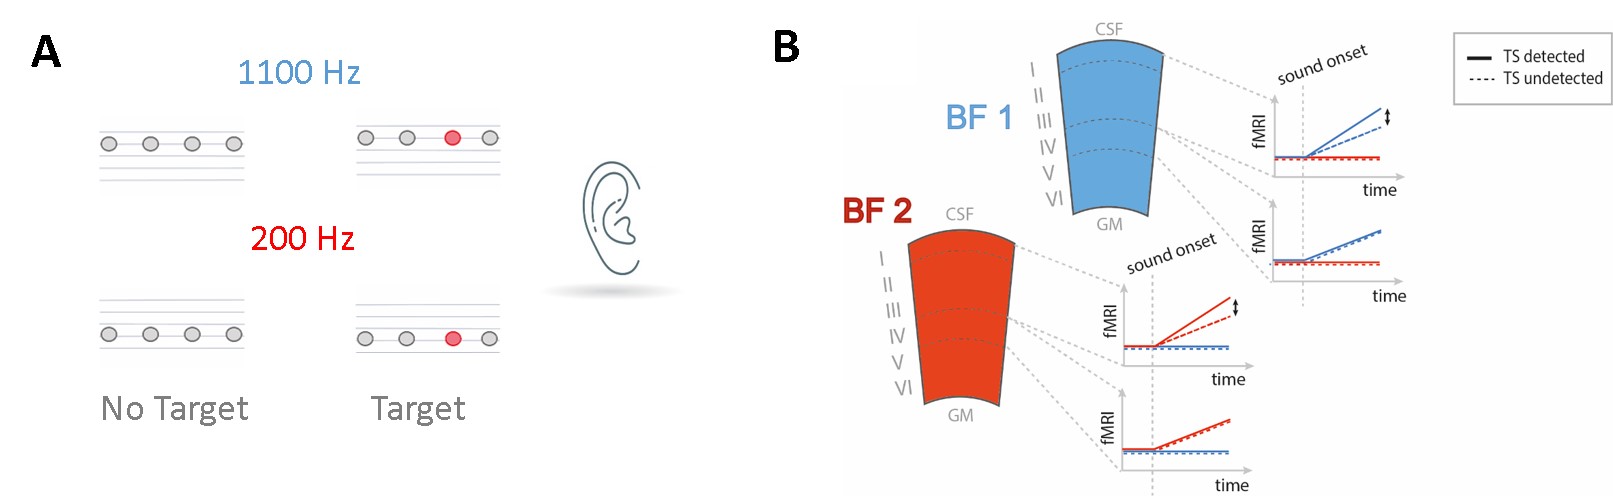
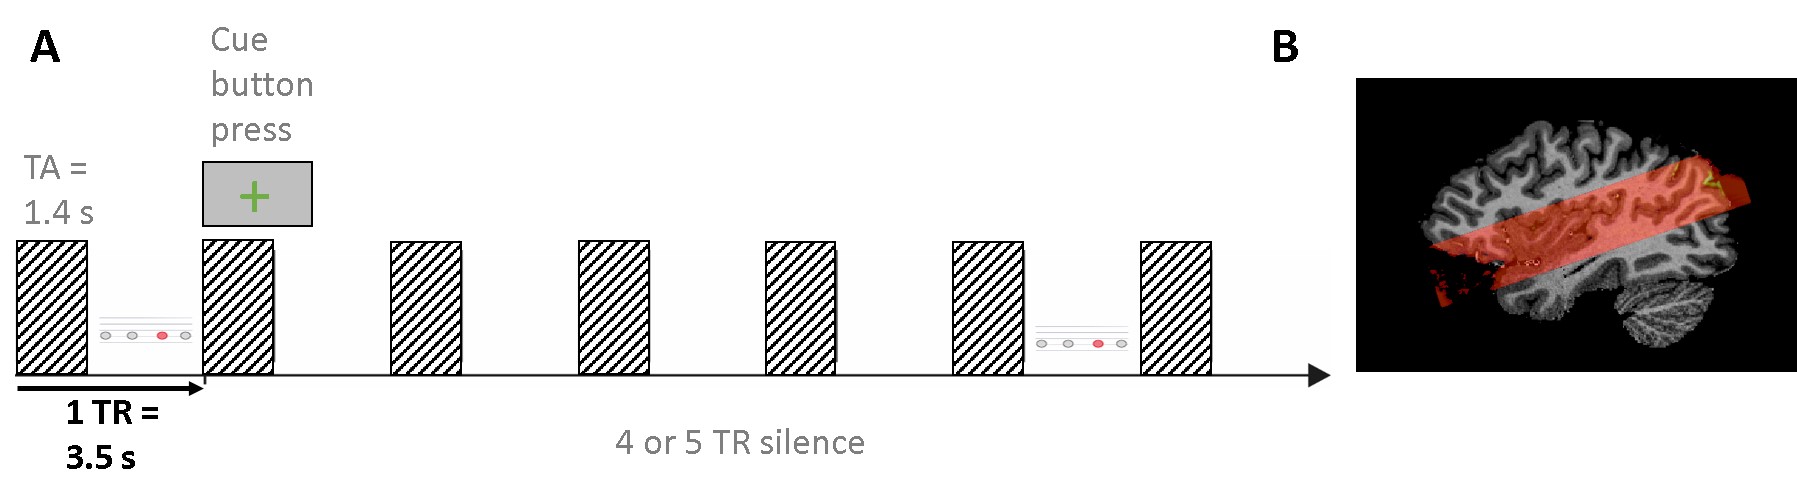
The brain creates predictions about upcoming sensory events. Standard predictive coding theory postulates that predictions are fed back from higher to lower cortical areas (Heilbron et al.,2018). The Mismatch Negativity (MMN) is an electrophysiological response found when a deviant stimulus is embedded in a predictable stream of sensory input. The MMN is a classic example of an active prediction mechanism, as it depends on the comparison to preceding stimuli. In primary auditory cortex (PAC) mismatch responses to omitted tones are spectrally specific (Berlot et al. 2018). ‘What’ predictions should be distinguished from ‘when’ predictions (Auksztulewicz et al., 2018; Wollman et al., 2018). Notably, the combination of both leads to the largest RT benefits in spectral tasks, whereas when predictions alone do not lead to a behavioral advantage. On a neural level, Auksztulewicz et al. (2018) argue that the superior temporal gurus (STG) is sensitive to a combination of what and when predictability, where fulfilled temporal predictions modulate a spectrally-specific content prediction in the auditory cortex. How the mesoscopic cortical network is involved in processing predictions, generating prediction errors, and processing the behavioral relevance of a deviant stimulus is unknown. Incoming feedforward activity is assumed to preferentially target middle layers of the cortex, while (predictive) feedback is assumed to preferentially target either superficial or deeper layers or both. In line with this, a recent study in monkeys has shown that the MMN in response to spectral deviants is localized in superficial layers in PAC (Lakatos et al. 2020). Interestingly, the observed response was spectrally unspecific (up to 4 octaves away from the spectral deviant). Here, we probe this circuitry and the behavioral relevance of mismatch responses using layer-fMRI. We presented monotonous narrow-band rhythmic sequences at 2 Hz. Some sequences contained a difficult-to-detect temporal deviant, allowing us to contrast detected and undetected trials, while the feedforward mismatch input remained the same. Figure 1 shows stimuli (Fig 1A), (layer-) specific hypotheses (Fig 1B). Figure 2 provides information on data acquisition.Methods
Scanning was performed on a SIEMENS whole-body 7T Magnetom scanner at the Maastricht Brain Imaging Center.Stimuli & Psychophysics: The periodic sequences we use, lead to a sensitivity and reaction time benefit over aperiodic sequences (Heynckes et al. 2020). Prior to scanning, participants' 50% target detection threshold was determined (using a staircase). Task difficulty was adjusted during scanning after every run, by changing the size of the temporal shift in order to maintain approximatively 50% correct detection. As we previously showed that carrier frequency has an effect on target detection (Heynckes et al. 2020), the temporal shift was modulated independently for the high and low carrier sounds used in the experiment.
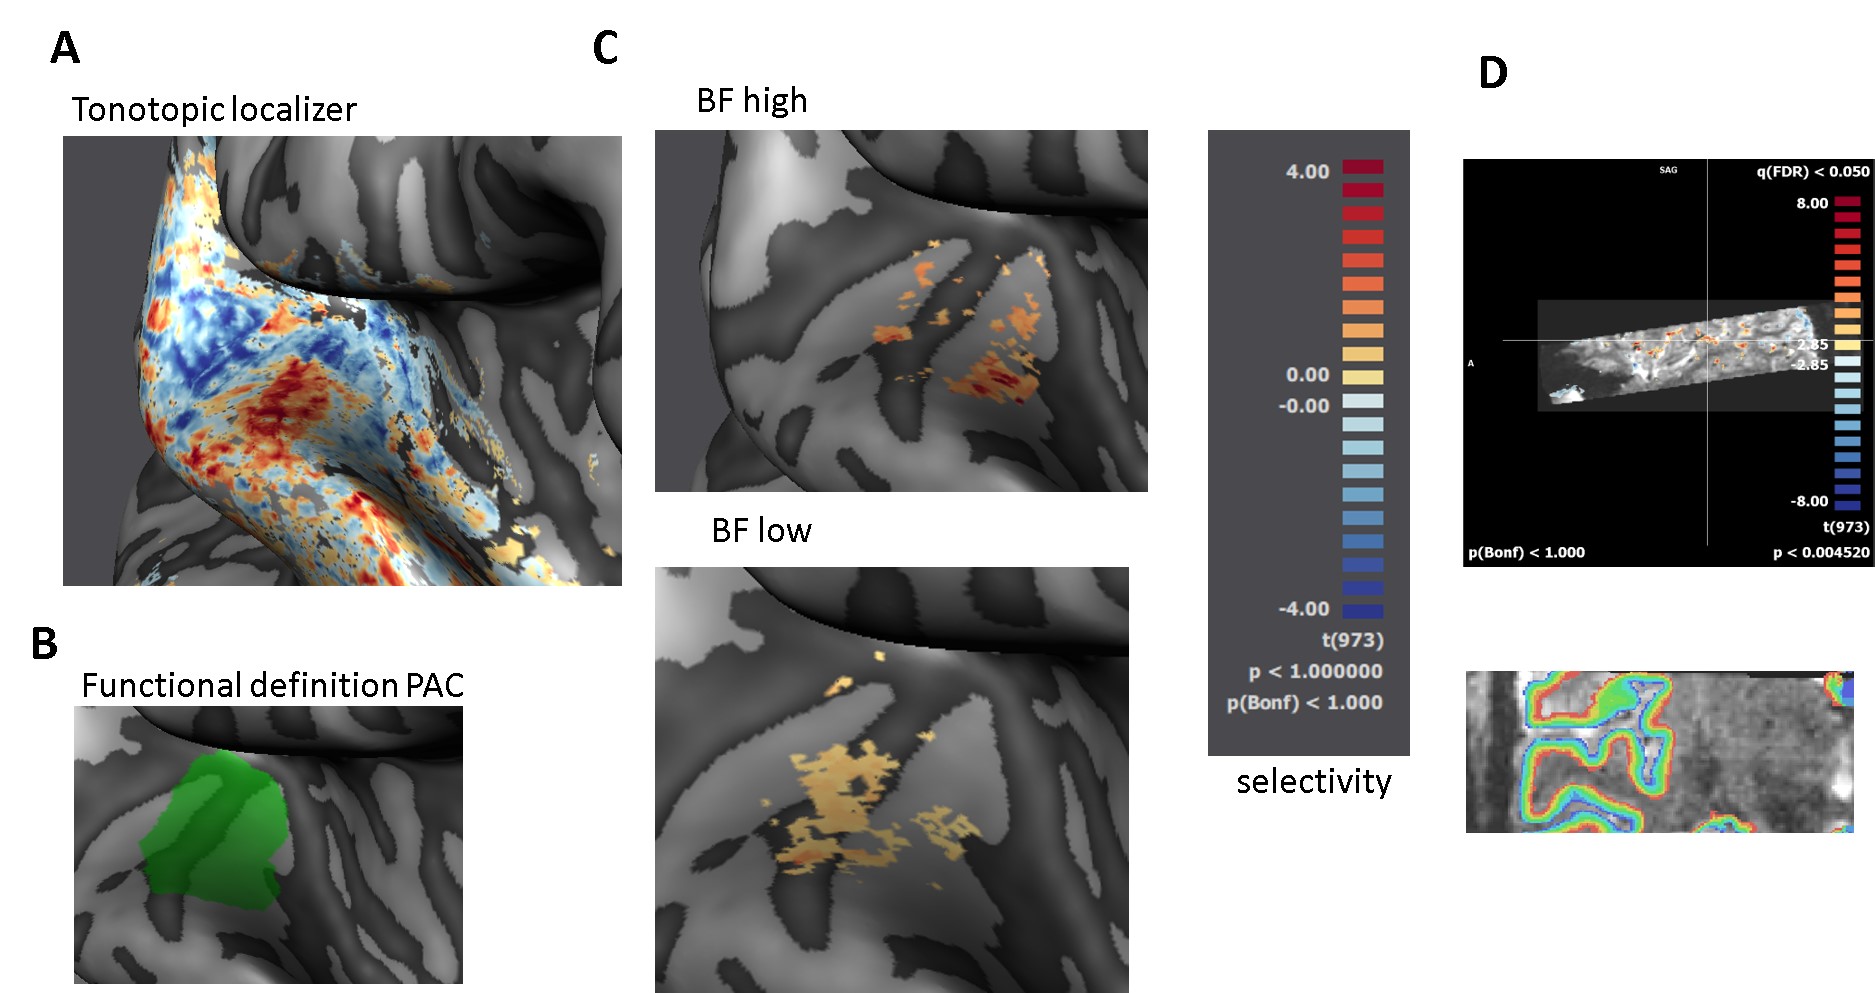
Scanning: Main experiment: resolution = 0.8mm iso, TR = 3.5s (TA = 2.4s, 1.1s silent gap), 2D-GE-BOLD, FOV = 160x160, GRAPPA = 3, multiband =2, partial Fourier = 6/8, matrix size 200 X 200; slices = 38, 3-6 runs per participant. Tonotopy: resolution = 1.2mm iso, TR = 2.6s (TA = 1.4s, 1.2s silent gap), 2D-GE-BOLD, FOV = 163x163, GRAPPA = 2, multiband =2, partial Fourier = 6/8, matrix size 136X 136; slices = 46, 1 run. Anatomy: resolution = 0.65 mm iso, MP2RAGE Data pre-processing: We used standard pre-processing steps in BrainVoyager. We used tools in SPM, FSL, BrainVoyager and ITK snap for GM/WM segmentation. Cortical depth was sampled by measuring cortical thickness and creating 11 relative cortical depth meshes using the equi-volume approach (Fig. 3D; Waehnert et al., 2014).
Mapping frequency preference (tonotopy): All analyses were restricted to the anatomically defined bilateral temporal cortex. After creating tonotopic maps (Fig 3A) (Formisano, 2003), regions of interest (ROI) were created responding preferentially to the high and low carrier frequency in the main experiment (Fig 3C). The relative response strength of best versus non-preferred frequencies yielded a frequency selectivity index (Fig 3C).
Sampling detected and undetected trials: Within the ROIs, we sampled layer responses to the sounds in the main experiment. We performed a GLM with predictors for the carrier frequency (high or low), the presence of the target (target or no-target) and the behavioral response (detected and undetected). We coded each trial separately in order to subsequently bootstrap the mean response to detected and undetected trials (n = 100). The layer responses to detected and undetected trials (for low and high carrier frequency) were averaged across participants (within the same functionally defined ROI).
Results and Discussion
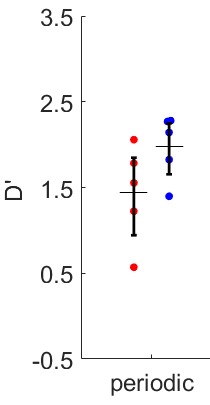
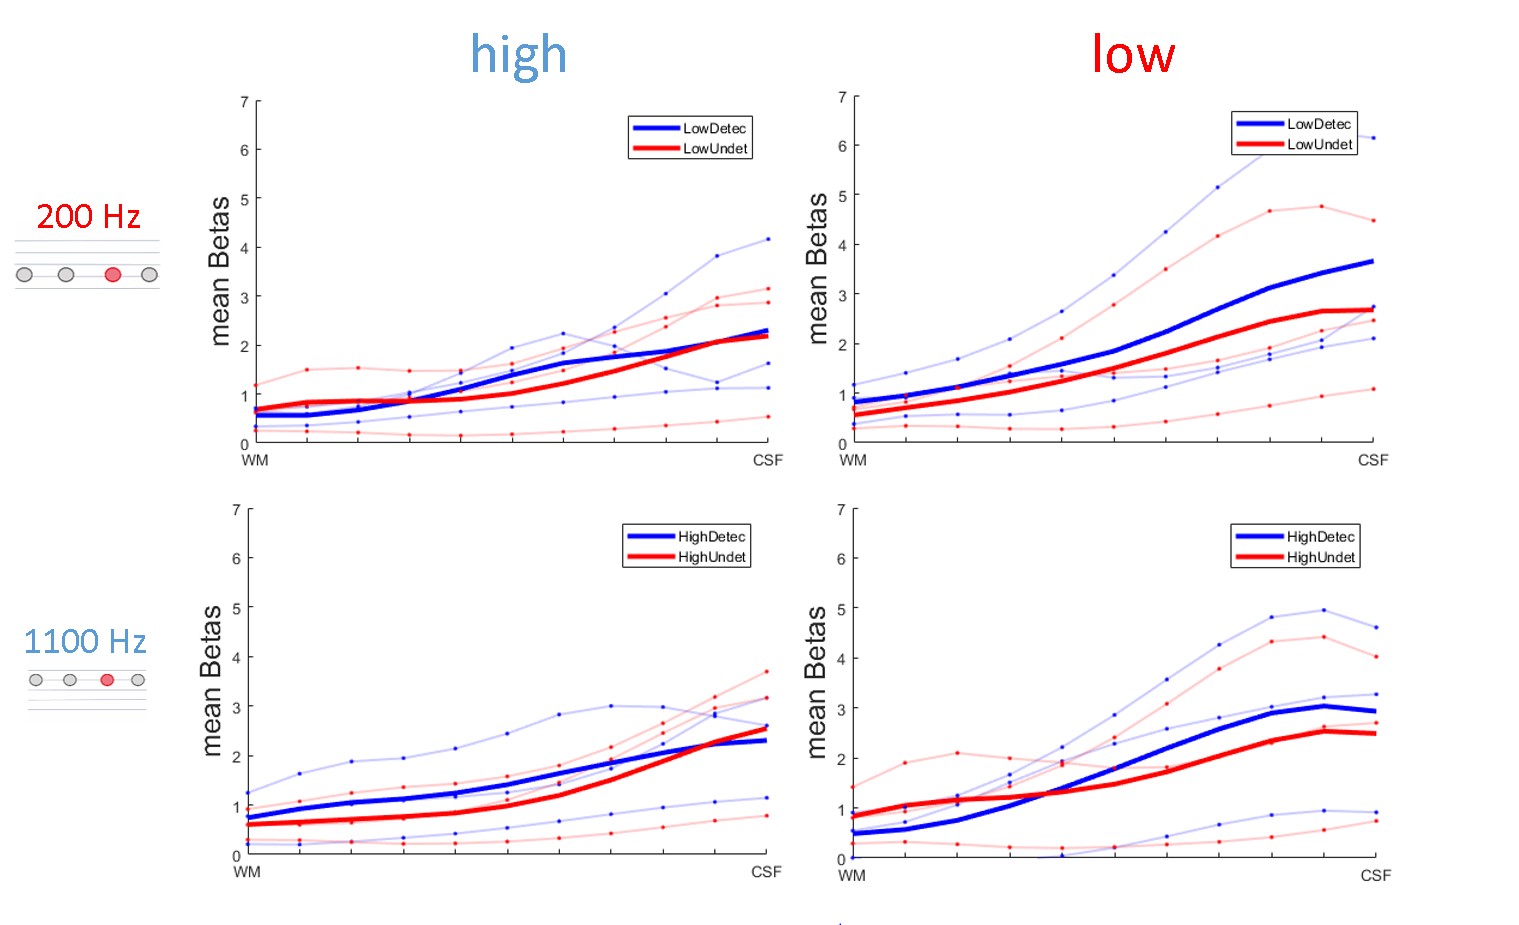
Figure 4 shows behavioral data confirming the efficacy of adjusting task difficulty to balance detected and undetected trials. Figure 5 shows preliminary data in three volunteers. Responses to detected and undetected targets presented at low or high carrier frequencies (rows) are shown per ROI (columns). Detected targets tend to show higher responses than undetected targets in superficial layers. This effect is visible for high and low frequency carriers in the low BF region, hinting at a non-spectrally specific deviance detection mechanism.Summary and Conclusion
Our preliminary analysis of layer responses indicates an increase in response for detected targets towards superficial layers. This increase appears not to be specific to the acoustic frequency of the sounds. Further analyses will be necessary to account for possible effects of vascular draining.Acknowledgements
Radiographic assistance: These data were acquired with the kind support of Scannexus at their 7T MAGNETOM SIEMENS scanner. We thank Alix Thomson, Sebastian Dresbach and Yawen Wang for assistance with after-hour scans.
Accompanying psychophysics data: We thank Anna Yi and Lauren Huizenga for help with collection of complimentary outside-scanner psychophysics data.
Funding: Miriam Heynckes, Elia Formisano and Peter De Weerd are funded by The Netherlands Organization for Scientific Research (NWO) Research Talent Grant 406.17.200. Federico De Martino is funded by The Netherlands Organization for Scientific Research (NWO) VIDI grant 864-13-012. Scanning hours were funded by the MBIC graduate school.
Ethics: Ethics Review Committee for Psychology and Neuroscience (ERCPN) at Maastricht University, has approved the scanning procedures, following the principles expressed in the Declaration of Helsinki.
References
Auksztulewicz, R., Schwiedrzik, C. M., Thesen, T., Doyle, W., Devinsky, O., Nobre, A. C., ... & Melloni, L. (2018). Not all predictions are equal:“what” and “when” predictions modulate activity in auditory cortex through different mechanisms. Journal of Neuroscience, 38(40), 8680-8693. http://www.jneurosci.org/lookup/doi/10.1523/JNEUROSCI.0369-18.2018
Berlot, E., Formisano, E., & De Martino, F. (2018). Mapping frequency-specific tone predictions in the human auditory cortex at high spatial resolution. Journal of Neuroscience, 38(21), 4934-4942. https://doi.org/10.1523/JNEUROSCI.2205-17.2018
Formisano E, Kim D-S, Salle F Di, Van De Moortele P-F, Ugurbil K, Goebel R. Mirror-Symmetric Tonotopic Maps in Human Primary Auditory Cortex. Neuron. 2003; 40:859–69. https://doi.org/10.1016/s0896-6273(03)00669-x
Heilbron, M., & Chait, M. (2018). Great expectations: is there evidence for predictive coding in auditory cortex? Neuroscience, 389, 54-73. https://doi.org/10.1016/j.neuroscience.2017.07.061
Heynckes, M., De Weerd, P., Valente, G., Formisano, E., & De Martino, F. (2020). Behavioral effects of rhythm, carrier frequency and temporal cueing on the perception of sound sequences. Plos one, 15(6), e0234251. https://doi.org/10.1371/journal.pone.0234251
Lakatos, P., O’Connell, M. N., Barczak, A., McGinnis, T., Neymotin, S., Schroeder, C. E., ... & Javitt, D. C. (2020). The thalamocortical circuit of auditory mismatch negativity. Biological psychiatry, 87(8), 770-780. https://doi.org/10.1016/j.biopsych.2019.10.029
Moerel, M., De Martino, F., & Formisano, E. (2014). An anatomical and functional topography of human auditory cortical areas. Frontiers in neuroscience, 8, 225.https://doi.org/10.3389/fnins.2014.00225
Waehnert, M. D., Dinse, J., Weiss, M., Streicher, M. N., Waehnert, P., Geyer, S., ... & Bazin, P. L. (2014). Anatomically motivated modeling of cortical laminae. Neuroimage, 93, 210-220.: http://dx.doi.org/10.1016/j.neuroimage.2013.03.078
Wollman, I., & Morillon, B. (2018). Organizational principles of multidimensional predictions in human auditory attention. Scientific reports, 8(1), 1-11.http://www.nature.com/articles/s41598-018-31878-5
Figures