3367
Investigating in-vivo function of Zebrin-II stripes of the cerebellum using tactile stimulation and prediction.1Spinoza Centre for Neuroimaging, Amsterdam, Netherlands
Synopsis
The functional organization of the cerebellar cortex is largely unexplored in-vivo. However, connectivity studies suggest it is organized in successive Zebrin-II positive and negative stripes that receive descending signals from the cerebrum and ascending input from the peripheral nervous system respectively. To examine this stripe-based functional organization we used a tactile-stimulation experiment with actual (bottom-up) and predicted (top-down) stimulation at 7T. This paradigm gives reliable responses to predicted and experienced stimuli. Our fMRI results suggest that there is a spatial separation in the cerebellum between these two processes in line with the hypothesised relation between function and Zebrin-II stripes.
Introduction
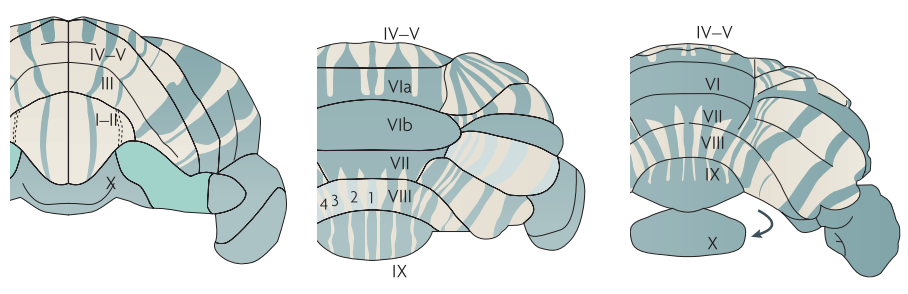
A striking feature of the mammalian cerebellar cortex is its expression of the protein Zebrin-II in positive and negative parasagittal bands throughout the Purkinje cell layer[1,2,3,4] (Figure 1). These stripe-like structures are reproducible and robust (e.g. between individuals[1,5] and species[6,7], in development[8,9], and against neurodegeneration[10]). Connectivity findings suggest that incoming fibres each primarily project to only one stripe-type[11,12,cf.13]. Crucially, it has also been found that Zebrin-II positive stripes tend to receive descending signals from the cerebrum, whereas Zebrin-II negative stripes receive ascending input originating from the peripheral nervous system[3,6,12,14,15]. These findings indicate that these Zebrin-II bands are functionally relevant.While over recent years, interest in the functional aspect of the cerebellum has increased[16], there have been no studies comparing functional activity in humans to Zebrin-II expression. In this study we examine if a Zebrin-stripe-like functional response can be detected using fMRI.
To study the significance of Zebrin-bands in cerebellar activity, we designed a tactile stimulation experiment, inspired by the oddball paradigm[17]. By contrasting trials where predictions were made and where actual stimulation occurred, clusters responsive to top-down input can be distinguished from those responsive to bottom-up input.
Methods
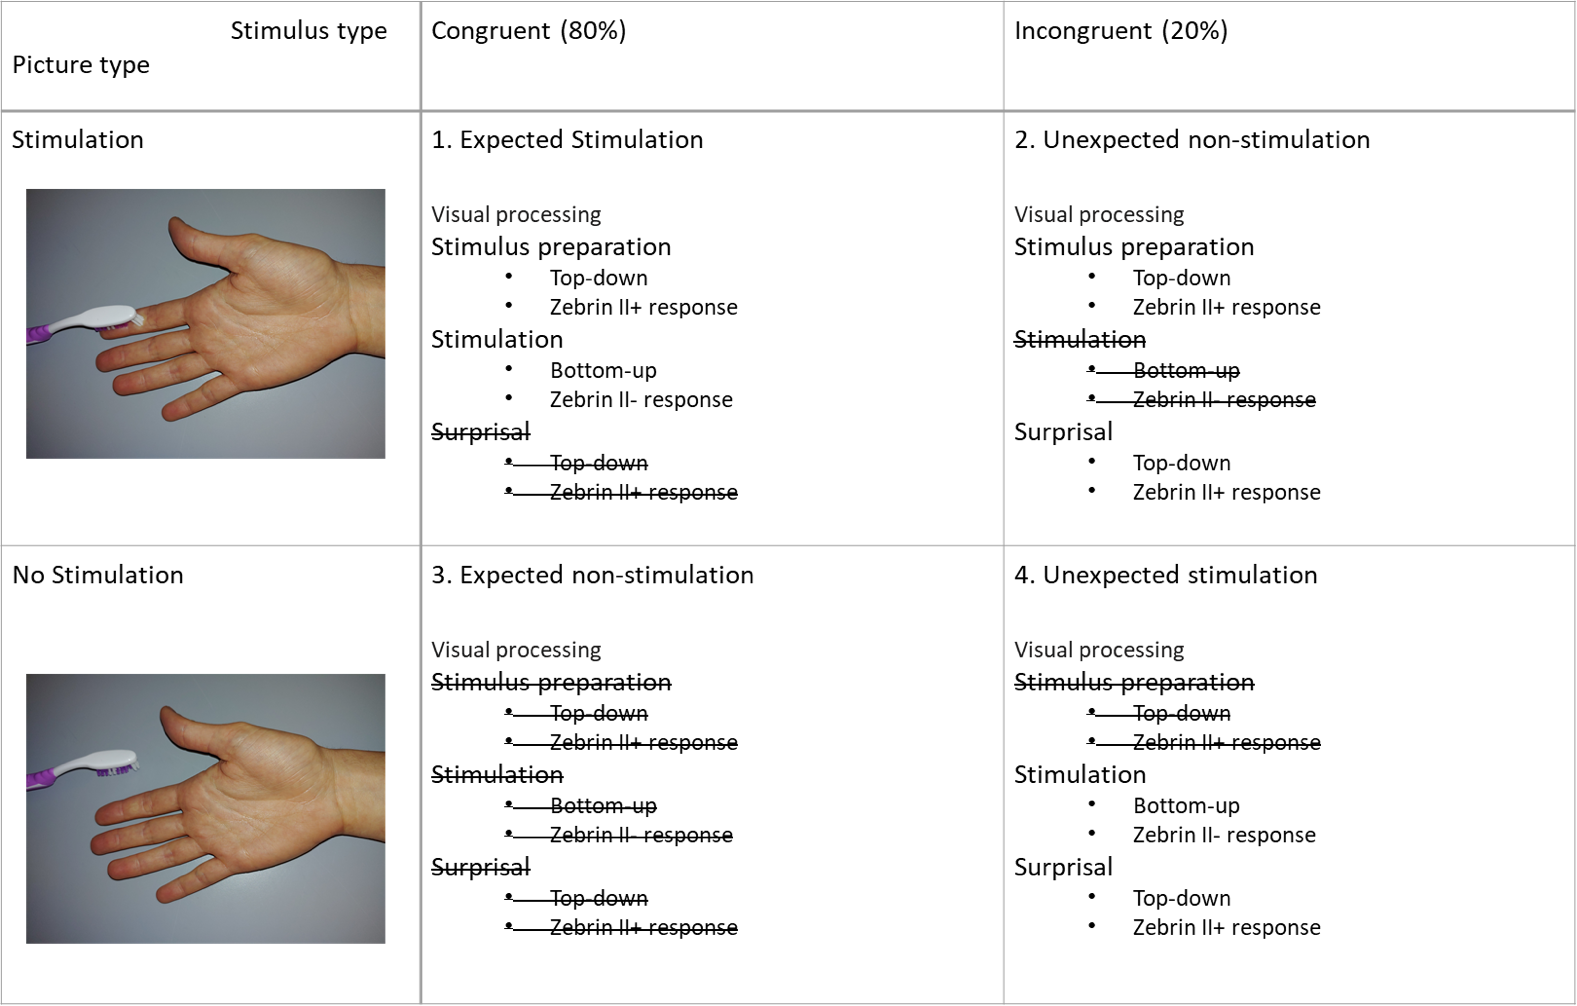
Seven participants (3 male) were scanned with a Phillips Achieve 7T and a Tx8/Rx32 coil (Nova Medical).The experiment consisted of four runs of 55 trials each. During a trial, participants were presented with one of two images (table 1) before target stimulation. Trials were presented in a pseudo-randomised order. Approximately 0.5s after picture presentation, the participant’s index finger was stimulated with a brush congruently (80%) or incongruently (20%) to the image. This allowed participants to make predictions on when finger stimulation would occur. After four subjects, the stimulation was switched from the right to the left hand, due to remaining signal loss in the right cerebellar hemisphere.
Functional images were acquired with a BOLD-weighted 3D-EPI (FOV = 200x200x176mm3, voxel-size=1.8mm isotropic, TRvolume/TR/TE=1300ms/44ms/17ms, flip-angle=13o, SENSEy/z=2.6/3.2). Four runs of 245 volumes were acquired per subject. A whole-brain FoV was used to include the somatosensory cortex as a reference region. Rf-shimming was used to increase signal in the cerebellum, at the cost of signal homogeneity in the frontal areas. MP2RAGE were acquired (FoV=186x230x230mm, voxel-size=0.8mm isotropic, TE/TR=3.3/6.2ms, TI1,2=800/2700ms, FA1,2=7°/5° and SENSEy/z=1.8/1.8) as anatomical reference.
Data were motion/distortion-corrected and smoothed (AFNI[18] and FSL[19]). A GLM was fitted for the task regressors (convolved with a double-gamma HRF), motion parameters and baseline constants using generalized least-squares (FSL[20]). These beta-maps were then used in an ANOVA to contrast conditions.
Results
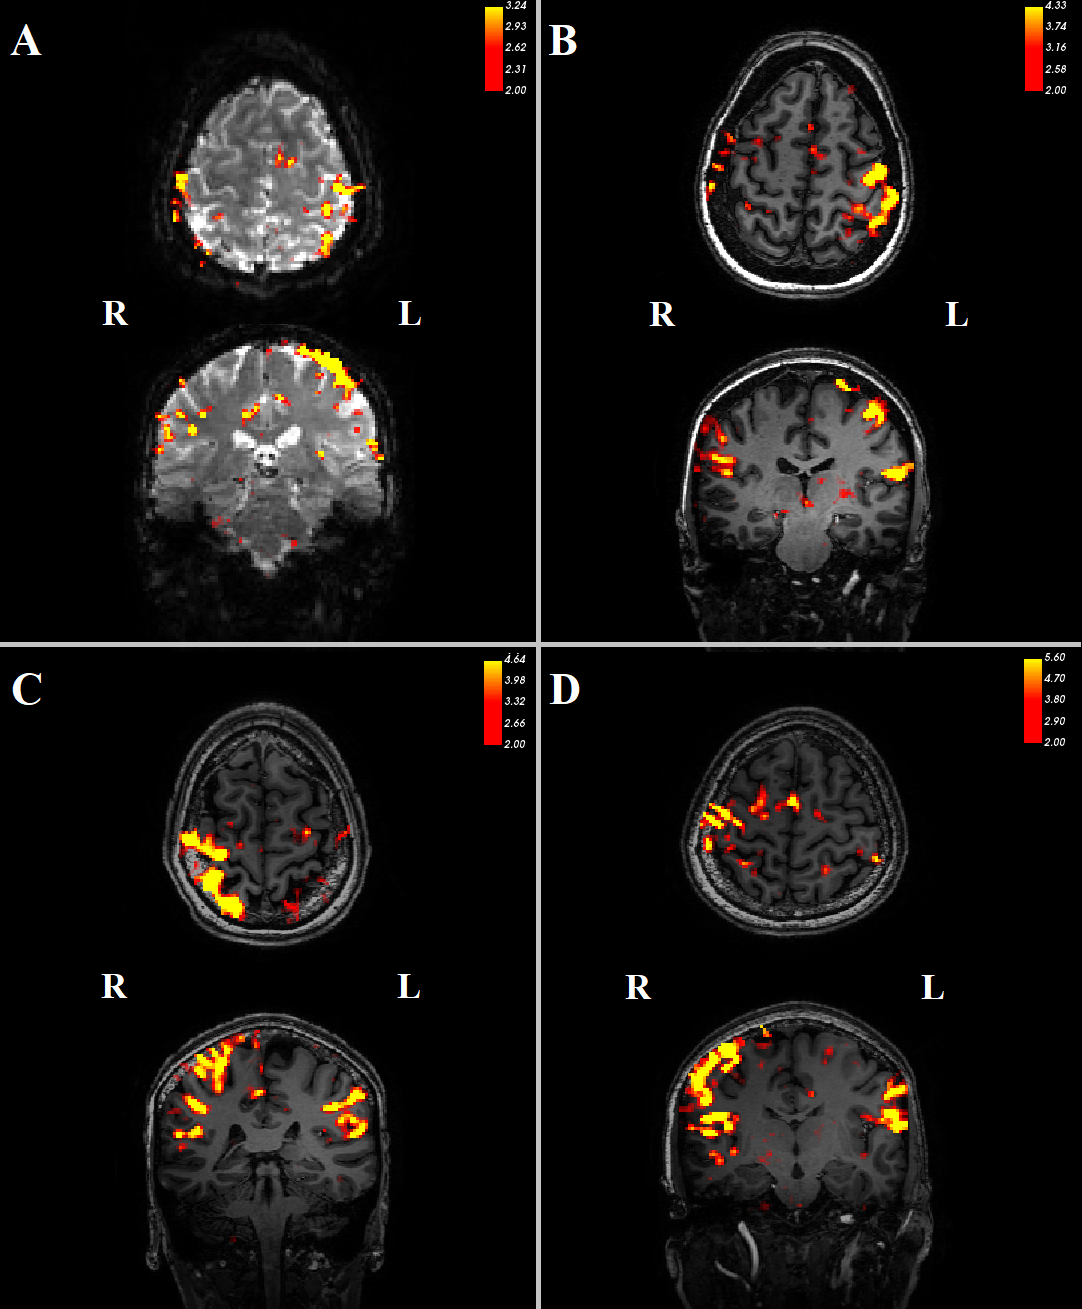
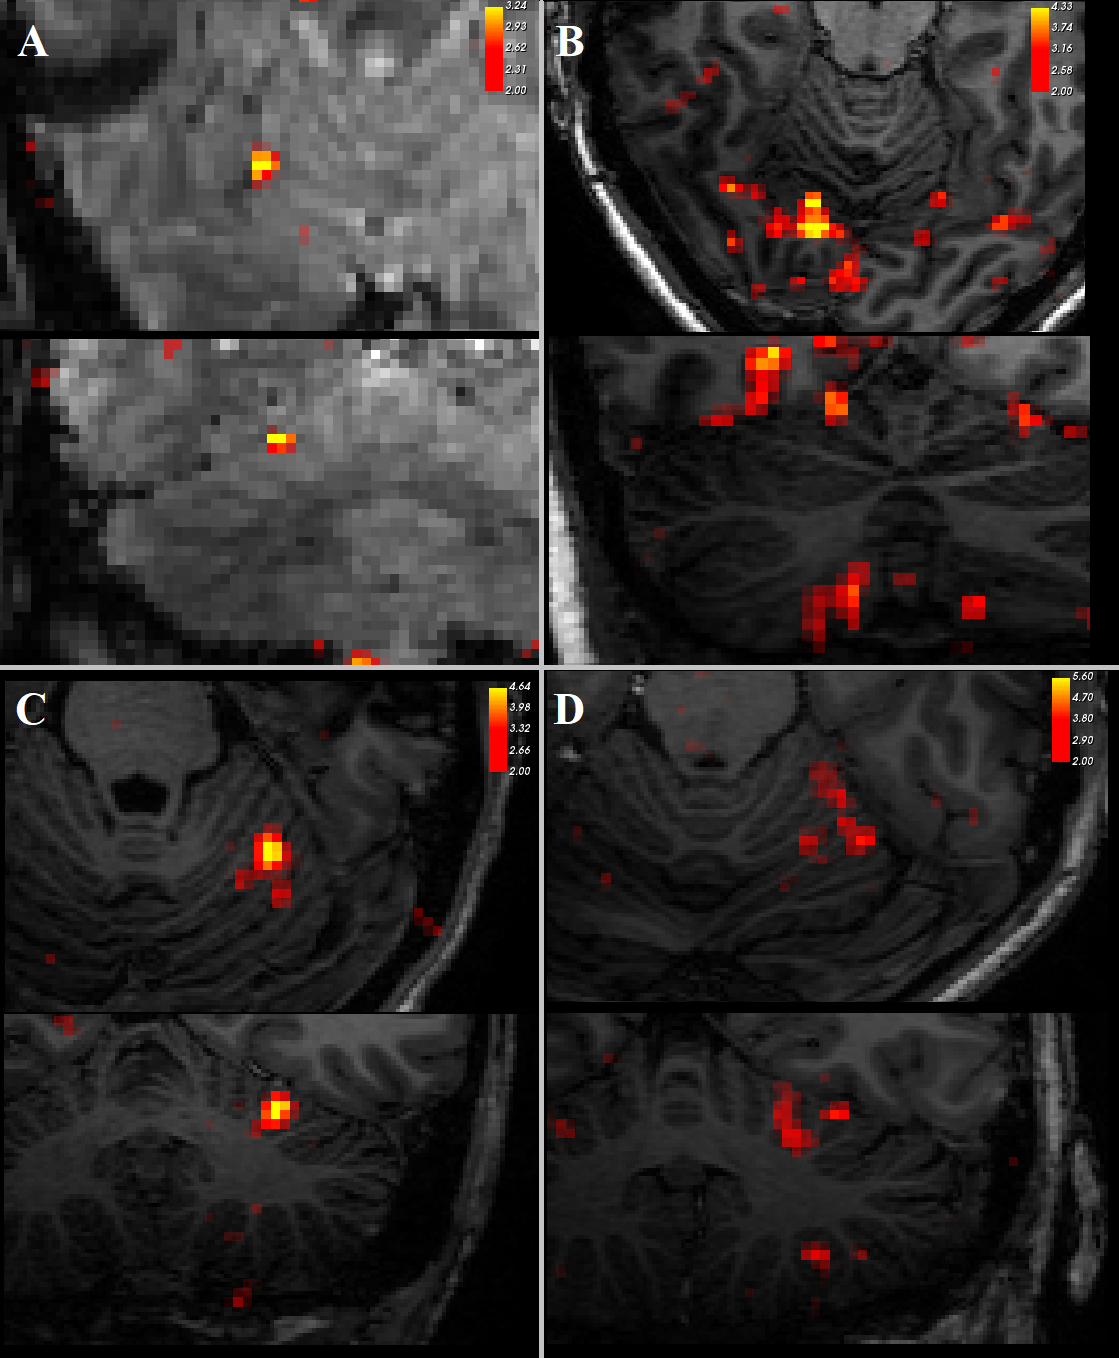
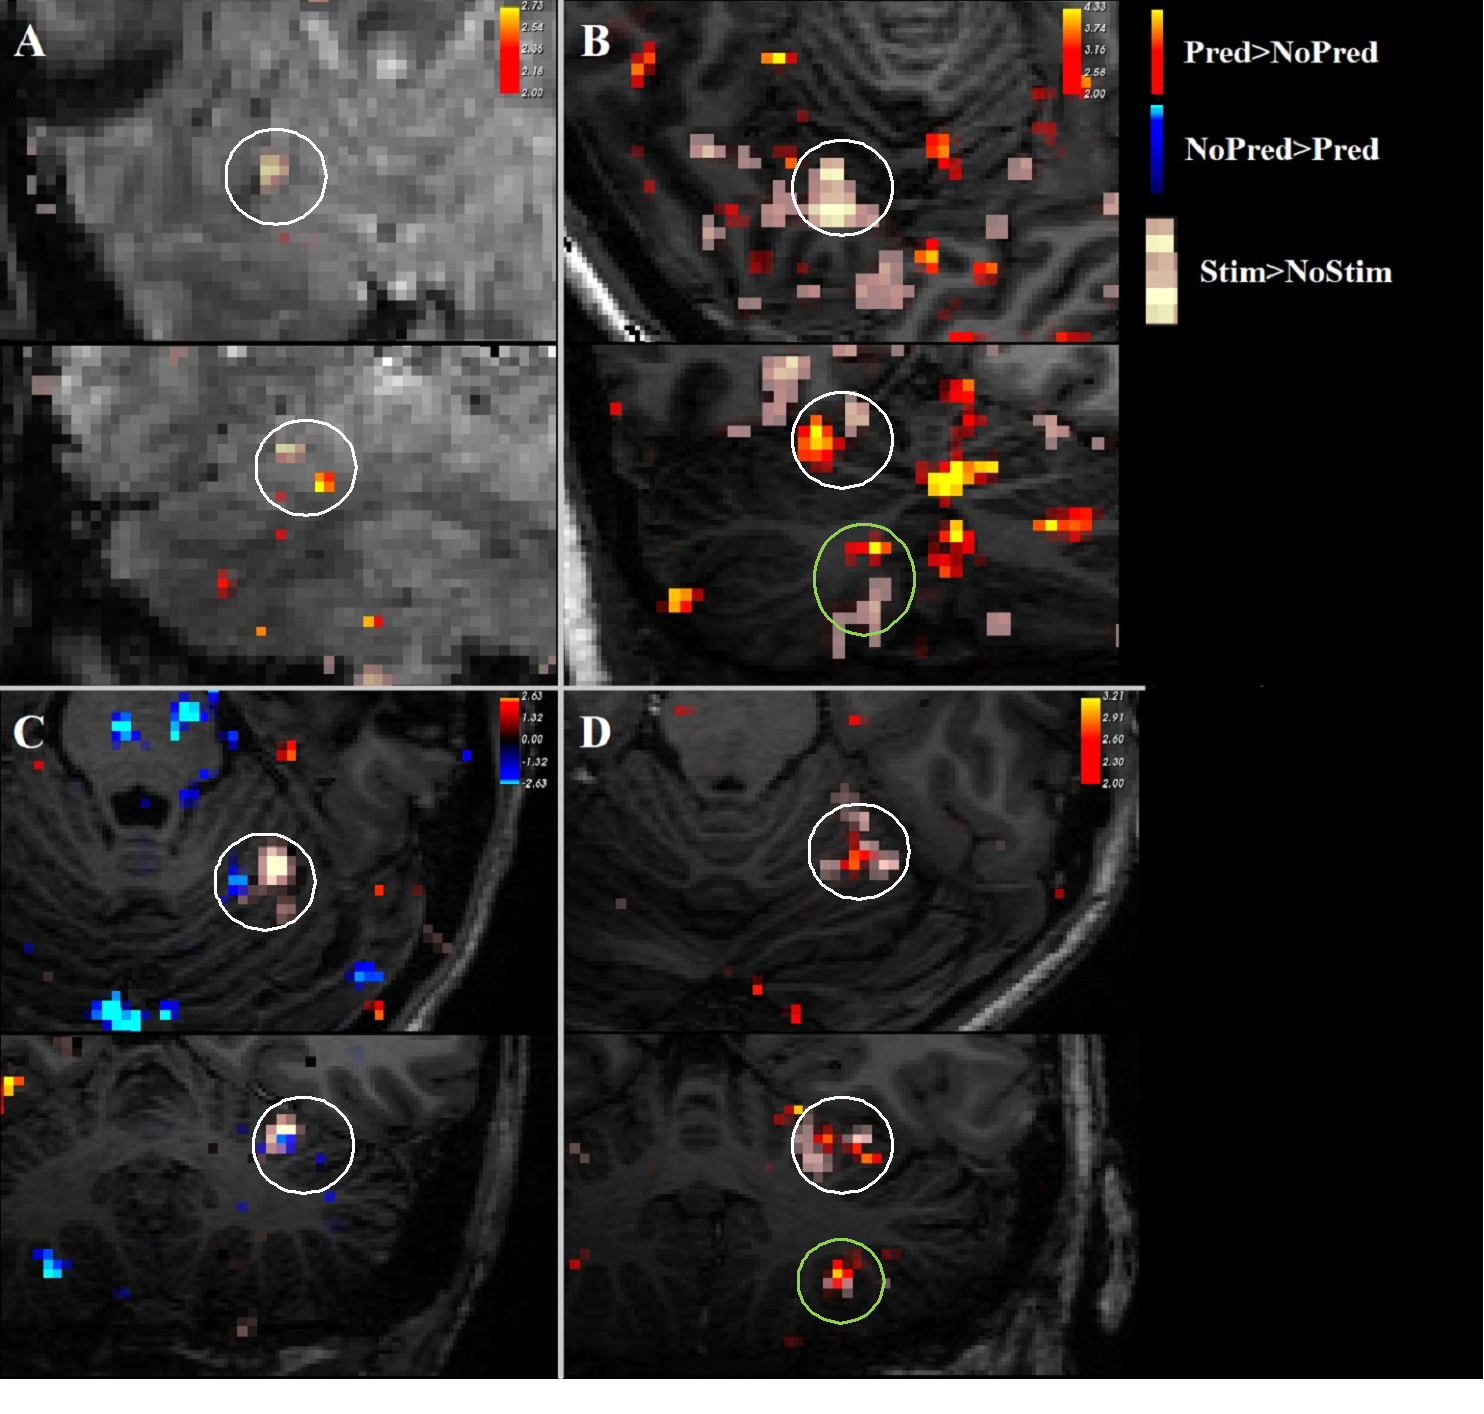
Three datasets were excluded from analysis due to signal dropout in the cerebellum.Contrasting trials with stimulation vs no stimulation, we see significant (z>2) responses in the contralateral primary somatosensory cortex (figure 2). In addition, there was a consistent ipsilateral response (z>2) in the anterior lobe of the cerebellum (figure 3). Contrasting trials with a prediction of stimulus vs prediction of no stimulus similarly showed an ipsilateral cerebellar response, where clusters bordered the responses to the actual stimulation (figure 4, white circles). The posterior lobe of the cerebellum likewise showed responses to stimulation vs no stimulation in 3 subjects (Figure 3), and neighbouring clusters for prediction of stimulus vs prediction of no stimulus in 2 (Figure 4, B&D, green circles).
Discussion
The robustness of the Zebrin-based Purkinje cell structure in the cerebellum[1,5,6,7,8,9,10] suggests that there is an advantage to these cells expressing Zebrin-II. However, so far it is unclear what this advantage might be in relation to the specific function of these Zebrin-II stripes. Here, we attempted to initiate investigation of the functional purpose of the parasagittal organisation present in the cerebellum.The next step in the project will be to study the responses within the cerebellum exclusively, at sub-millimetre resolution. This will provide clearer cerebellar responses, and might result in responses strongly adherent to the Zebrin-II pattern of the cerebellum, in line with connectivity studies[3,6,11,12,14,15]. Should final results prove promising, this will be the first of several studies investigating whether there is a relationship between cerebellar function and Zebrin-II expression. Further investigation might shed light on the purpose of neural organisations, and evolutionary prioritisation of certain functions.
The spatial relation between Zebrin-II expression and functional MRI results might be achieved by the myelin differences between the parasagittal Zebrin-II +/- bands. Although difficult to visualise[21], comparing these to histological measures post-mortem would reinforce any definitive claims regarding the relation between in-vivo cerebellar function and parasagittal Zebrin-II bands.
These preliminary results suggest that our current paradigm gives reliable responses to both predicted and experienced stimuli. They also suggest that there is a spatial separation in the cerebellum between these two processes. This is in line with the hypothesised relation between function and parasagittal bands, as well as the literature on the origins and projections of cerebellar input[3,6,12,14,15].
Acknowledgements
No acknowledgement found.References
[1] Hawkes, Richard & Leclerc, Nicole. (1987). Antigenic map of the rat cerebellar cortex: The distribution of parasagittal bands as revealed by monoclonal anti-purkinje cell antibody mabQ113. The Journal of comparative neurology. 256. 29-41. 10.1002/cne.902560104.
[2] Voogd, Jan, Pardoe, Joanne, Ruigrok, Tom J. H. & Apps, Richard. (2003). The Distribution of Climbing and Mossy Fiber Collateral Branches from the Copula Pyramidis and the Paramedian Lobule: Congruence of Climbing Fiber Cortical Zones and the Pattern of Zebrin Banding within the Rat Cerebellum. The Journal of Neuroscience. 23(11). 4645-56. 10.1523/jneurosci.23-11-04645.2003.
[3] Voogd, Jan & Ruigrok, Tom J. H. (2004). The organization of the corticonuclear and olivocerebellar climbing fiber projections to the rat cerebellar vermis: The congruence of projection zones and the zebrin pattern. Journal of Neurocytology. 33(1). 5-21. 10.1023/B:NEUR.0000029645.72074.2b
[4] Apps, Richard & Hawkes, Richard. (2009). Cerebellar cortical organization: A one-map hypothesis. Nature Reviews Neuroscience. 10(9). 670-681. 10.1038/nrn2698
[5] Hawkes, Richard & Colonnier, Marc & Leclerc, Nicole. (1985). Monoclonal antibodies reveal sagittal banding in the rodent cerebellar cortex. Brain Research. 333. 359-365. 10.1016/0006-8993(85)91593-8.
[6] Brochu, Gino, Maler, Leonard & Hawkes, Richard. (1990). Zebrin II: a polypeptide antigen expressed selectively b Purkinje cells reveals compartments in rat and fish cerebellum. The Journal of comparative neurology. 291. 538-52. 10.1002/cne.902910405.
[7] Sillitoe, Roy V., Marzban, Hassan, Larouche, Matt, Zahedi, Sepehr, Affanni, Jorge & Hawkes, Richard. (2005). Conservation of the architecture of the anterior lobe vermis of the cerebellum across mammalian species. Progess in Brain Research. 148. 283-97. 10.1016/S0079-6123(04)48022-4.
[8] Hashimoto, Mitsuhiro & Mikoshiba, Katsuhiko. (2004). Mediolateral Compartmentalization of the Cerebellum Is Determined on the “Birth Date” of Purkinje Cells. The Journal of neuroscience: the official journal of the Society for Neuroscience. 23. 11342-51. 10.1523/JNEUROSCI.23-36-11342.2003.
[9] Croci, Laura, Chung, Seung-Hyuk, Masserdotti, Giacomo, Gianola, Sara, Bizzoca, Antonella, Gennarini, Gianfranco, Corradi, Anna, Rossi, Ferdinando, Hawkes, Richard & Consalez, G. Giacomo. (2006). A key role for the HLH transcription factor EBF2COE2,O/E-3 in Purkinje neuron migration and cerebellar cortical topography. Development. 133. 2719-29. 10.1242/dev.02437
[10] Cerminara, Nadia L., Lang, Eric J., Sillitoe, Roy V. & Apps, Richard. (2016). Redefining the cerebellar cortex as an assembly of non-uniform Purkinje cell microcircuits. Nature Reviews Neuroscience. 16(2). 79-93. 10.1038/nrn3886.
[11] Sugihara, Izumi & Quy, Pham Ng. (2007). Identification of aldolase C compartments in the mouse cerebellar cortex by olivocerebellar labelling. Journal of Comparative Neurology. 500(6). 1076-92. 10.1002/cne.21219
[12] Biswas, Mohammad S., Luo, Yuanjun, Sarpong, Gideon A. & Sugihara, Izumi. (2019). Divergent projections of single pontocerebellar axons to multiple cerebellar lobules in the mouse. Journal of Comparative Neurology. 527(12). 1966-85. 10.1002/cne.24662
[13] Larouche, Matt & Che, Priscilla & Hawkes, Richard. (2006). Neurogranin expression identifies a novel array of Purkinje cell parasagittal stripes during mouse cerebellar development. The Journal of comparative neurology. 494. 215-27. 10.1002/cne.20791.
[14] Stoodley, Catherine J. & Schmahmann, Jeremy D. (2010). Evidence for topographic organization in the cerebellum of motor control versus cognitive and affective processing. Cortex. 46(7). 831-44. 10.1016/j.cortex.2009.11.008
[15] Sugihara, Izumi & Shinoda, Yoshikazu. (2004). Molecular, topographic, and functional organization of the cerebellar cortex: A study with combined aldolase C and olivocerebellar labelling. Journal of Neuroscience. 24(40). 8771-85. 10.1523/JNEUROSCI.1961-04.2004
[16] King, Maedbh, Hernandez-Castillo, Carlos R., Poldrack, Russell A., Ivry, Richard B. & Diedrichsen, Jörn. (2019). Functional boundaries in the human cerebellum revealed by a multi-domain task battery. Nature Neuroscience. 22(8). 1371-8. 10.1038/s41593-019-0436-x
[17] Squires, Nancy K., Squires, Kenneth C. & Hillyard, Steven A. (1975). Two varieties of long-latency positive waves evoked by unpredictable auditory stimuli in man. Electroencephalography and Clinical Neurophysiology. 38(4). 387-401. 10.1016/0013-4694(75)90263-1
[18] Cox, R. W. (1996). AFNI: Software for Analysis and Visualization of Functional Magnetic Resonance Neuroimages. Computers and Biomedical Research, 29(3). 162–73.
[19] Andersson, JesperL. R., Skare, Stefan & Ashburner, John. (2003). How to correct susceptibility distortions in spin-echo echo-planar images: application to diffusion tensor imaging. NeuroImage. 20(2). 870-88. 10.1016/S1053-8119(03)00336-7
[20] Woolrich, M. W., Ripley, B. D., Brady, M., & Smith, S. M. (2001). Temporal Autocorrelation in Univariate Linear Modeling of FMRI Data. NeuroImage, 14(6), 1370–86. 10.1006/nimg.2001.0931
[21] Boillat, Yohan, Bazin, Pierre-Louis, O'Brien, Kieran, Fartaria, Mário J., Bonnier, Guillaume, Krueger, Gunnar, van der Zwaag, Wietske & Granziera, Cristina. (2020). Surface-based characteristics of the cerebellar cortex visualized with ultra-high field MRI. NeuroImage. 172. 1-8. 10.1016/j.neuroimage.2018.01.016.
Figures