3365
Functional connectome of arousal and motor brainstem nuclei using 7 Tesla resting-state fMRI in living humans1Brainstem Imaging Laboratory, Department of Radiology, Athinoula A. Martinos Center for Biomedical Imaging, Boston, MA, United States, 2Sant'Anna School of Advanced Studies, Institute of Life Sciences, Pisa, Italy, 3Dipartimento di Ingegneria dell’Informazione, University of Pisa, Pisa, Italy, 4Fondazione Toscana Gabriele Monasterio, Pisa, Italy
Synopsis
For a holistic understanding of sleep, arousal and associated motor processes, we investigated the resting-state functional connectivity of 18 arousal and motor brainstem nuclei in living humans by the use of high spatial-resolution 7 Tesla resting-state fMRI, as well as a recently developed in-vivo probabilistic atlas of these nuclei in standard space. Further, we verified the translatability of our brainstem connectome approach to conventional (e.g. 3 Tesla) fMRI. Results provided comprehensive and augmented brainstem-brain connectome to understand mechanisms of arousal-motor function in health and disease conditions and its translatability in clinical settings.
Introduction
Arousal, sleep and the associated motor responses are related to the alternated firing of neurons in about 18 small brainstem nuclei1. For a holistic understanding of sleep, arousal and associated motor processes, a comprehensive investigation of functional connections of the nuclei involved is needed. Moreover, with the ever-increasing evidence of overlapping functions of several regions, it is becoming imperative to investigate affected networks rather than single regions. Paucity of studies in the field of functional brainstem-brain connectivity in living humans is due to the lack of an in-vivo brainstem nuclei atlas and the need of high-sensitivity resting-state functional MRI (fMRI) for superior results.Purpose
To this end, we investigated the resting-state functional connectivity of 18 arousal and motor brainstem nuclei in living humans by the use of high spatial-resolution 7 Tesla resting-state fMRI, as well as a recently developed in-vivo probabilistic atlas of arousal and motor brainstem nuclei in stereotactic (Montreal-Neurological-Institute —MNI) space2. Further, we verified the translatability of our brainstem connectome approach to conventional (e.g. 3 Tesla) fMRI.Methods
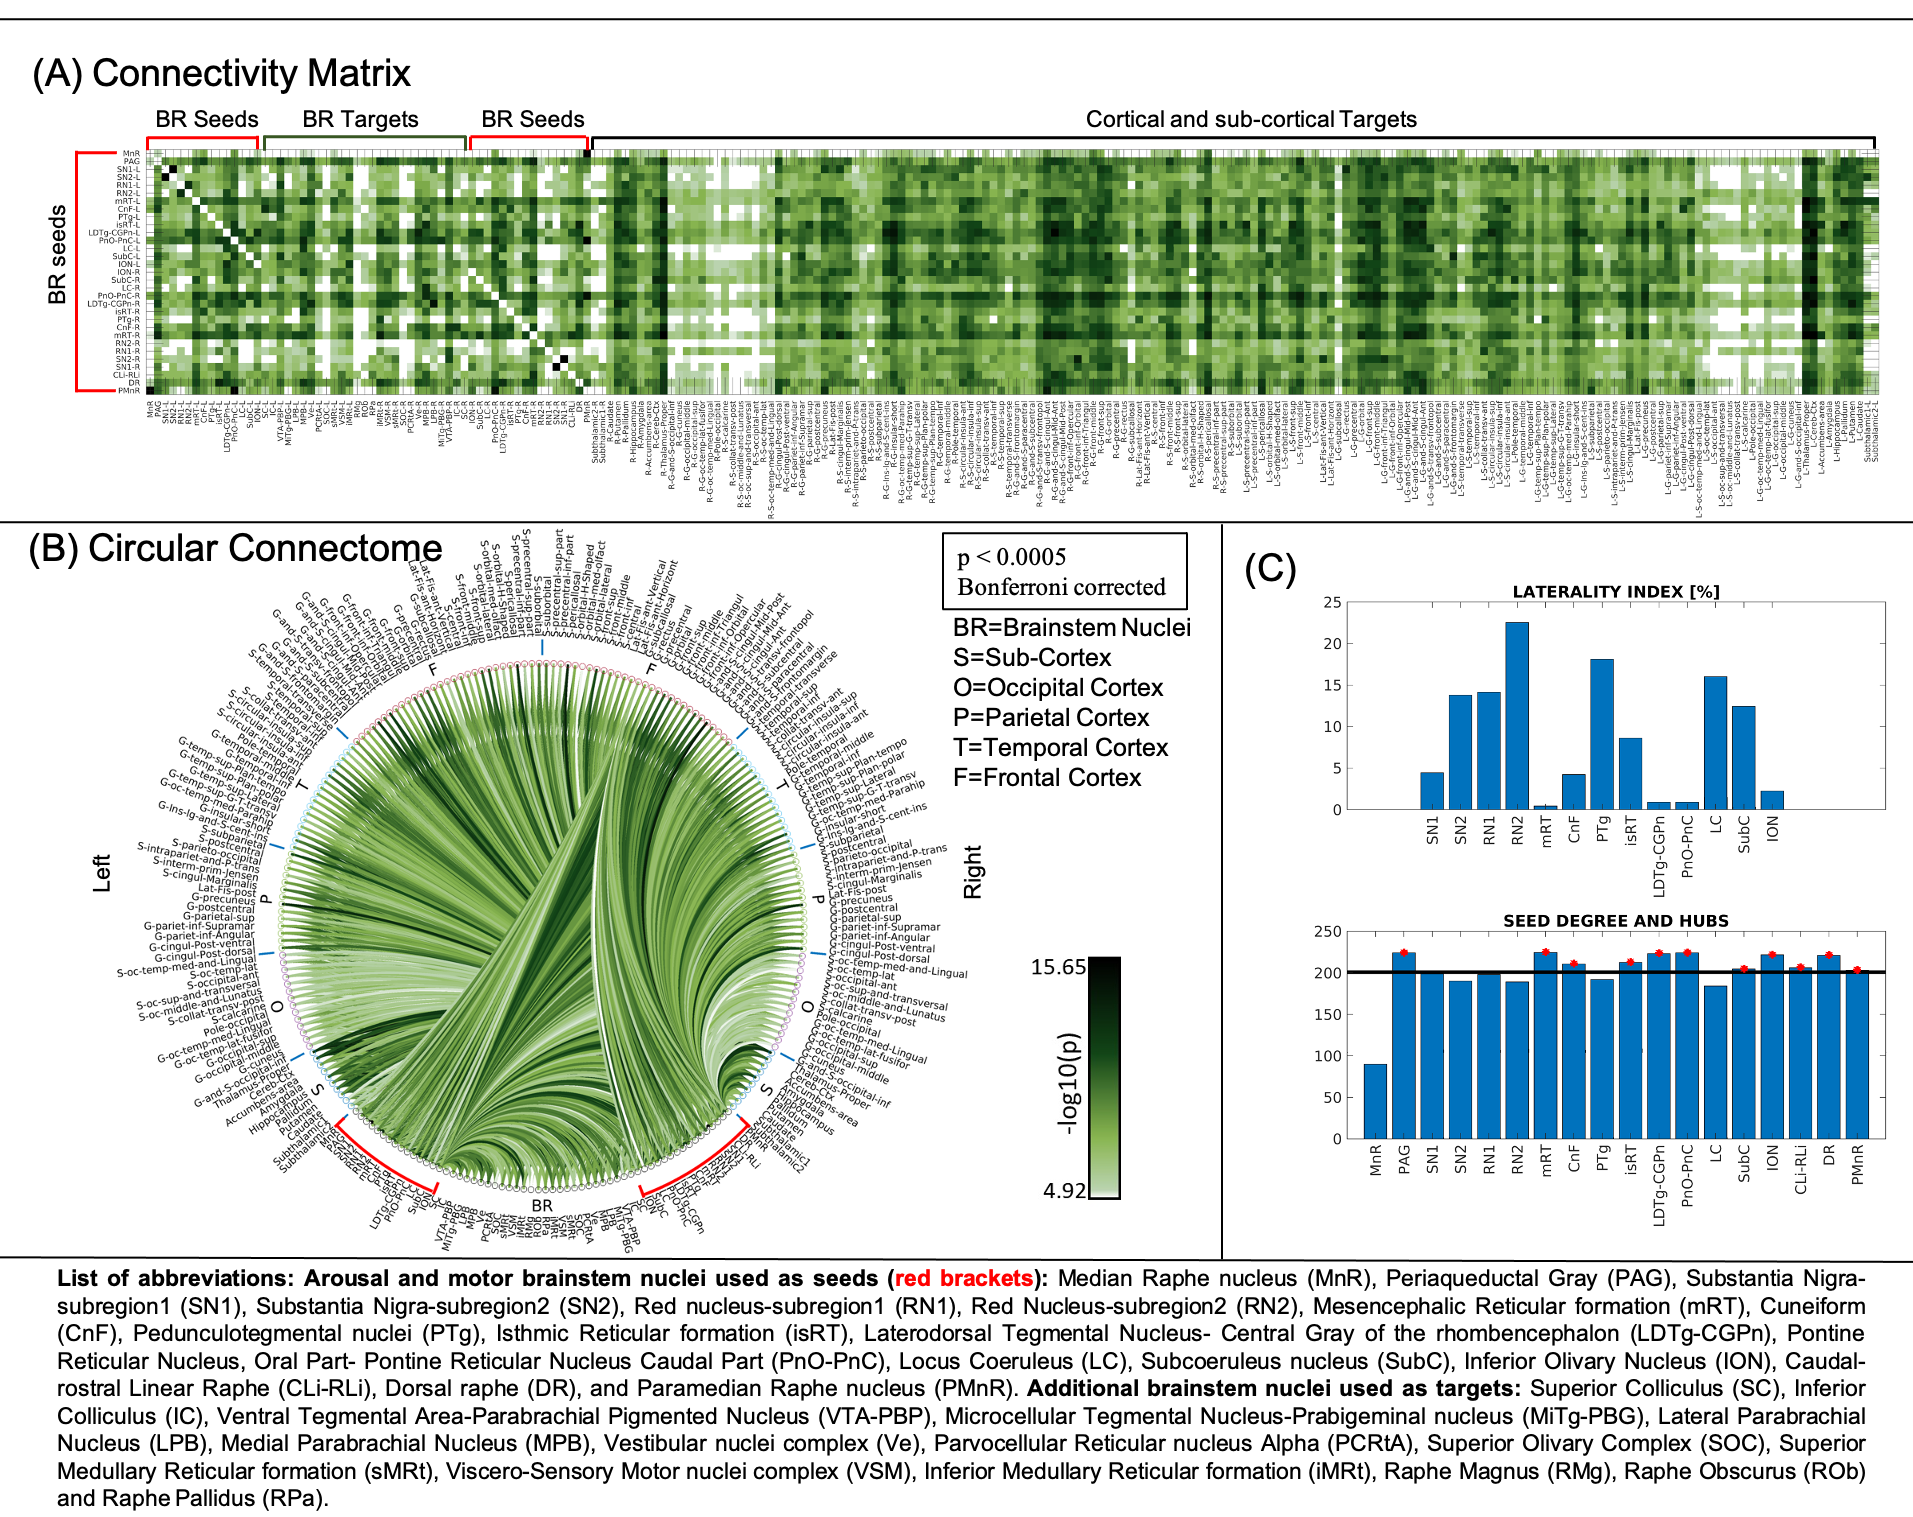
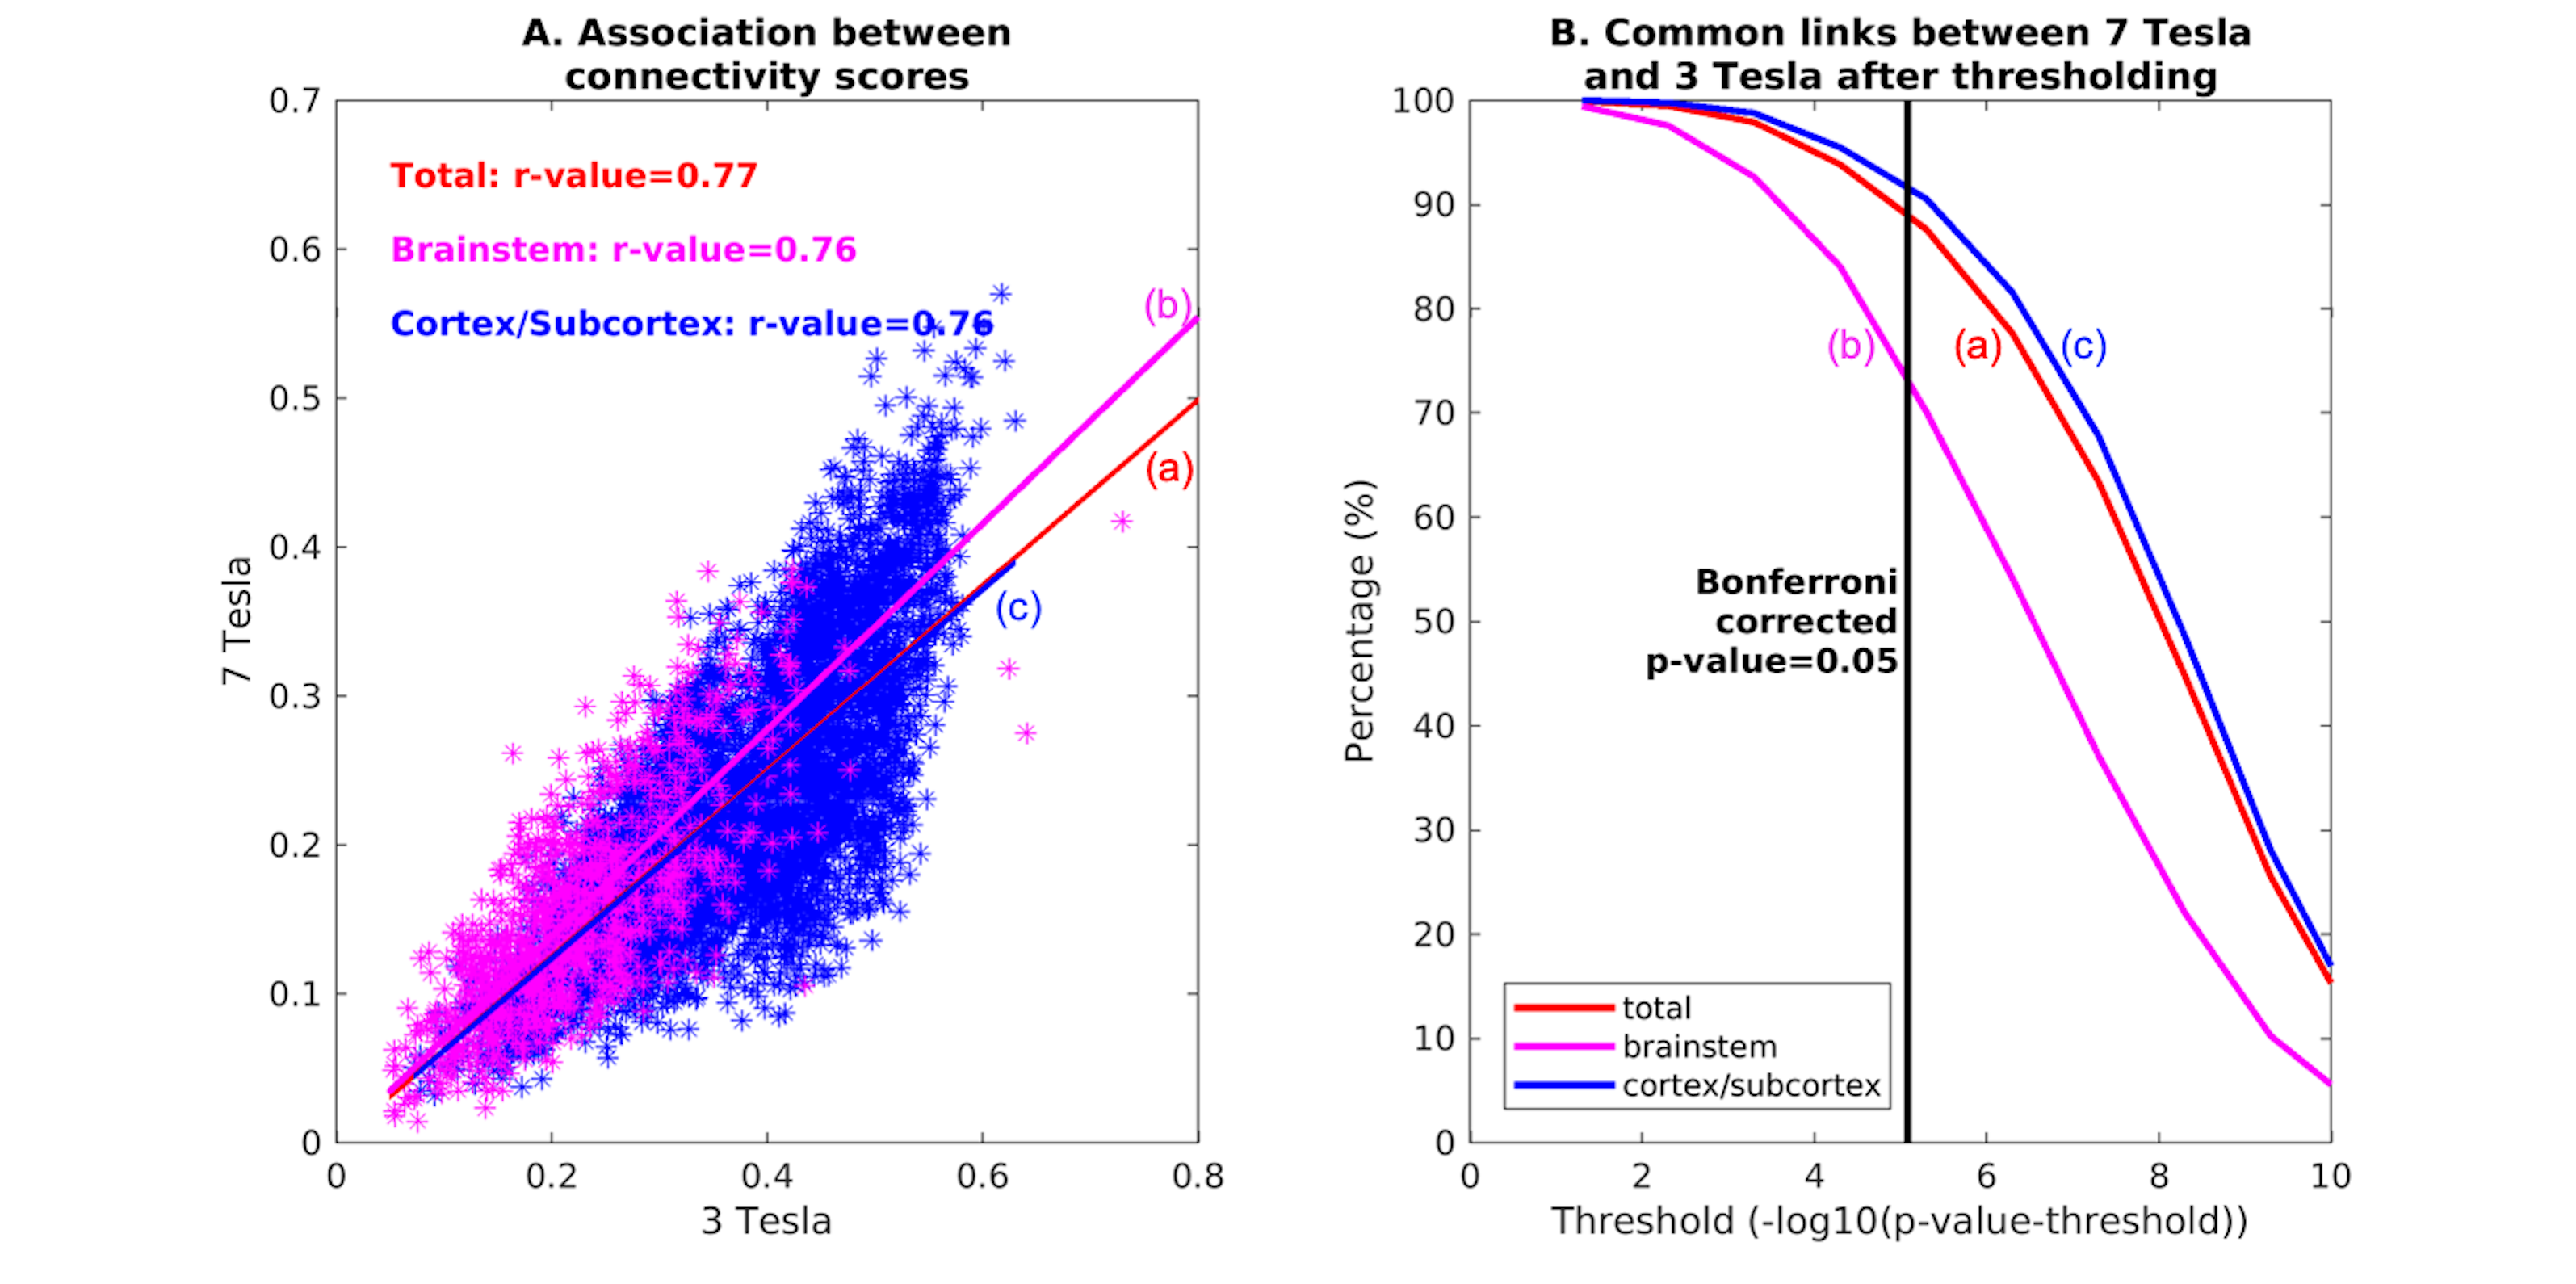
Data acquisition: Twenty healthy subjects (10m/10f, age-29.5±1.1years) underwent both 7 Tesla and 3 Tesla MRI under IRB-approval. fMRI (7 Tesla): three runs of functional gradient-echo EPIs were acquired with the subjects at rest with their eyes closed (isotropic voxel size/matrix size/GRAPPA factor/nominal echo-spacing/readout bandwidth/N. slices/slice orientation/slice acquisition order/echo time (TE)/repetition time (TR)/flip angle (FA)/simultaneous-multi-slice factor/N. repetitions/phase encoding direction/acquisition time per run=1.1 mm/180×240/3/0.82ms/“1488Hz/Px”/123/sagittal/interleaved/32ms/2.5s/75°/3/210/anterior-posterior/10’07”). Field-map (7 Tesla): was acquired to perform distortion-correction with: isotropic voxel size/matrix size/readout bandwidth/N.slices/slice orientation/slice acquisition order/TE1/TE2/TR/FA/simultaneous-multi-slice factor/phase encoding direction=2.0 mm/116 x 132/“1515 Hz/Px”/80/sagittal/interleaved/3.00 ms/4.02 ms/570.0 ms/36°/2’15’’/anterior-posterior. T1-weighted multi-echo MPRAGE (3 Tesla): isotropic voxel size/repetition-time/echo-times/inversion-time/FA/field-of-view(FOV)/bandwidth/GRAPPA-factor/slice orientation/slice acquisition-order/acquisition-time: 1mm/2.53s/[1.69,3.5,5.3,7.2] ms/1.5s/7°/256×256×176mm3/“650Hz/pixel”/3/sagittal/anterior-posterior/4′28′′. fMRI (3 Tesla): isotropic voxel size/matrix size/GRAPPA factor/nominal echo-spacing/readout bandwidth/N. slices/slice orientation/slice acquisition order/TE/TR/FA/GRAPPA factor/N. repetitions/phase encoding direction/acquisition-time per run=2.5 mm/100×215/2/0.5ms/“2420Hz/Px”/64/transversal/interleaved/30ms/3.5s/85°/2/150/anterior-posterior/9’06’’. Field-map (3 Tesla): isotropic voxel size/FOV/readout bandwidth/N. slices/slice orientation/slice acquisition order/TE1/TR/FA/acquisition-time/simultaneous-multi-slice factor/phase encoding direction=2.5mm/215x215/“300Hz/Px”/128/transversal/interleaved/4.92ms/849.0ms/85°/2’19’’/anterior-posterior.Data analysis: We adopted the same preprocessing for 7 Tesla and 3 Tesla fMRI data. a) Preprocessing: We computed the root-mean-square MEMPRAGE across echo-times, rotated it to standard-orientation (“RPI”), bias-field corrected (SPM)3 and cropped; we registered individual subject MEMPRAGEs to MNI space via an intermediate group-based optimal MEMPRAGE template (ANTs)4. Preprocessed MEMPRAGES were parcellated with Freesurfer5 to generate cortical and sub-cortical targets. fMRIs were corrected for physiological noise (RETROICOR6), slice timing, then reoriented, distortion- (FSL, using the field-map) and motion-corrected (Freesurfer). The time-averaged image of the first run was bias-field corrected (SPM) and coregistered to the MEMPRAGE using affine and nonlinear (AFNI7) transformations. These transformations were then applied to the whole time-series (three runs). Further, a set of nuisance regressors (including motion, respiration-volume-per-unit-time, cardiac rate, and time-courses in the cerebro-spinal-fluid surrounding the brainstem) were computed and regressed out (Matlab 2019b). Time-courses were then scaled to percentage signal changes with respect to the mean, by dividing them by the temporal mean and multiplying the result by 100. fMRIs did not undergo spatial smoothing. Band-pass filtering was applied between 0.01 Hz and 0.1 Hz (AFNI). Finally, any residual temporal mean was removed, and the three runs concatenated. Seed and target regions: 18 brainstem nuclei2 were used as seeds (see nuclei list in Figure 1, bottom part; 5 medial nuclei and 13 bilateral nuclei, for a total of 31 seeds). Targets included 195 FreeSurfer’s cortical and subcortical parcellations5 as well as brainstem seeds. Region-based connectivity analysis: For each subject, we computed the Pearson’s correlation coefficient between the average time-courses within seeds and the average time-courses within targets. We then averaged the correlation coefficient (Fischer-transformed) across subjects to yield a group functional connectivity matrix and displayed it as a 2D-circular plot (‘connectome’). To measure the left/right connectivity symmetry of bilateral nuclei, a ‘laterality index’ was computed (0/1=symmetry/asymmetry), as the difference between binary links of left and right (mirrored) seeds divided by the number of total links. We computed the seed connectivity degree, as the number of connectivity values above the statistical threshold (links) of each seed (p < 0.05; Bonferroni corrected). To evaluate the connectivity of arousal-motor nuclei, we measured the connectivity-degree as the number of links of each seed. Hubs were defined as nuclei displaying the highest–and above the average- connectivity-degree. 7 Tesla versus 3 Tesla results: We measured the association of the connectivity values (mean across subjects) across scanners. Percentage of common links across the two scanners for different statistical thresholds were computed.Results and Discussion
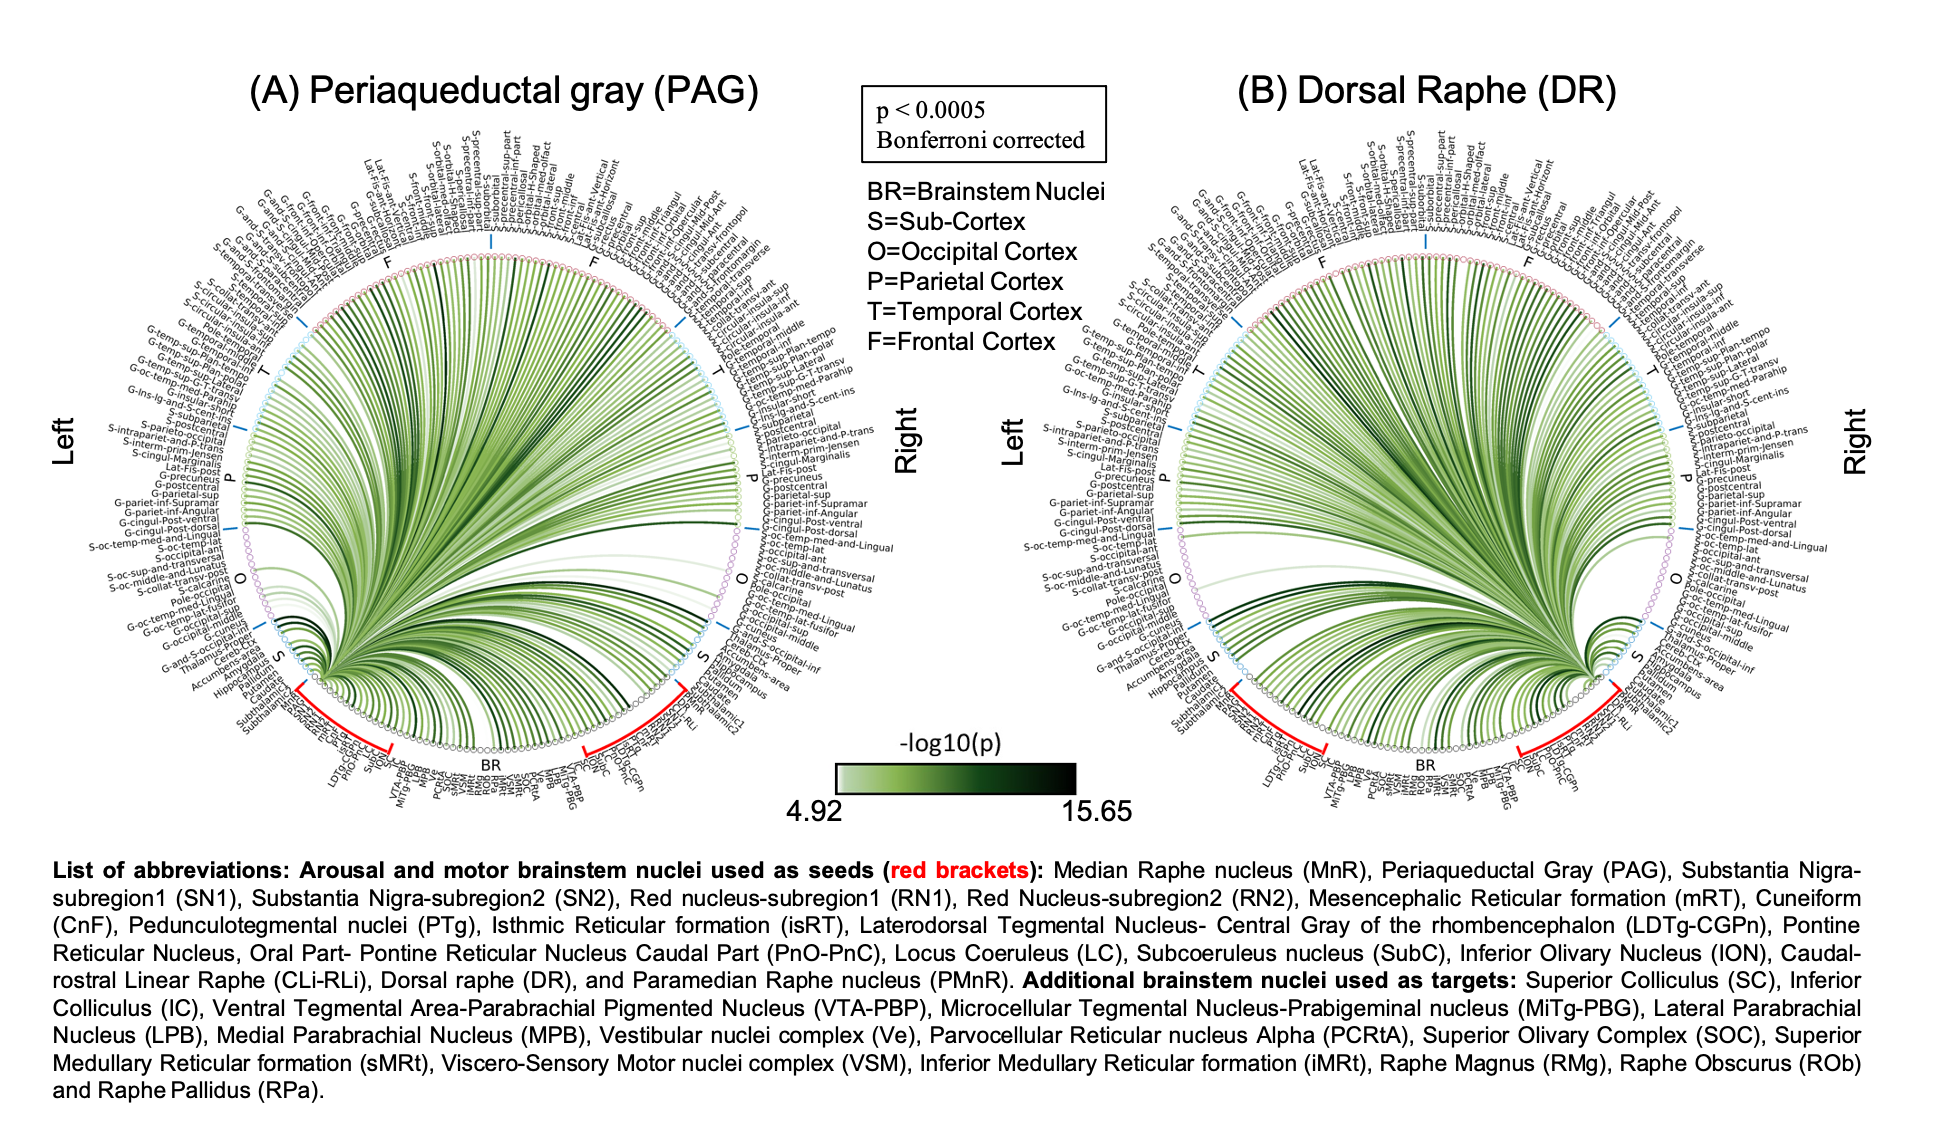
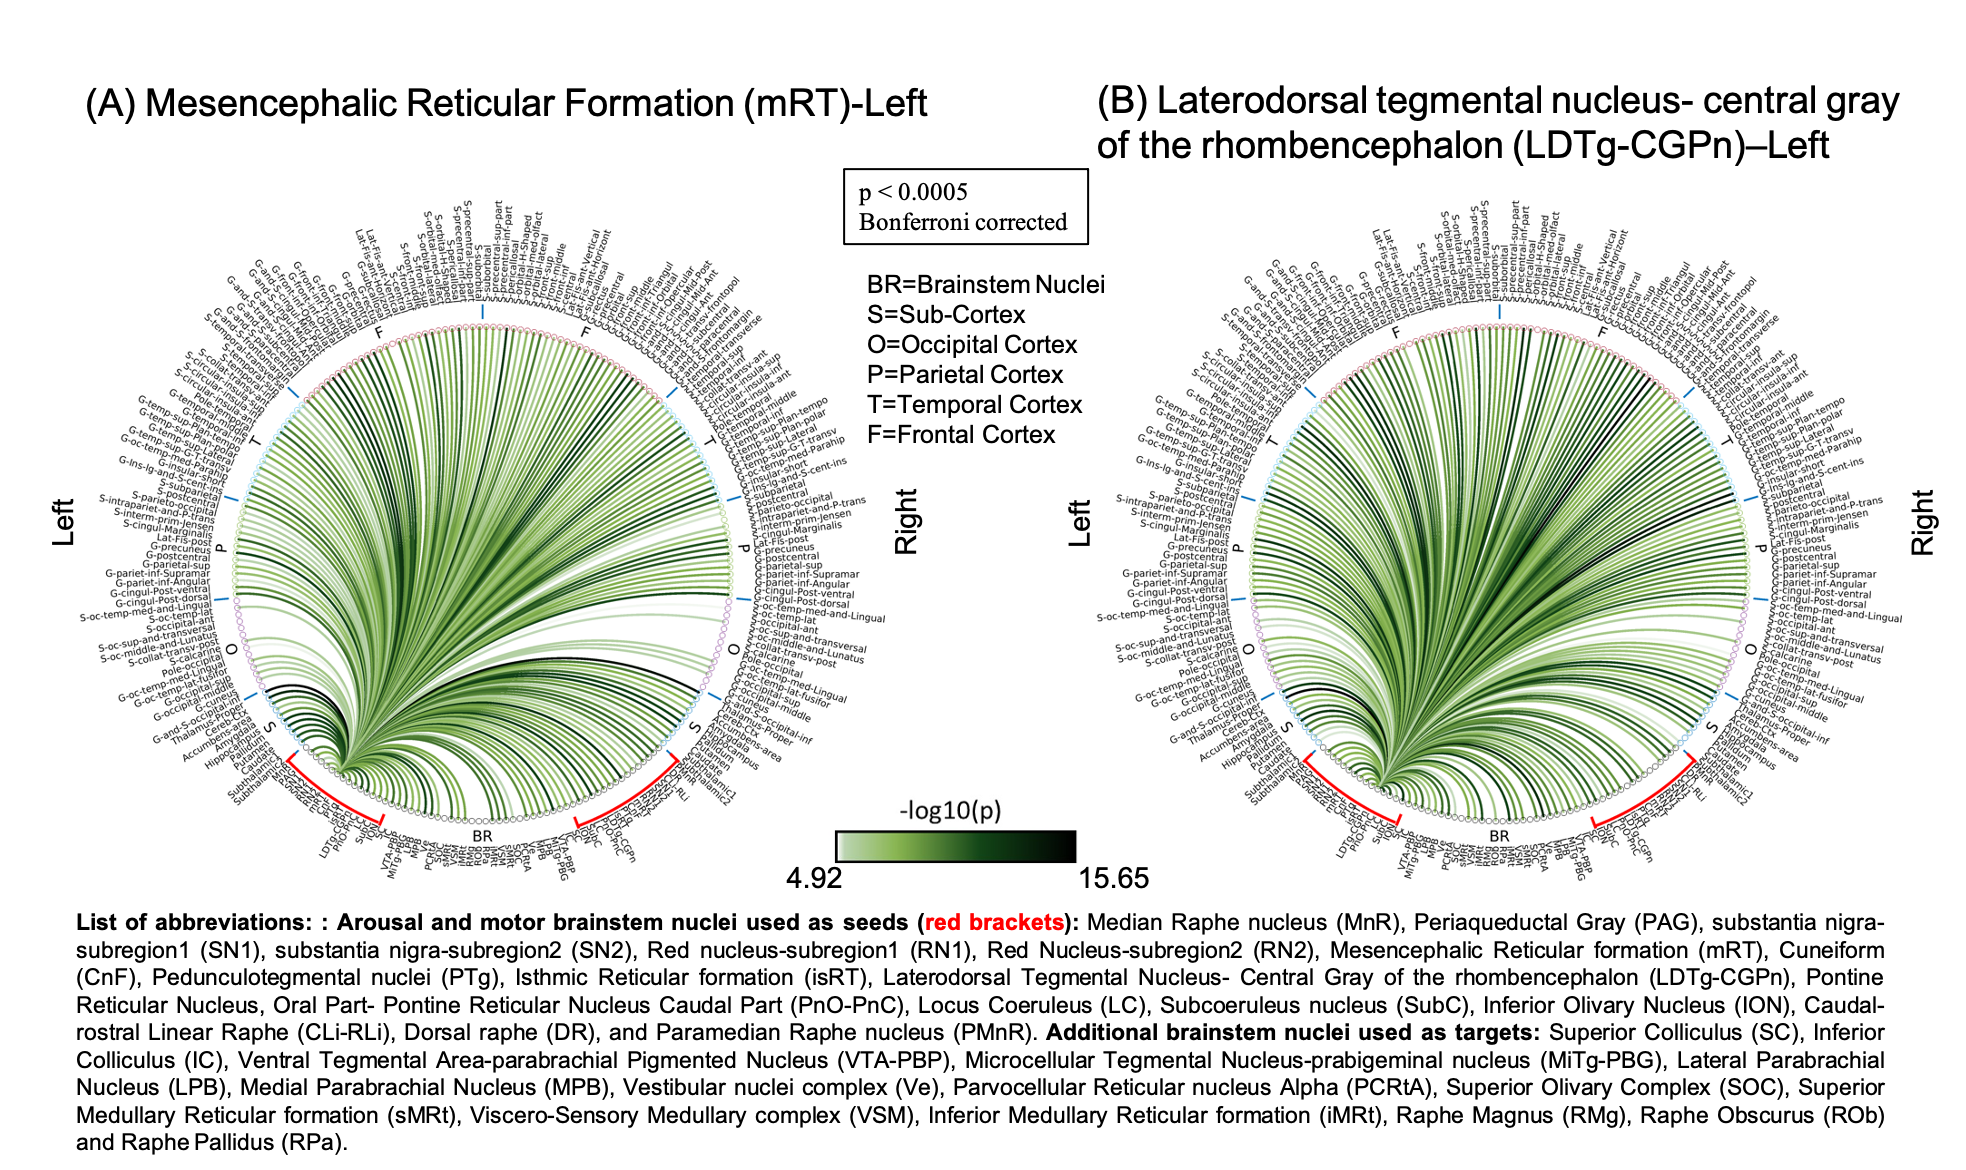
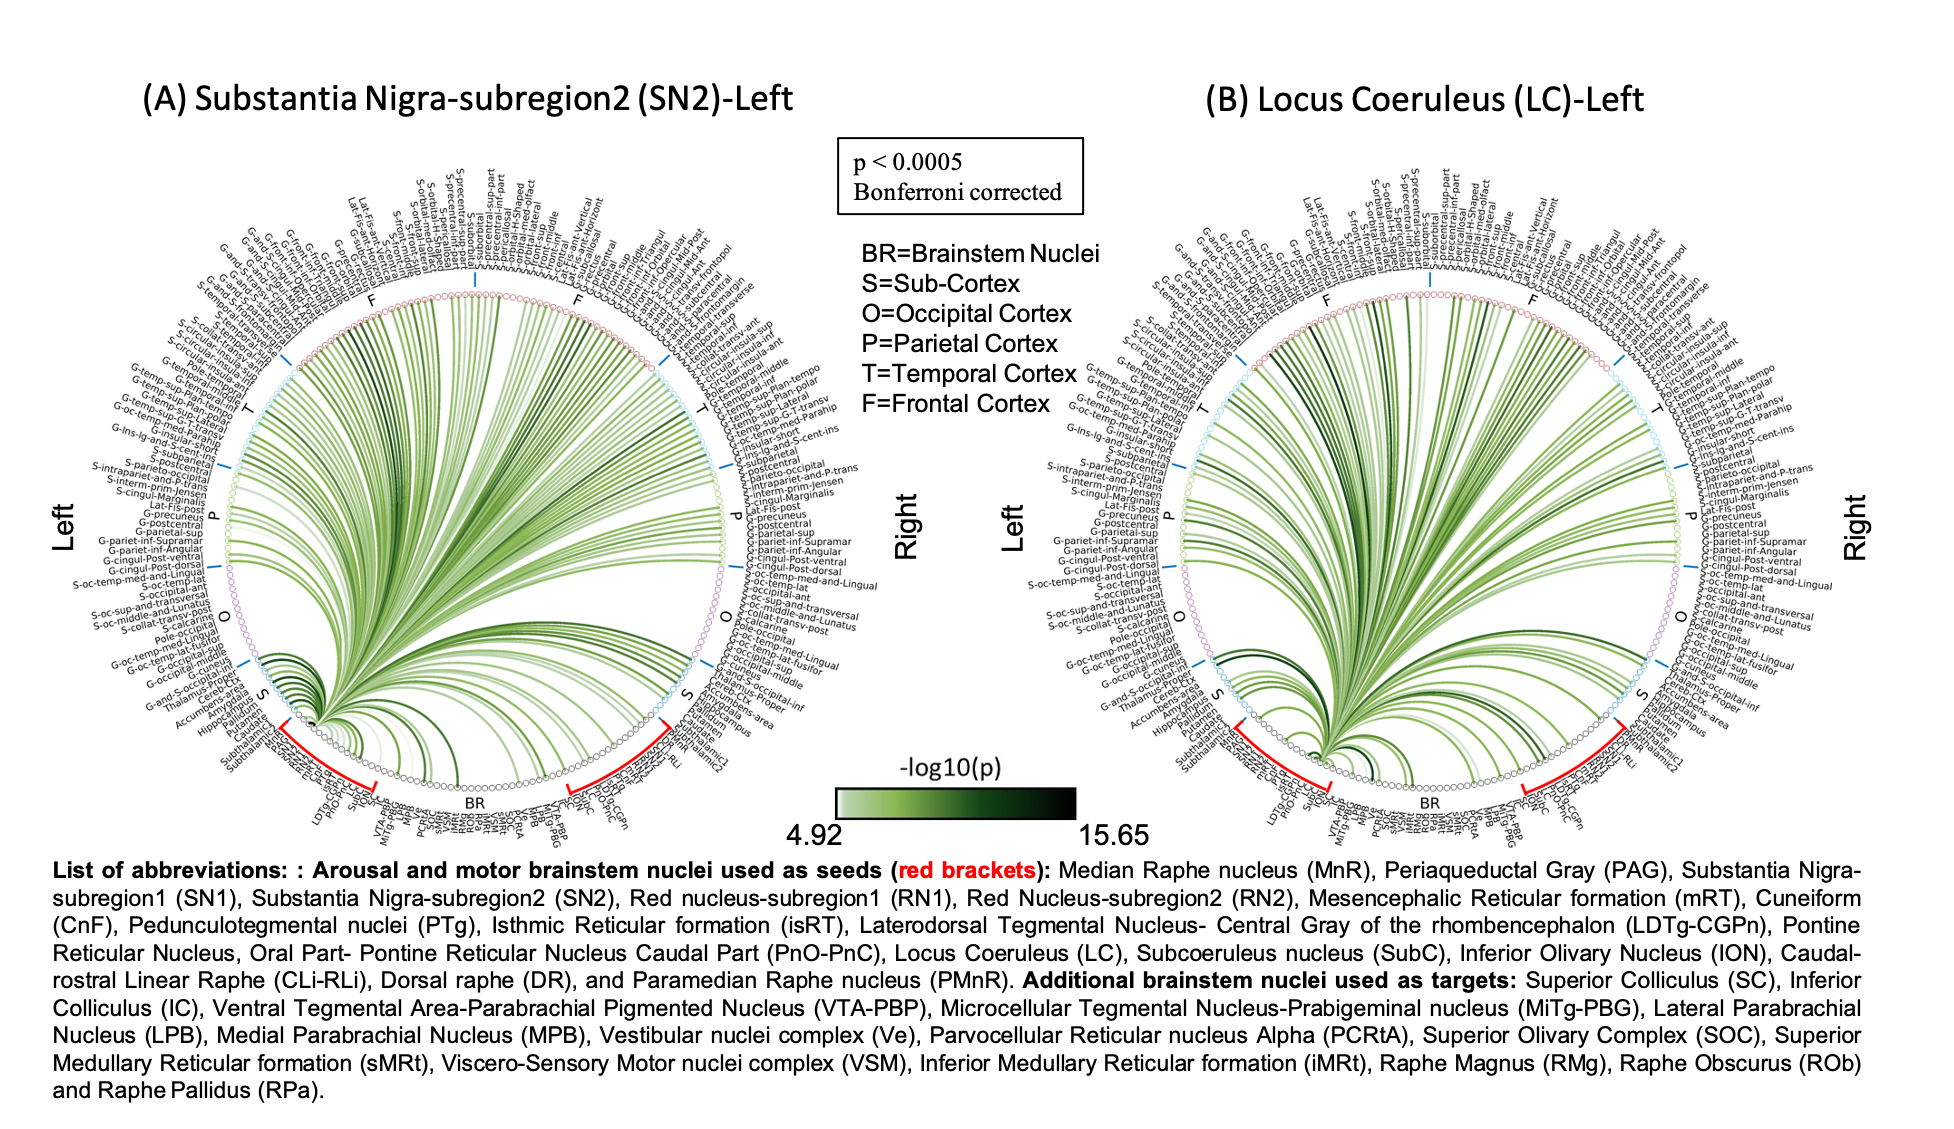
The group functional connectivity matrix (Figure 1A) and connectome (Figure 1B) of arousal and motor brainstem nuclei exhibited specific connectivity with other brainstem nuclei and cortical and sub-cortical regions. All the nuclei showed high left/right symmetry (laterality index < 23%) and high connectivity degree (Figure 1C, 11 network hubs). Each individual nucleus connectivity (Figures 2-4) showed several links matching existing literature8. Comparison of 3 Tesla to 7 Tesla connectivity results (Figure 5) indicated good translation of our brainstem connectome approach to conventional fMRI, especially for cortical and subcortical (non-brainstem) targets and to a lesser extent for brainstem targets.Conclusion
This functional connectome of 18 arousal and motor brainstem nuclei with the rest of the brain might provide a more comprehensive understanding of the arousal, sleep and accompanying motor function in living humans in health and disease condition.Acknowledgements
MGH-Claflin-Distinguished-Scholar; Harvard-Mind-Brain-Behavior-Faculty-Award; NIH-NIBIB-K01EB019474; NIH-NIDCD-R21-DC015888; NIA-R01-AG063982.References
1. Liu D, Dan Y. A Motor Theory of Sleep-Wake Control: Arousal-Action Circuit. Annu Rev Neurosci. 2019; 42:27-46.
2. Bianciardi M, Toschi N, Edlow BE, et al. Toward an in vivo neuroimaging template of human brainstem nuclei of the ascending arousal, autonomic, and motor systems. Brain Connect. 2015; 5(10): 597-607.
3. Frackowiak RSJ, Friston KJ, Frith CD, et al. editors. Human Brain Function. Academic Press USA, 1997.
4. Avants BB, Tustison NJ, Song G, Cook PA, Klein A, Gee JC. A reproducible evaluation of ANTs similarity metric performance in brain image registration. Neuroimage. 2011; 54(3):2033-44.
5. Desikan RS, Segonne F, Fischl B, et al. An automated labeling system for subdividing the human cerebral cortex on MRI scans into gyral based regions of interest. Neuroimage. 2006; 31(3): 968-980.
6. Glover GH, Li TQ, Ress D. Image-based method for retrospective correction of physiological motion effects in fMRI: RETROICOR. Magn Reson Med. 2000; 44(1):162-7.
7. RW Cox. AFNI: Software for analysis and visualization of functional magnetic resonance neuroimages. Computers and Biomedical Research. 1996; 29(3):162-173.
8. Olszewski J, Baxter D, Karger S. (Ed.), 1954. Cytoarchitecture of the Human Brainstem, JB Lippincott Company, Philadelphia and Montreal North America; 1954.
Figures