3364
A phantom-based method for MRI relaxation time mapping data validation and harmonization1Department of Physics, University of Pavia, Pavia, Italy, 2Department of Medical Physics, ASST Grande Ospedale Metropolitano Niguarda, Milan, Italy, 3Department of Cardiology, ASST Grande Ospedale Metropolitano Niguarda, Milan, Italy, 4Department of Physics, University of Milan, Milan, Italy
Synopsis
A method for the MRI relaxation time measurement validation and harmonization is proposed: it relies on a phantom composed of vials filled with different concentrations of MnCl2 aqueous solutions, whose relaxation times are characterized as a function of both concentration and temperature, employing NMR techniques. The accuracy and the precision of fast mapping sequences developed for cardiac applications are better quantified through, respectively, the phantom characterization and the SD maps analysis. Scan-dependent recalibrations of the relaxation time maps can be performed relying on the ground-truth NMR values of the phantom, aiming to clinical intra- and inter-center harmonization.
Introduction
The clinical advantages offered by MRI relaxation time mapping techniques, which provide parametric maps of intrinsic magnetic properties of tissues carrying both qualitative and quantitative information, are well documented 1-5. Nevertheless, the problem of data intra- and inter-centric harmonization, also well known in the literature 6-11, is not resolved yet: accuracy and precision are fundamental factors to be considered for clinical applications 12,13.Taking inspiration from CT image recalibrations performed in the 80s 14,15, a ‘novel’ scanner-, software-, center-independent phantom-based method is proposed for the validation (both accuracy and precision) and the harmonization of the data obtained from MRI relaxation time maps.
Methods
The MRI phantom is composed of twelve 30 ml vials filled with different concentrations of manganese(II) chloride tetrahydrate (MnCl2 + 4 H2O, Sigma-Aldrich Co., St. Louis, MO, USA) in aqueous solutions 16.The reference T1 and T2 values at 1.5 T of the solutions have been measured with an NMR spectrometer (Tecmag Apollo spectrometer, Houston, TX, USA; Bruker electromagnet, Billerica, MA, USA) by scanning twelve smaller vials (2 ml), made of the same material and filled with the same solutions used for the 30 ml ones, using standard sequences: Inversion Recovery (IR) and Carr-Purcell-Meiboom-Gill (CPMG). The temperature dependence of relaxation time values has been characterized as well: the vials have been analyzed singularly inside a cryostat in which the temperature could be set and stabilized by balancing a flux of liquid nitrogen and a heating resistance; the temperature has been measured with a thermocouple close to the vial with a sensitivity of ±0.2 K.
The relaxation times maps of the phantom have been collected using a Siemens Magnetom Aera (1.5 T, Siemens Healthineers, Erlangen, Germany) employing fast sequences developed for cardiac applications with heart-rate triggering: MOLLI 17 (MOdified Look-Locker Inversion recovery) and T2-prep TrueFISP 18 (Fast Imaging with Steady Precession). A wide range of heart-rates has been simulated during the acquisitions.
A custom Matlab script, named ‘swSD’, has been implemented and used for the analysis of the images: it provides both relaxation time and SD (Standard Deviation, measured as the 68% confidence bound of the fitted relaxation time value) map measurements.
Results
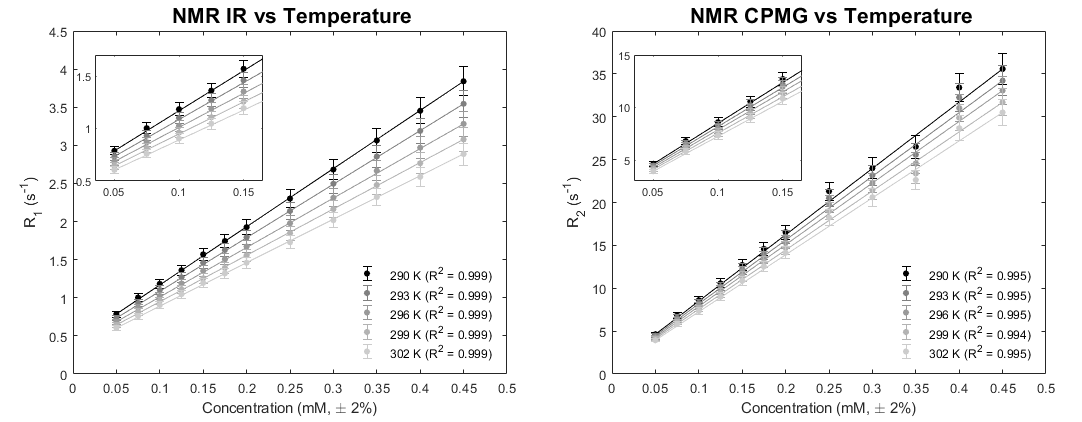
The NMR results related to the dependence of relaxation times from MnCl2 concentration and from temperature are shown in Figure 1. An experimental error of ±5% was applied to all values due to previous studies on the systematic error of the NMR experimental setup.The expected linearity between the relaxation rates R1 = 1/T1 and R2 = 1/T2 and the MnCl2 concentration, from the Solomon-Bloembergen-Morgan theory of aqueous paramagnetic dilute solution relaxation 19,20, has been well observed at every temperature (R2 > 0.99). The linearity assumed for relaxation times as a function of temperature has been also found for all the vials (R2 > 0.99): this assumption is valid since a small range of temperatures, nearby the room temperature, has been explored.
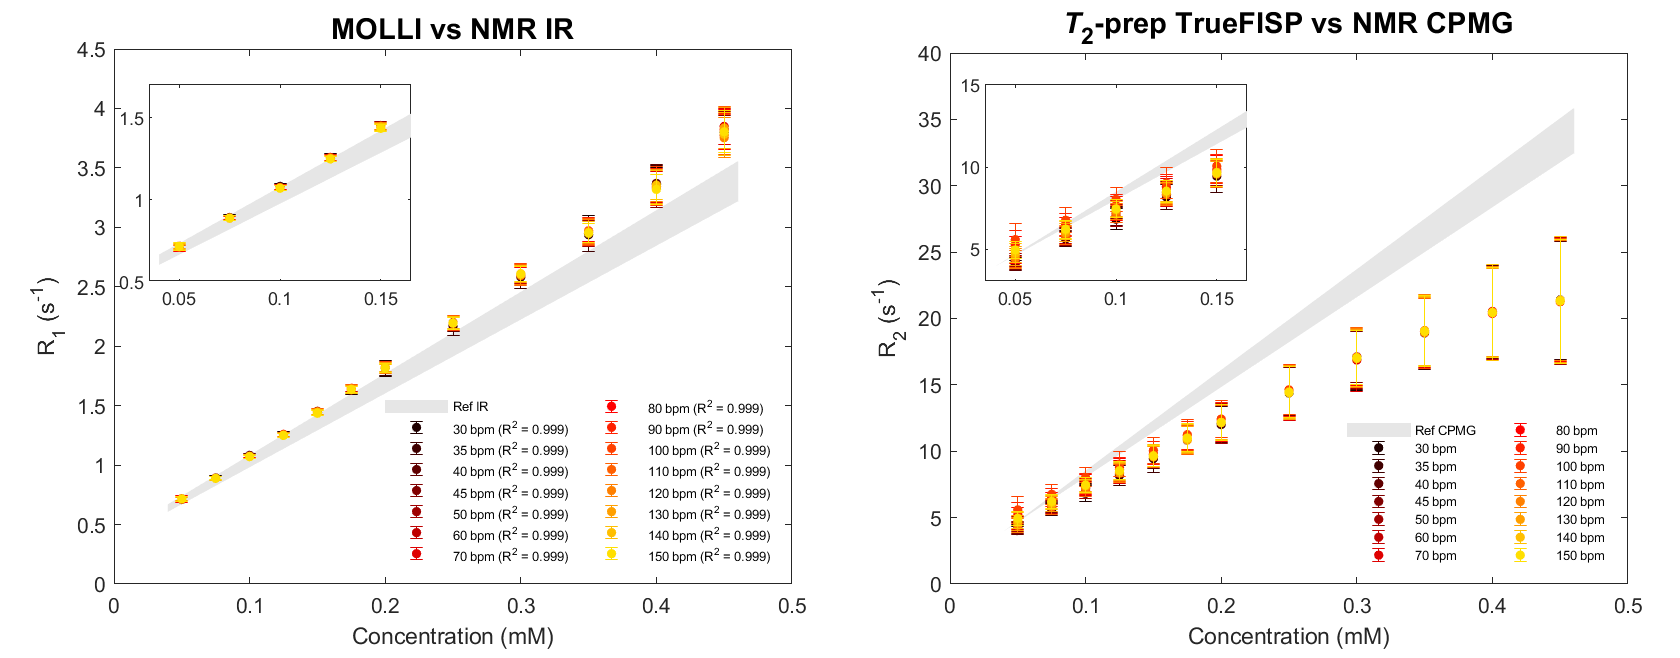
The comparisons between MRI results and NMR reference values are illustrated in Figure 2. Since MRI acquisitions have been performed generally at different temperatures with respect to the NMR measurements, the linear regression of NMR data as a function of the temperature allows to determine the relaxation times reference values of each vial at all temperatures.
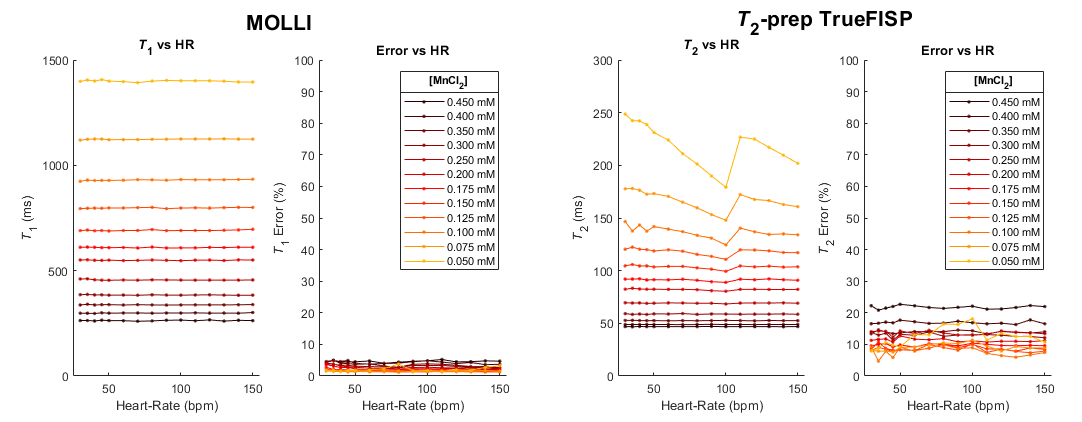
The dependence of both the relaxation times and the errors calculated from the swSD software at different simulated heart-rates is shown in Figure 3.
Discussion
The MOLLI results, moderately dependent on the simulated heart-rate (Figure 3), still present the expected linear behavior (all R2 > 0.999), even if an underestimation of the T1 values occurs. The T2-prep TrueFISP results show more complicated scan-dependent behaviors since the linear trend predicted by the theory is lost for every simulated heart-rate.The discrepancies found for MOLLI and T2-prep TrueFISP sequences from reference values, well known in the literature, can be observed in Figure 2, especially for the vials with the highest concentrations: a sequence-scanner-software dependent recalibration can be applied as long as a simultaneous scan of both the patient and the phantom is performed.
The error propagation must be considered for the recalibration of the relaxation time maps: the analysis performed with the swSD allows to highlight that the error of a measured relaxation time is not only dependent on the homogeneity of the ROI of the map in which is calculated, but also on other data processing (fitting, reconstruction algorithm, movement corrections, etc.).
Conclusion
A robust method for the evaluation of the performances (accuracy and precision) of mapping sequences is proposed, allowing further steps towards data harmonization and optimization. The scanner-independent and center-independent phantom-based method here illustrated, could be a powerful instrument for the recalibration of in vivo relaxation time maps acquisitions.Acknowledgements
No acknowledgement found.References
1. Cheng H-LM, Stikov N, Ghugre NR, Wright GA. Practical medical applications of quantitative MR relaxometry. J Magn Reson Imaging 2012;36:805-824.
2. Salerno M, Kramer CM. Advances in parametric mapping with CMR imaging. JACC: Cardiovascular Imaging 2013;6(7):806-822.
3. Kim PK, Hong YJ, Im DJ, et al. Myocardial T1 and T2 mapping: techniques and clinical applications. Korean J Radiol 2017;18(1):113-131.
4. Wolf M et al. Magnetic resonance imaging T1-and T2-mapping to assess renal structure and function: a systematic review and statement paper. Nephrology Dialysis Transplantation 2018;33(2):ii41-ii50.
5. Luetkens JA. et al. Quantification of liver fibrosis at T1 and T2 mapping with extracellular volume fraction MRI: preclinical results. Radiology 2018;288(3):748-754.
6. Raman FS, Kawel-Boehm N, Gai N, et al. Modified look-locker inversion recovery T1 mapping indices: assessment of accuracy and reproducibility between magnetic resonance scanners. J Cardiovasc Magn Reson 2013;15:64.
7. Roujol S, Weingärtner S, Foppa M, et al. Accuracy, precision, and reproducibility of four T1 mapping sequences: a head-to-head comparison of MOLLI, ShMOLLI, SASHA, and SAPPHIRE. Radiology 2014;272(3):683-689.
8. Baeßler B, Schaarschmidt F, Stehning C, Schnackenburg B, Maintz D, Bunck AC. A systematic evaluation of three different cardiac T2-mapping sequences at 1.5 and 3T in healthy volunteers. Europ J Radiol 2015;84:2161-2170.
9. Baeßler B et al. Reproducibility of three different cardiac T2‐mapping sequences at 1.5 T. J Magn Reson Imaging 2016;44(5):1168-1178.
10. Shao J et al. Accuracy, precision, and reproducibility of myocardial T1 mapping: A comparison of four T1 estimation algorithms for modified look‐locker inversion recovery (MOLLI). Magn Reson Med 2017;78(5):1746-1756.
11. Graham-Brown MPM et al. Native T1 mapping: inter-study, inter-observer and inter-center reproducibility in hemodialysis patients. J Cardiovasc Magn Reson 2017;19(1):1-10.
12. Kellman P, MS Hansen. T1-mapping in the heart: accuracy and precision. J Cardiovasc Magn Reason 2014;16(1):2.
13. Bano W et al. On the accuracy and precision of cardiac magnetic resonance T2 mapping: A high‐resolution radial study using adiabatic T2 preparation at 3 T. Magn Reson Med 2017;77(1):159-169.
14. Cann CE, HK Genant. Precise measurement of vertebral mineral content using computed tomography. J Comp Assist Tomogr 1980;4(4):493-500.
15. Kalender WA, C Suess. A new calibration phantom for quantitative computed tomography. Med Phys 1987;14(5):863-866.
16. Thangavel K, Saritaş EU. Aqueous paramagnetic solutions for MRI phantoms at 3 T: A detailed study on Relaxivities. Turk J Elec Eng & Comp Sci 2017;25:2108-2121.
17. Messroghli DR et al. Myocardial T1 mapping: application to patients with acute and chronic myocardial infarction. Magn Reson Med 2007;58(1):34-40.
18. Huang T-Y et al. T2 measurement of the human myocardium using a T2‐prepared transient‐state TrueFISP sequence. Magn Reson Med 2007;57(5):960-966.
19. Solomon I. Relaxation process in a system of two spins. Phys Rev 1955;99(2):559-566.
20. Bloembergen N, Morgan LO. Proton relaxation times in paramagnetic solutions. Effects of electron spin relaxation. J Chem Phys 1961;34(3):842-850.
Figures