3357
A novel MRI phantom to study the fluid dynamics of the glymphatic system: a proof-of-concept study1Oslo University Hospital, Oslo, Norway, 2University of South-Eastern Norway, Drammen, Norway
Synopsis
The proposed glymphatic system is hypothesized to be a waste-clearance system of the cerebrospinal fluid (CSF) through the perivascular and interstitial spaces of the brain. The details of this system, and its contribution to the delivery of nutrients and eliminating waste products, are yet to be established. Here we present a tailored MRI phantom to simulate the fluid dynamics of the CSF in the perivascular space. This glymphatic ultra-slow flow phantom facilitates testing of MRI flow measurements in a controlled environment, enabling optimization of MRI scan parameters to allow accurate measurements of glymphatic flow in the human brain.
Introduction
The proposed glymphatic system and its potential importance give rise to key question regarding its anatomy and function in the human brain [1], [2]. An essential part of this system is the perivascular spaces (PVSs) which are cerebrospinal fluid (CSF) filled channels that surround the blood vessels in the brain. The fluid dynamics of CSF along these spaces may play an important role in glymphatic function, contributing to the delivery of nutrients, eliminating waste products, and offering a potential pathway for therapeutic drugs to the brain parenchyma. The rate of the glymphatic flow is thought to be ultra-slow, measuring around 50 µm/s in a mouse ear [3], and 18.7 µm/s in mice PVS [4]. However, the details of this system in humans are yet to be established. To gain knowledge about the potential glymphatic flow in humans, and to what extent it contributes to pathology and providing novel therapeutic strategies, a non-invasive ultra-slow flow measurement technique is needed. Currently, however, few methods exist, thus halting detailed understanding of glymphatic function in the human brain. Magnetic Resonance Imaging (MRI) have shown potential in measuring glymphatic flow in animal studies [5]. Although MRI is well-established for measuring flow-rates at magnitudes associated with blood perfusion in the brain, little is known about its accuracy in measuring ultra-slow flow. Attempting to measure flow in the PVS using MRI represents a technical challenge that needs to be addressed. Techniques currently available that may meet this challenge in deep brain tissues are MRI of spin displacement probability density function (known as the propagator), phase contrast MRI (PC-MRI), and diffusion tensor MRI. To assess the ability and validity of these techniques in measuring ultra-slow flow, they need to be tested in a controlled environment. We here present a novel MRI glymphatic flow phantom with multiple regions that mimics CFS-filled PVS and vascular space with pulsatile flow. As a proof-of-concept, we investigated the potential of diffusion weighted MRI and quantitative flow (Qflow) MRI to monitor the simulated perivascular flow.Materials and Methods
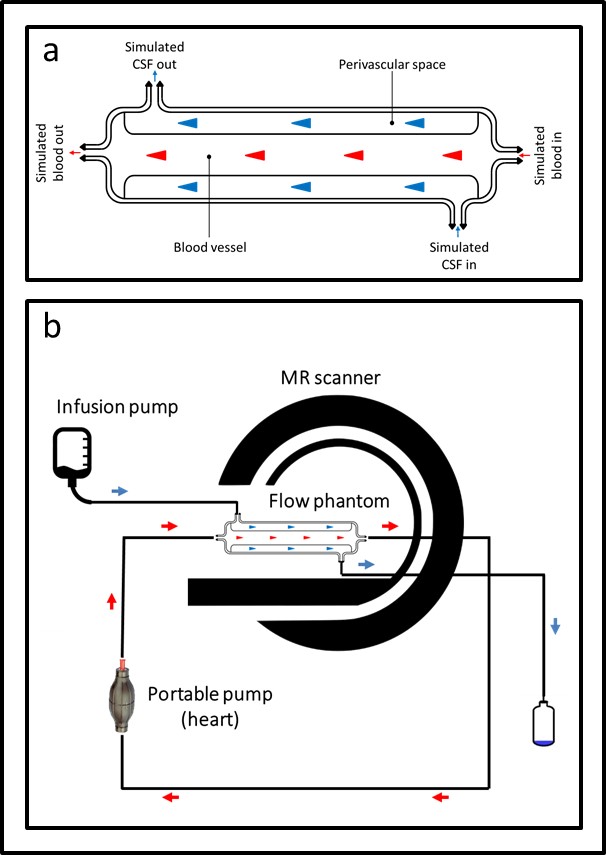
Figure 1 shows a schematic description of the phantom design (a) together with the experimental setup (b). This phantom was designed using the Blender 3D creation suite, and 3D printed using two different printing materials: PA12, a general-use plastic material, and TPE, a thermoplastic elastomer with rubber-like properties. Fluid (water) was pushed through the simulated perivascular space at a flow-rate of approx. 65 µm/s and 130 µm/s using an infusion pump, while pulsatile fluid was achieved through the simulated vascular space using a manual hand pump. Three methods were used to monitor the separate flow components in the phantom. The ultra-slow flow in the simulated perivascular space was assessed using phase images obtained with two diffusion weighted MRI sequences with the following key scan parameters: DW-TSE: TR = 2000 ms, TE = 74 ms, FA = 90, acquisition matrix = 128×114, FoV = 230×230 mm, b-value = 500 s/mm2, slice thickness = 4 mm and Segmented DW-EPI: TR = 2000 ms, TE = 83 ms, FA = 90, Echo train length = 15, acquisition matrix = 128×105, FoV = 230×230 mm, b-value = 1000 s/mm2, slice thickness = 4 mm. Further, the pulsatile flow in the simulated vascular space was assessed using a phase contrast Qflow sequence with the following key scan parameters: VENC = 10, TR = 11 ms, TE = 7 ms, FA = 90, acquisition matrix = 256×179, FoV = 150×150 mm, slice thickness = 4 mm. All imaging was performed on a Philips 3T Ingenia system.Results
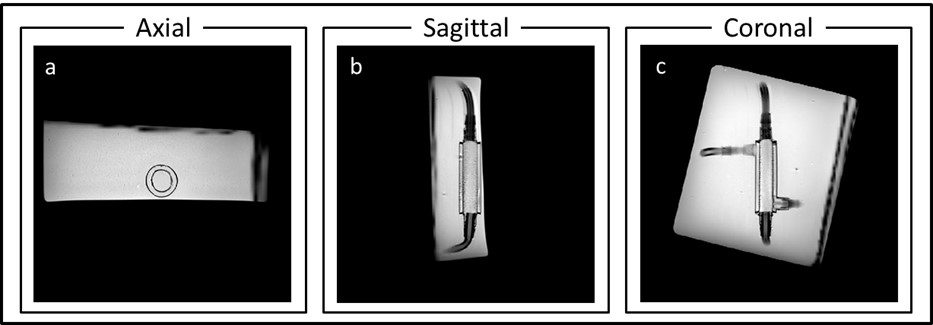
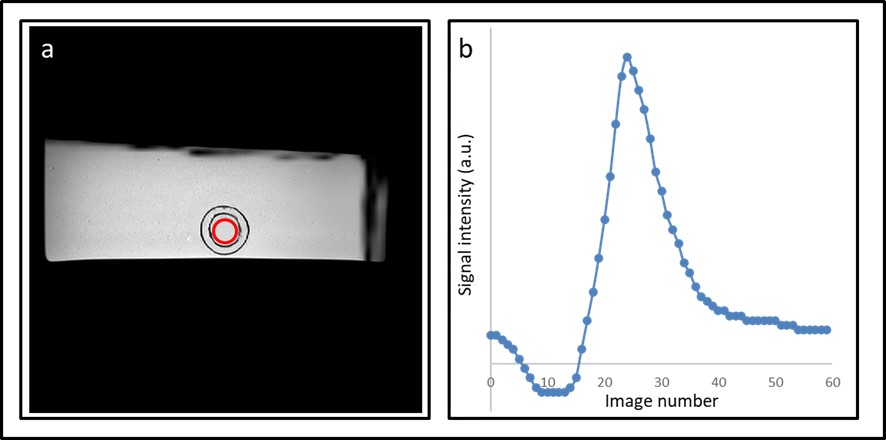
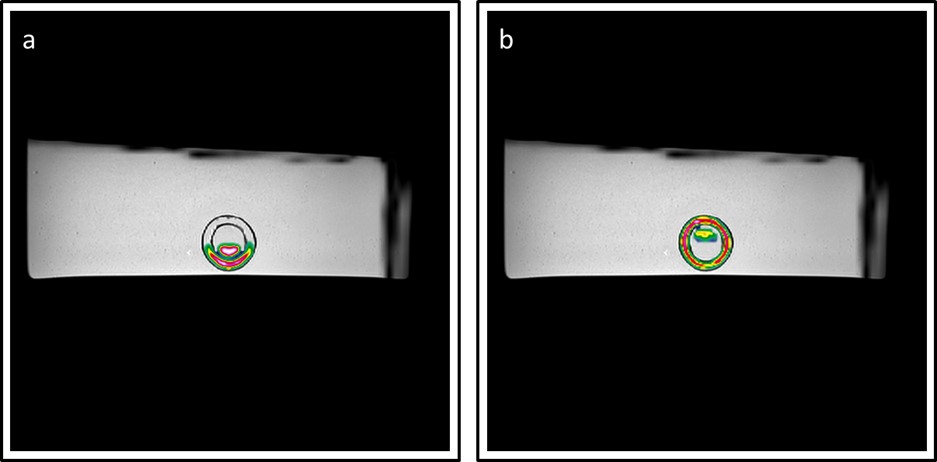
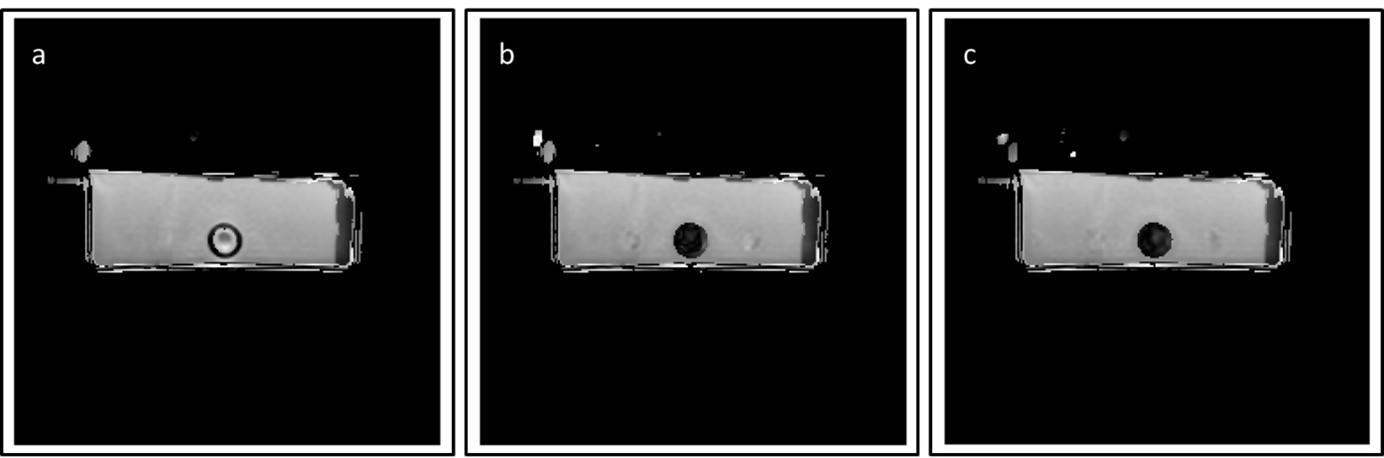
Figure 2 shows a high-resolution depiction of the glymphatic flow phantom in three image-planes. Furthermore, figure 3 shows the resulting flow measurements in the simulated vascular space using Qflow MRI. Figure 4 shows the ultra-slow flow assessments in the simulated perivascular space as measured by diffusion weighted MRI. These results indicate that we can detect flow rates as low as approx. 65 µm/s (Fig. 4a). However, in the presence of pulsatile flow in the inner tube, the current ultra-slow flow sequence was not able to measure flow in the perivascular space (Fig. 5).Discussion
This work shows the proof-of-concept for applying an MRI phantom for simulating and measuring pulsatile- and ultra-slow flow using MRI. The challenging task of measuring the CSF flow in the perivascular space with the presence of pulsating flow of blood in the vascular system was simulated with the phantom. As revealed by our phantom designed, measuring slow perivascular flow even in a controlled environment is difficult owing to high velocity flow-induced artifacts and pulsatile motion. Our phantom is therefore a reasonable setup to identify the lower limits of a MR sequence setup, while manipulating relaxation times in the different compartments to mimic those of tissue, blood and CSF. The significance of this ultra-slow flow phantom is the application of multiple known flow velocities, which facilitates testing of the accuracy of MRI sequences, as well as identifying and solving challenges in a controlled environment. This knowledge can be used to understand in-vivo measurements, and to optimize MRI scan parameters to allow accurate measurements of glymphatic flow in the human brain.Acknowledgements
No acknowledgement found.References
1. N. A. Jessen, A. S. F. Munk, I. Lundgaard, and M. Nedergaard, “The Glymphatic System: A Beginner’s Guide,” Neurochem. Res., vol. 40, no. 12, pp. 2583–2599, Dec. 2015.
2. M. K. Rasmussen, H. Mestre, and M. Nedergaard, “The glymphatic pathway in neurological disorders,” The Lancet Neurology, vol. 17, no. 11. 2018.
3. C. Blatter et al., “In vivo label-free measurement of lymph flow velocity and volumetric flow rates using Doppler optical coherence tomography,” Sci. Rep., vol. 6, no. 1, pp. 1–10, Jul. 2016.
4. H. Mestre et al., “Flow of cerebrospinal fluid is driven by arterial pulsations and is reduced in hypertension,” Nat. Commun., vol. 9, no. 1, p. 4878, Nov. 2018.
5. I. F. Harrison et al., “Non-invasive imaging of CSF-mediated brain clearance pathways via assessment of perivascular fluid movement with diffusion tensor MRI,” elifesciences.org.
Figures