3353
3D printed head-shaped phantom with lipid layer and brain-mimicking metabolites for 7 Tesla MRI and MRSI
Rita Schmidt1,2, Ghil Jona3, and Edna Furman-Haran2,3
1Neurobiology, Weizmann Institute of Science, Rehovot, Israel, 2The Azrieli National Institute for Human Brain Imaging and Research, Weizmann Institute of Science, Rehovot, Israel, 3Life Sciences Core Facilities, Weizmann Institute of Science, Rehovot, Israel
1Neurobiology, Weizmann Institute of Science, Rehovot, Israel, 2The Azrieli National Institute for Human Brain Imaging and Research, Weizmann Institute of Science, Rehovot, Israel, 3Life Sciences Core Facilities, Weizmann Institute of Science, Rehovot, Israel
Synopsis
Moving to ultra-high fields (≥7T), the inhomogeneity of both RF and static magnetic fields increases, which motivates to design a realistic head-shaped phantom. In this study, a 3D-printed head-shaped phantom with brain mimicking metabolites and lipid layer examined for 7T MRI and MRSI. The phantom was designed to resemble the brain with respect to B0 and B1 distributions, metabolites and lipid layer. We examined it for 1H MRS and MRSI, especially in the lipid layer vicinity. We also demonstrated in EPI that the Fat Suppression pulse flip angle can be optimized to minimize the lipid artifact and reduce the SAR.
Introduction
Moving to ultra-high fields (≥7T), the inhomogeneity of both RF (B1) and static (B0) magnetic fields increases, which further motivates to design a realistic head-shaped phantom. Such phantoms provide images similar to the human brain and serve as a reliable tool for developing and examining methods in MRI. In this study, a 3D-printed head-shaped phantom with brain mimicking metabolites and subcutaneous lipid layer examined for 7T MRI and MRSI. The phantom was designed to resemble the brain with respect to B0 and B1 distributions, T1/T2 relaxation times, metabolite content, and the subcutaneous lipid layer. The MRS and MRSI pulse sequences require a set of RF pulses, including water and lipid suppression, as well as a set of refocusing pulses, which are prone to both B1 and B0 inhomogeneity. In this study, we examined the use of such phantom for 1H MRS and MRSI and for optimization in case of a lipid layer vicinity. In addition, EPI acquisition used for fMRI scans can reach high SAR when whole brain coverage is of interest. Here we demonstrate that the Fat Suppression pulse flip angle can be optimized to minimize the lipid artifact and reduce the SARMethods
The head-shaped container in this work was based on the Martinos Center’s “MGH Angel 001” 1,2. The phantom was designed to include three sub-sections – mimicking brain, muscle and lipid tissues3,4. The inner compartment was filled with a brain-mimicking mixture. The outer compartment was divided into two sections – the bottom one mimics muscle tissue, and the top one the lipid precranial layer. Gentle rolling during the agarose mixture filling allowed to generate thin layers on the outer shell surface that resemble skin/muscle and peanut oil was used to fill the left space5. The metabolite phantom included the main brain mimicking metabolites – see for details Ref. 4. Single voxel spectroscopy (SVS) on human and phantom was examined with LCModel fitting. In addition, SVS on phantom at two locations - central and close to the lipid layer (in the “visual cortex”) was examined with different spectral suppression parameters. EPSI) scan was used for MRSI acquisition with two sets of spectral width (SW) and spatial resolution. The Set #1 scan parameters were: TR/TE 2000/18 ms, FOV 300x300 mm2, in-plane resolution 4.3x4.3 mm2 (70x70 pixels), slice thickness 20 mm, single slice, esp 0.52ms, SW 960 Hz, total scan duration 2:20 minutes. The Set #2 scan parameters: TR/TE 2000/18 ms, FOV 260x260 mm2, in-plane resolution 8.7x4.0 mm2 (30x64 pixels), slice thickness 20 mm, single slice, esp 0.33 ms, SW 1500 Hz, total scan duration 2:08 minutes. Finally, EPI imaging with and without Fat Suppression was examined for lipid artifacts. The Fat Suppression flip angle was varied to minimize the lipid artifact while reducing the SAR.Results
The comparison of human and phantom B0 and B1 maps is shown in Figure 1. Images of the B0 maximal deviation projection clearly demonstrated the main inhomogeneity areas near nasal, eye and ear regions, that were similar both in the phantom and in the human brain results. The human B1 coefficient of variation was 37% and 28% for sagittal and axial scans, respectively, and that of the phantom was 23% and 18%, respectively. T1 and T2 relaxation times of the “brain” compartment were estimated in the central area as 1160±35 ms and 57±2 ms; those of the “lipid” compartment were estimated as 426±1 ms and 145±1 ms, respectively. Figure 2 shows representing sagittal and axial images of the phantom. Figure 3 shows SVS spectra and corresponding LCModel fit. The average standard deviation (SD) of the LCModel fitting (excluding GABA) was 4.8% for phantom and 3.6% for human. Figure 4 shows the EPSI results. Set #1 targeted high spatial resolution, which required reduction of the SW. The limited SW (~1000Hz) results in curved baseline in both spectrum edges due to the water peak (Fig.7c). Set #2 acquired lower spatial resolution with large enough SW for 7T 1H spectra. The figure shows the water magnitude images and the NAA and Cr images as well as representative spectra in voxels moving from the center of the phantom to the edge. Figure 5 shows EPI with varying Fat Suppression flip angle. For a flip angle of 80° a relatively low lipid artifact can be achieved (7%) while reducing the SAR by 15% , compared to the default 110°.Discussion
3D printed phantoms of high interest for 7T imaging and spectroscopic imaging, where B1 inhomogeneity affects the quality of water and lipid suppression pulses, and B0 inhomogeneity influences both water and lipid contamination. The B0 and B1 distribution measured in the phantom “brain” were in good agreement with human brain distribution, which is an important feature for the practical usage of the phantom. MRS, MRSI and MRI applications were examined. SVS scans on the phantom demonstrated a capability to optimize the spectral suppression parameters (depending on the application) for maximal NAA peak or minimal lipid artifact. The ability to exploit such a phantom to examine MRSI parameters was also demonstrated. Finally, reduction of SAR while minimizing the lipid artifact in EPI acquisition was shown.Acknowledgements
We are grateful to Dr. Assaf Tal’s lab for assistance in the brain-mimicking metabolites preparation and LCModel fitting, and to Tamar Hayon and Efrat Biton from the Bacteriology Unit at the Dept. of LSCF, for technical assistance and media preparation. We thank Shimon Banouz and Slava Kofman from Laser Modeling for their assistance in the 3D printing. Dr. E. Furman-Haran holds the Calin and Elaine Rovinescu Research Fellow Chair for Brain Research.References
[1] Guérin, B., (2016) Magn. Reson. Med 76(2), 540-554, [2] https://phantoms.martinos.org/MGH_Angel_001, [3] https://github.com/RitaSchmidt/3DRealisticHeadPhantomInMRI. [4] Jona et. al, NMR BioMed 2020. [5] Hines, C. (2009) J. Magn. Reson. Imag. 30(5), 1215-1222Figures
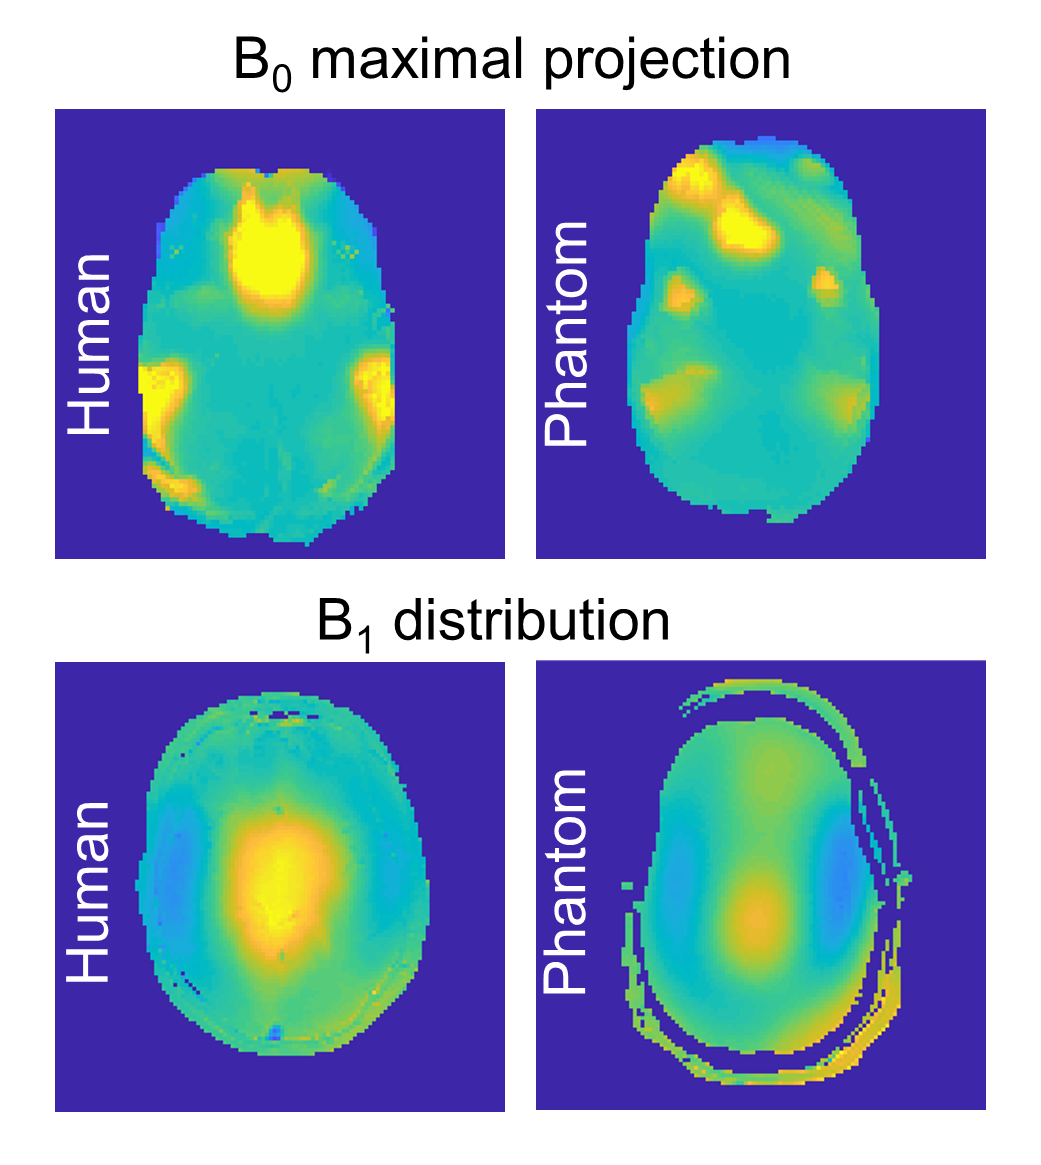
Figure 1: Maximal absolute B0 projection for
human (left) and phantom (right) with the same scaling. B1 distribution of the human (left)
and phantom (right) with the same scaling.
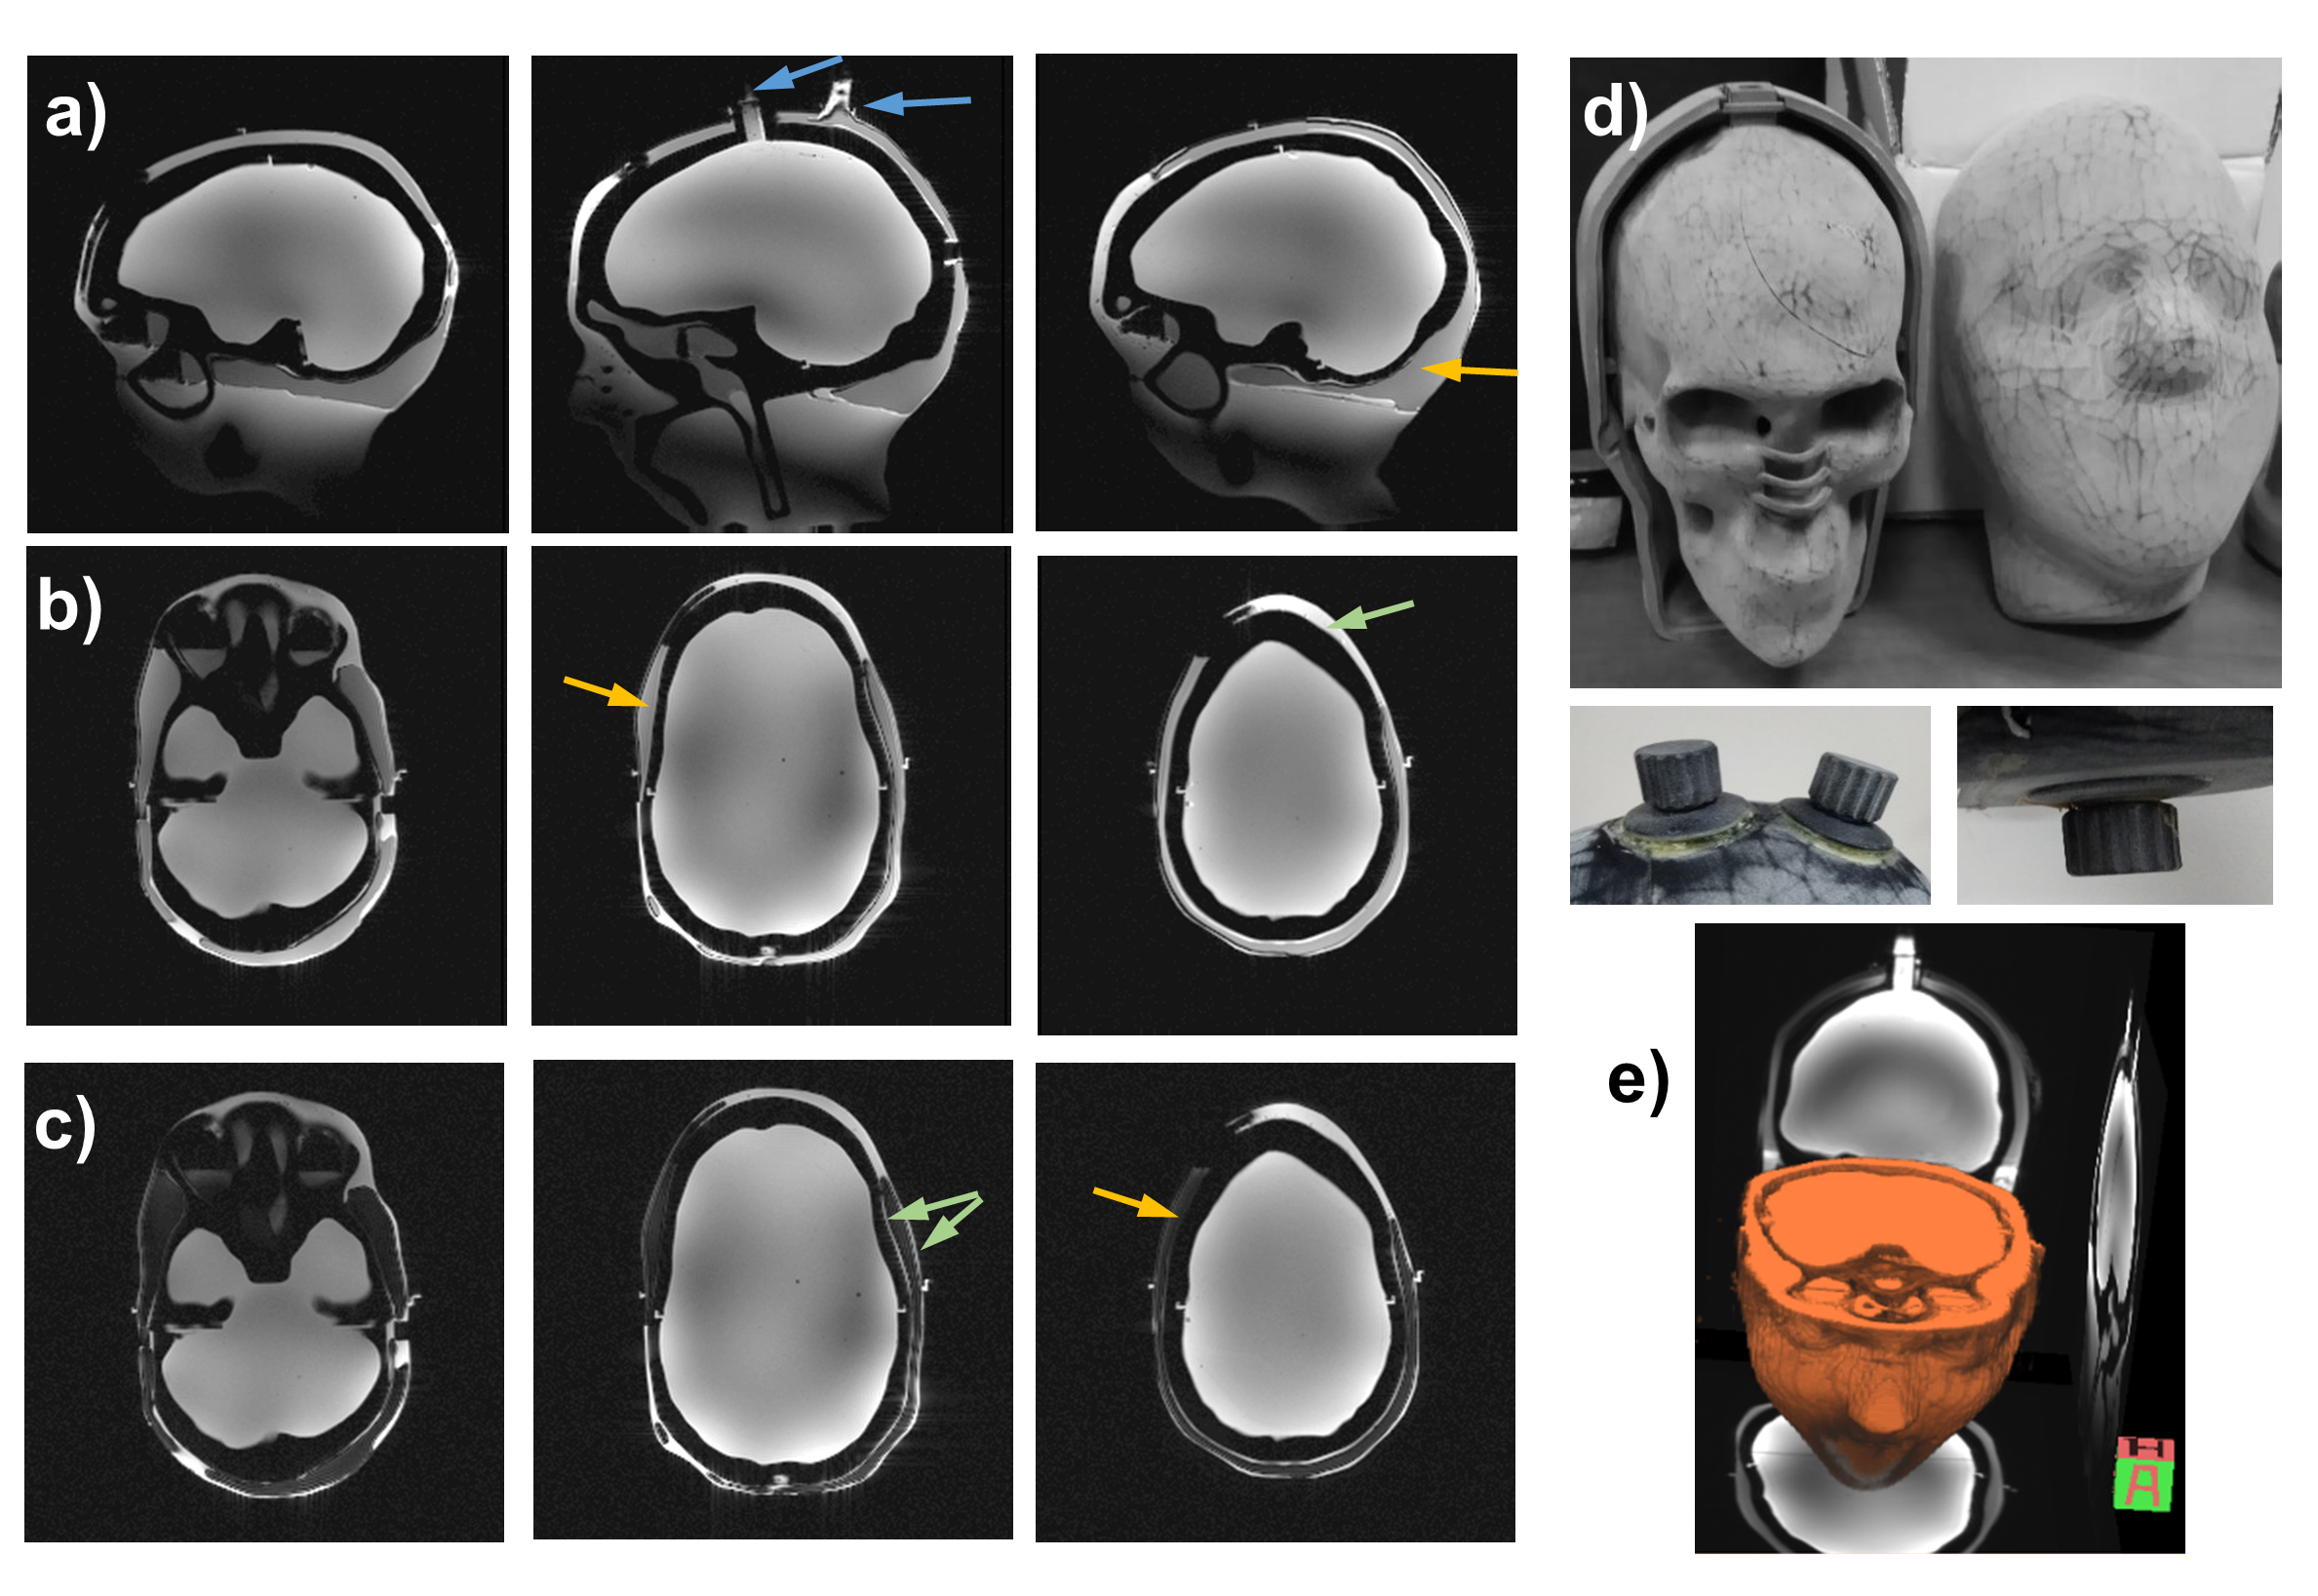
Figure
2: Images of the 3D head-shaped phantom. (a-c) Sagittal and axial GRE images of the
phantom without fat suppression (a and b) and with fat suppression (c).
The blue arrows show the opening for filling. The green arrows show the thin
layer generated around the lipid layer as well as the locally thicker layer of
the “muscle”, which improve the phantom’s resemblance to a realistic brain and
the orange arrows show the location of the “lipid” layer. (d) Photos of the 3D
printed structure (inner and outer halves), two screw caps (left) and bottom cap
(right). (e) 3D rendering of phantom images.
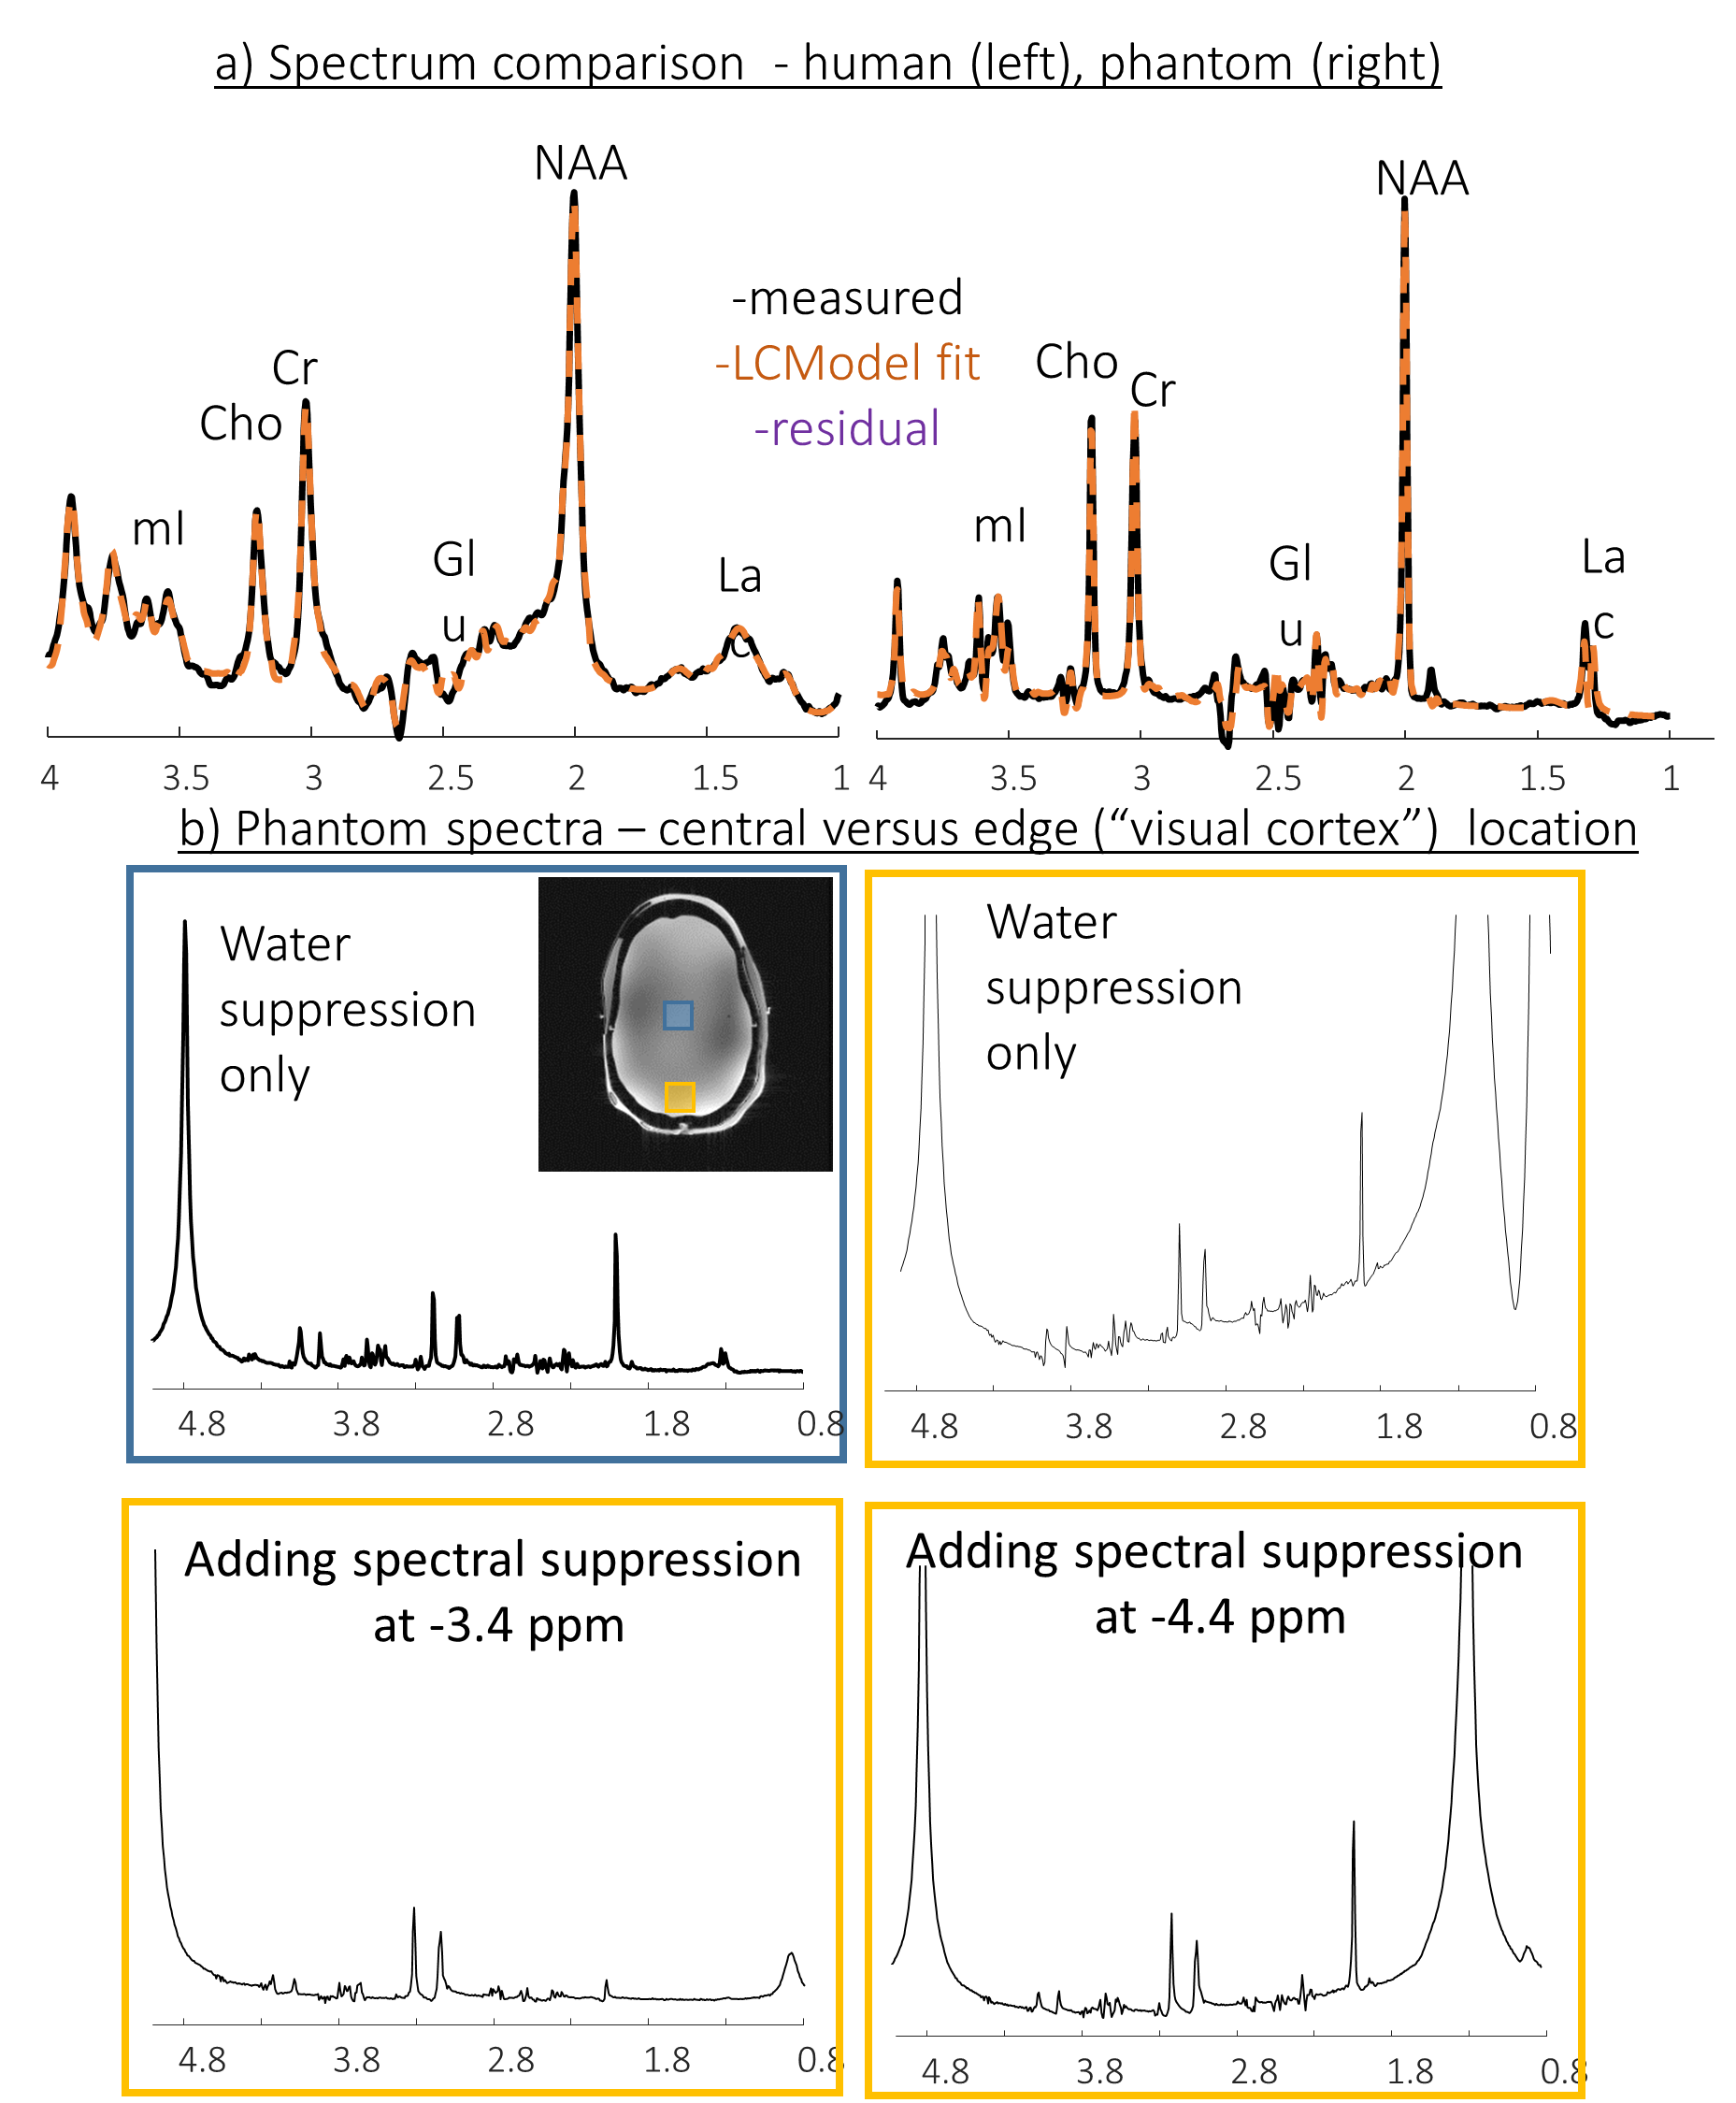
Figure 3: Single voxel spectroscopy. a)
white matter voxel in human (left) and central voxel in the phantom (b) Phantom
spectra – comparison of a central (blue box) and near lipid (“visual cortex”) (orange
box) voxels. The SVS near lipid voxel was repeated without Spectral
Suppression, and with Spectral Suppression at -3.4 ppm and at -4.4 ppm.
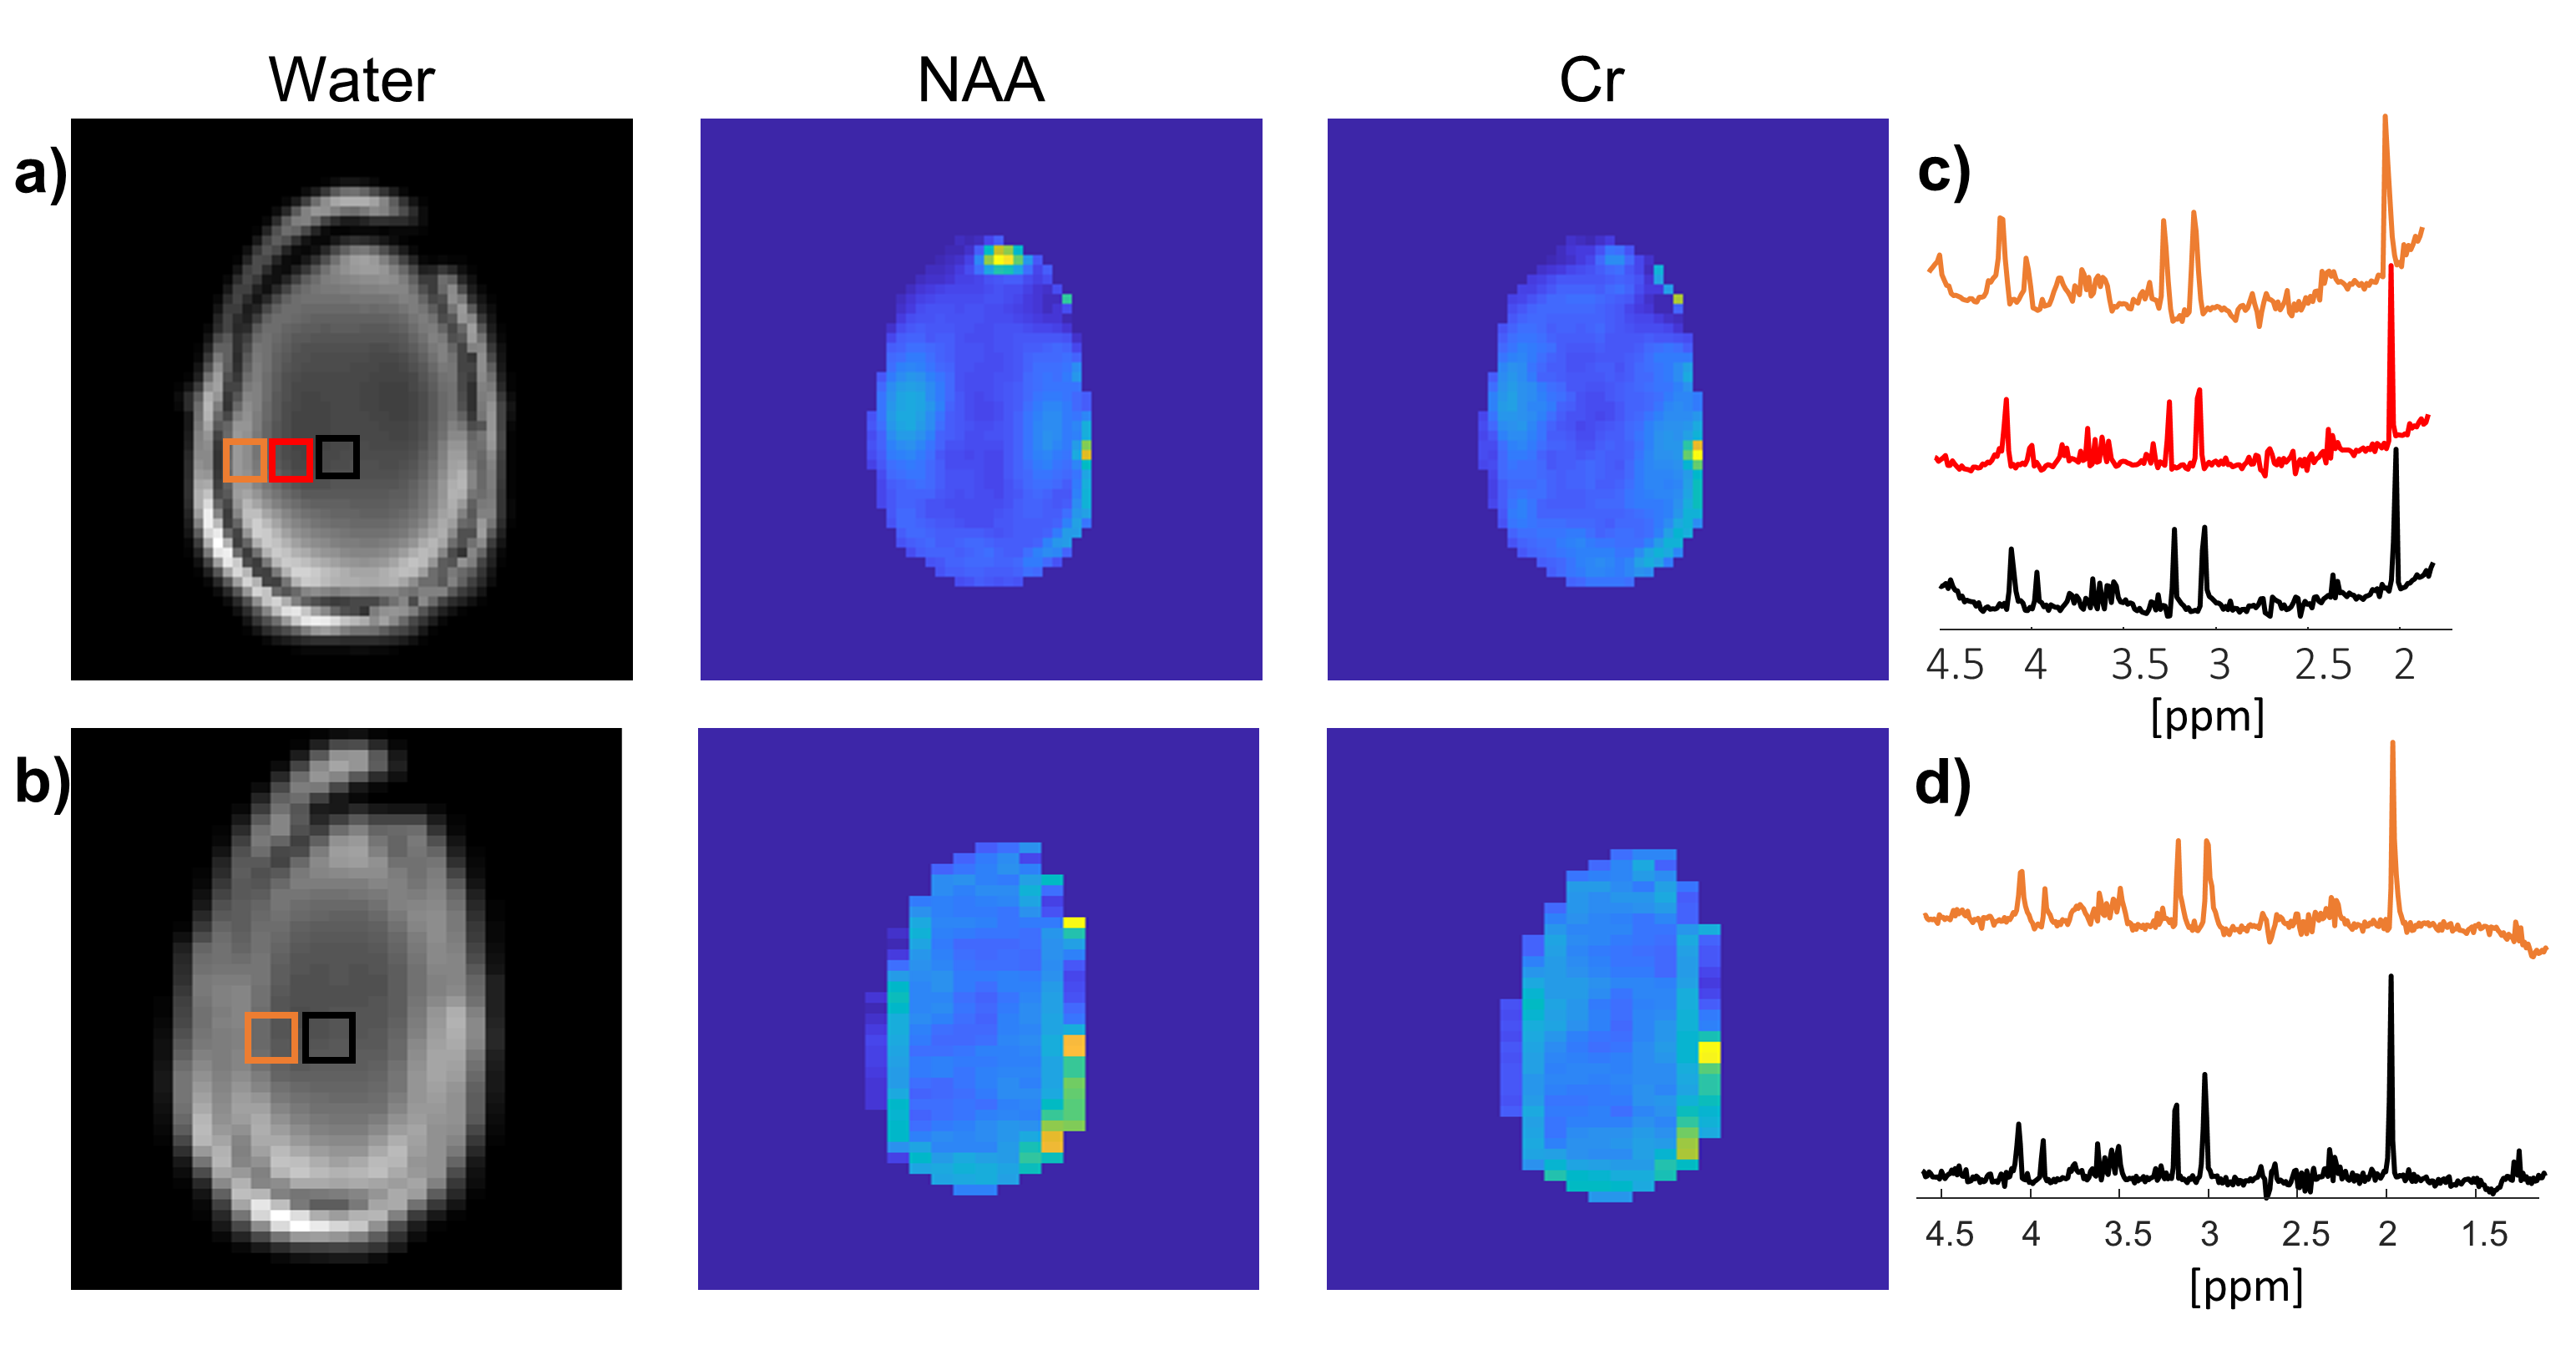
Figure 4:
1H brain-mimicking metabolite MRSI using EPSI. From
left to right - water magnitude, NAA and Cr images and spectrum for the regions
shown on the magnitude image for Set #1 (a and c) and #2 (b and d). The Set #1
scan parameters were: TR/TE 2000/18 ms, FOV 300x300 mm2, in-plane
resolution 4.3x4.3 mm2, slice thickness 20 mm, esp 0.52ms, SW 960
Hz, total scan duration 2:20 minutes. The Set #2 scan parameters: TR/TE 2000/18
ms, FOV 260x260 mm2, in-plane resolution 8.7x4.0 mm2,
slice thickness 20 mm, esp 0.33 ms, SW 1500 Hz, total scan duration 2:08
minutes.
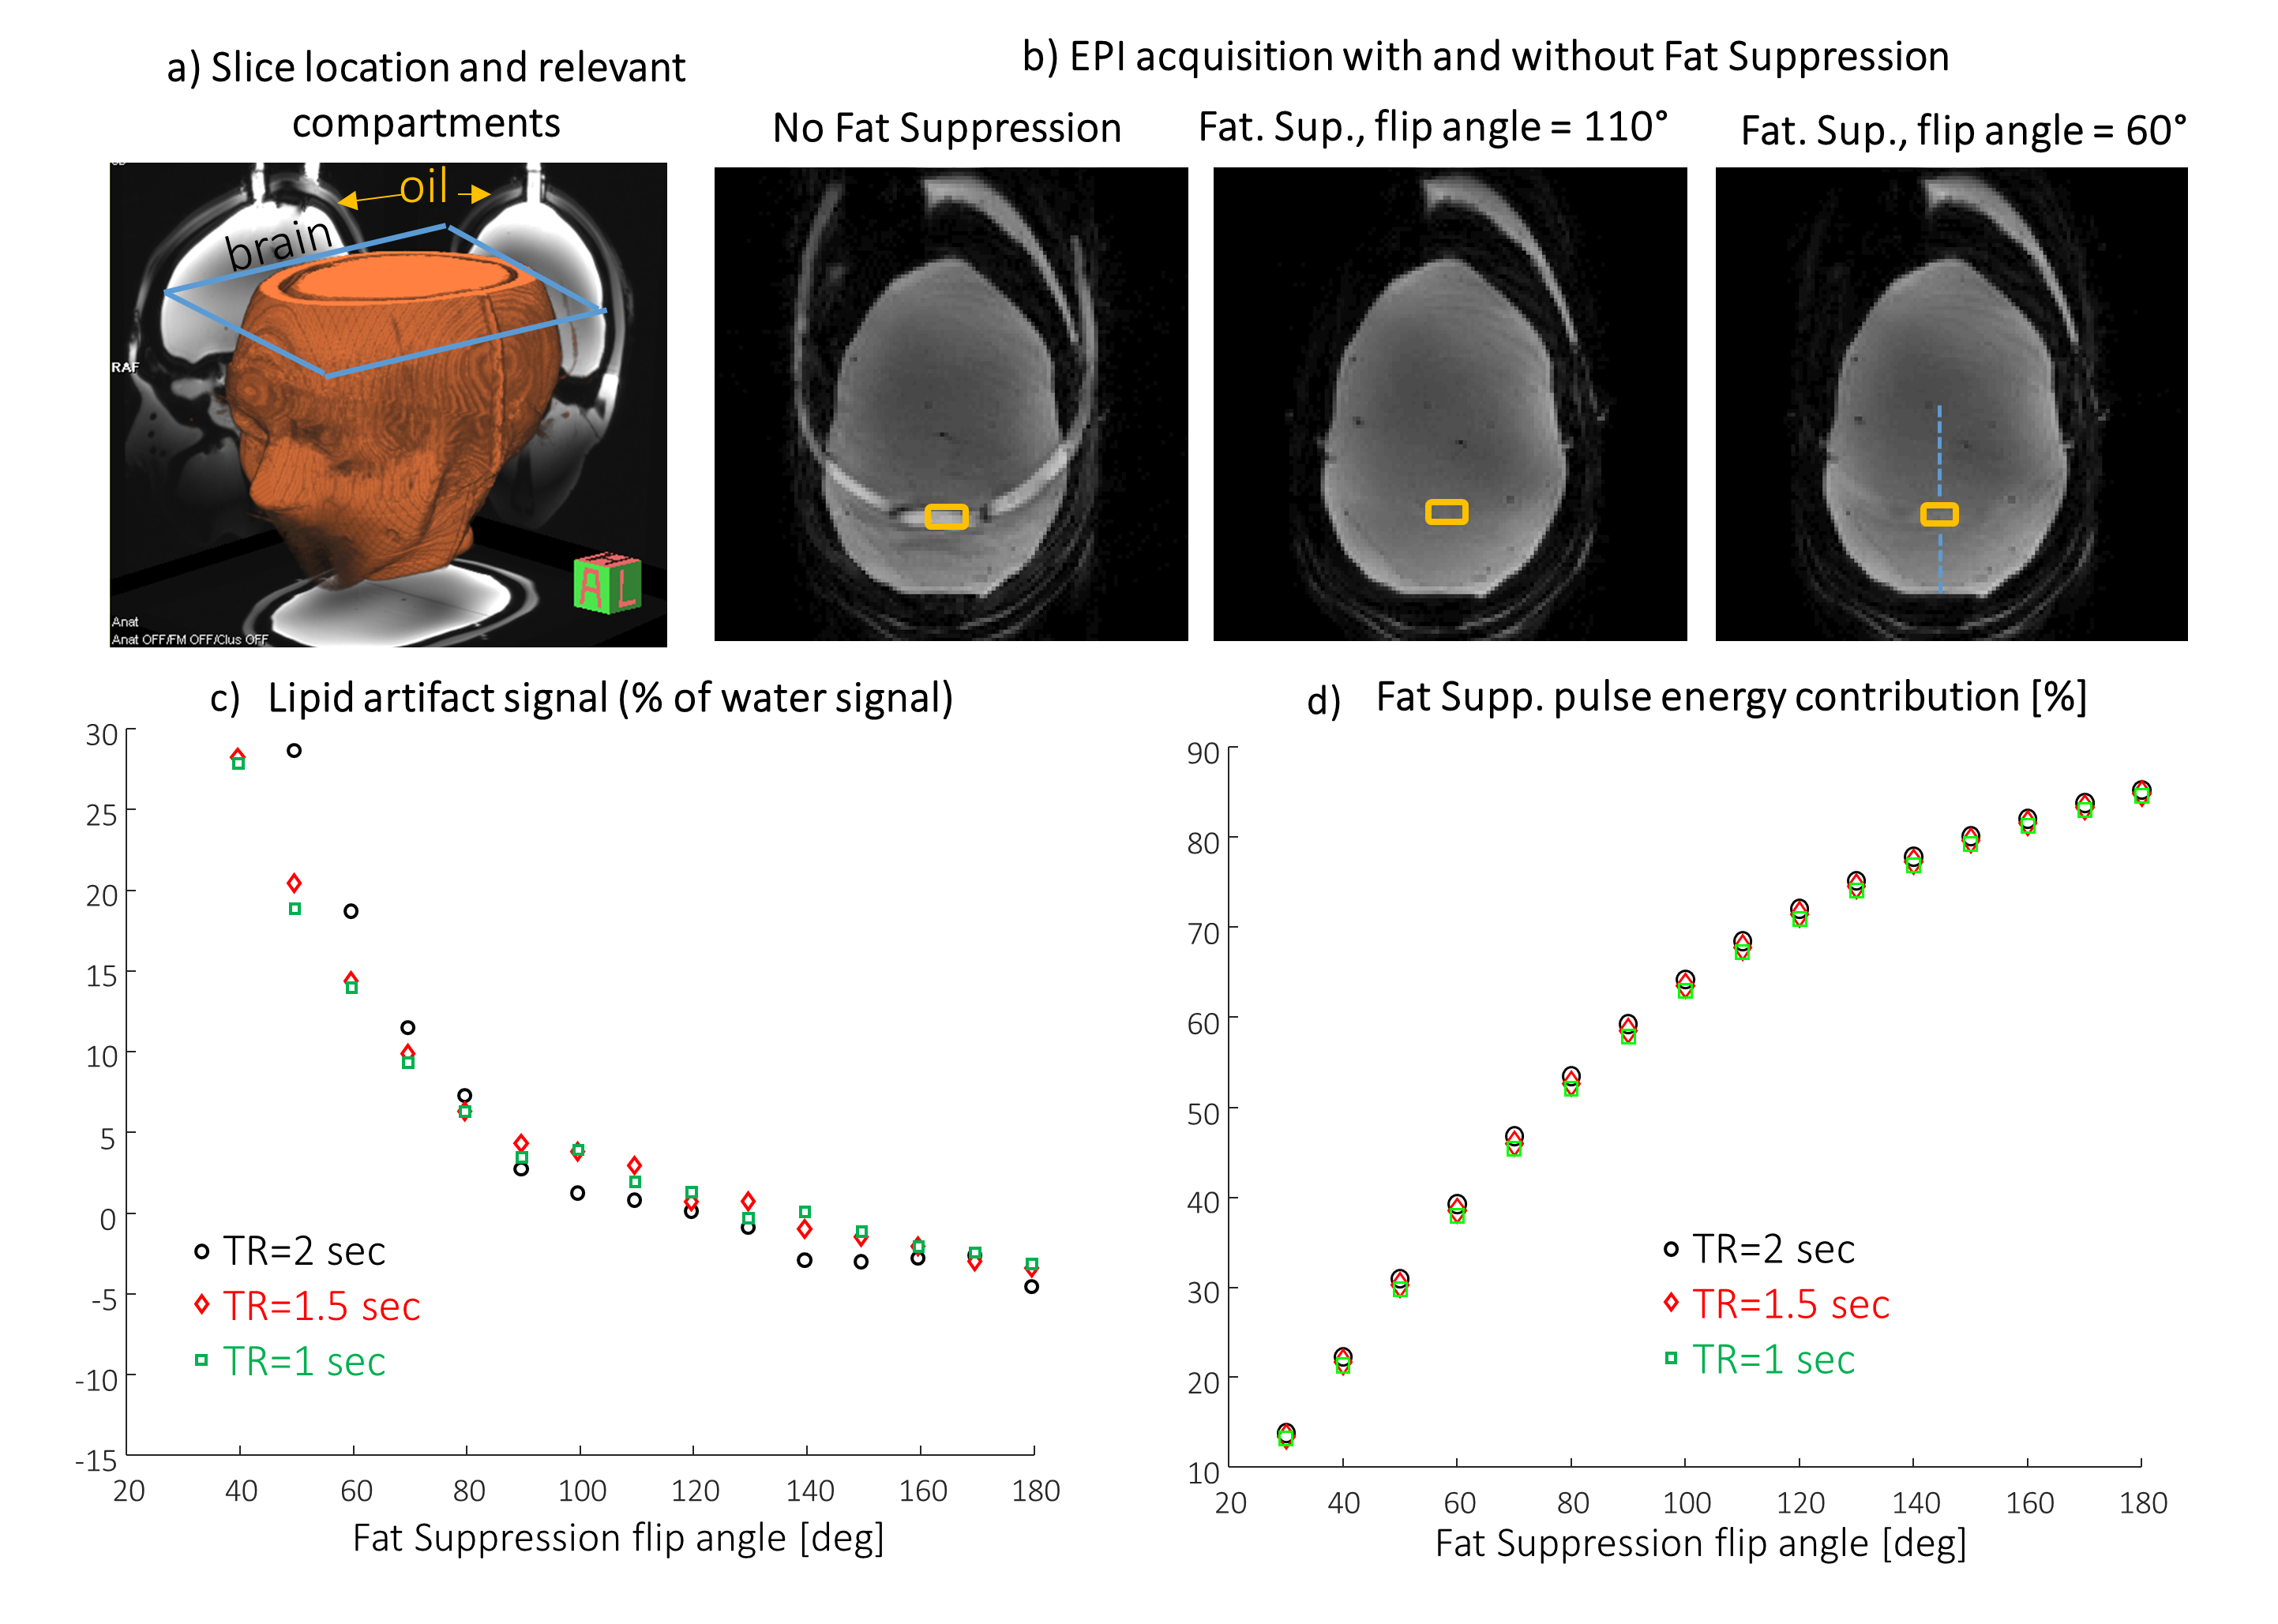
Figure 5:
Fat Suppression pulse effect analysis on EPI acquisition. a)
Slice location and relevant compartments, b) Examples of images without Fat
Sup. and with Fat Sup. applying different flip angles. c) The
lipid artifact magnitude (relative to the water signal) versus the flip angle
of the Fat Sup. pulse. d) Fat Sup. pulse energy contribution from total energy of the sequence versus the flip angle of the Fat. Sup. pulse. In order to estimate the water signal in the region of the lipid, the water
signal on the line shown in b) was interpolated to the location of the lipid
artifact.