3350
A magnetic susceptibility phantom with large range of negative/positive values for quantitative validations1Radiology, Weill Cornell Medicine, New York, NY, United States
Synopsis
A magnetic susceptibility phantom with a large range of negative to positive susceptibility values relative to water is demonstrated for validating quantitative susceptibility mapping (QSM) and related quantitative MRI techniques. The phantom consists of vials with various concentrations of paramagnetic Gadolinium contrast agent (Gd) and diamagnetic calcium chloride (CaCl2) solutions. Compared to previously reported phantoms, this phantom is easy to construct and highly stable and has minimal effects of unwanted air bubbles.
Introduction
Magnetic susceptibility is an important MRI biomarker quantifiable by QSM [1] and carries information about density of tissue depositions of various metals (iron, calcium, gadolinium, etc), as well as complex organic compounds (triglycerides, myelin, collagen). Combining QSM with other MRI measurements would allow further separation of underlying dia- and para- magnetic sources [2-5]. Validation of these quantitative methods requires a reproducible and standardizable phantom containing multiple compartments of various susceptibilities. While Gd solutions allow easy construction of a range of paramagnetic values [6], it is challenging to achieve substantial diamagnetic values using calcium carbonate (CaCO3) [7,8] or collagen [9]. Furthermore, due to insolubility of calcium carbonate in water, water-based suspensions are prone to sedimentation over time. Here we report CaCl2 for overcoming these issues. CaCl2 can be easily dissolved in water, which readily provide a wide range of negative susceptibilities.Methods
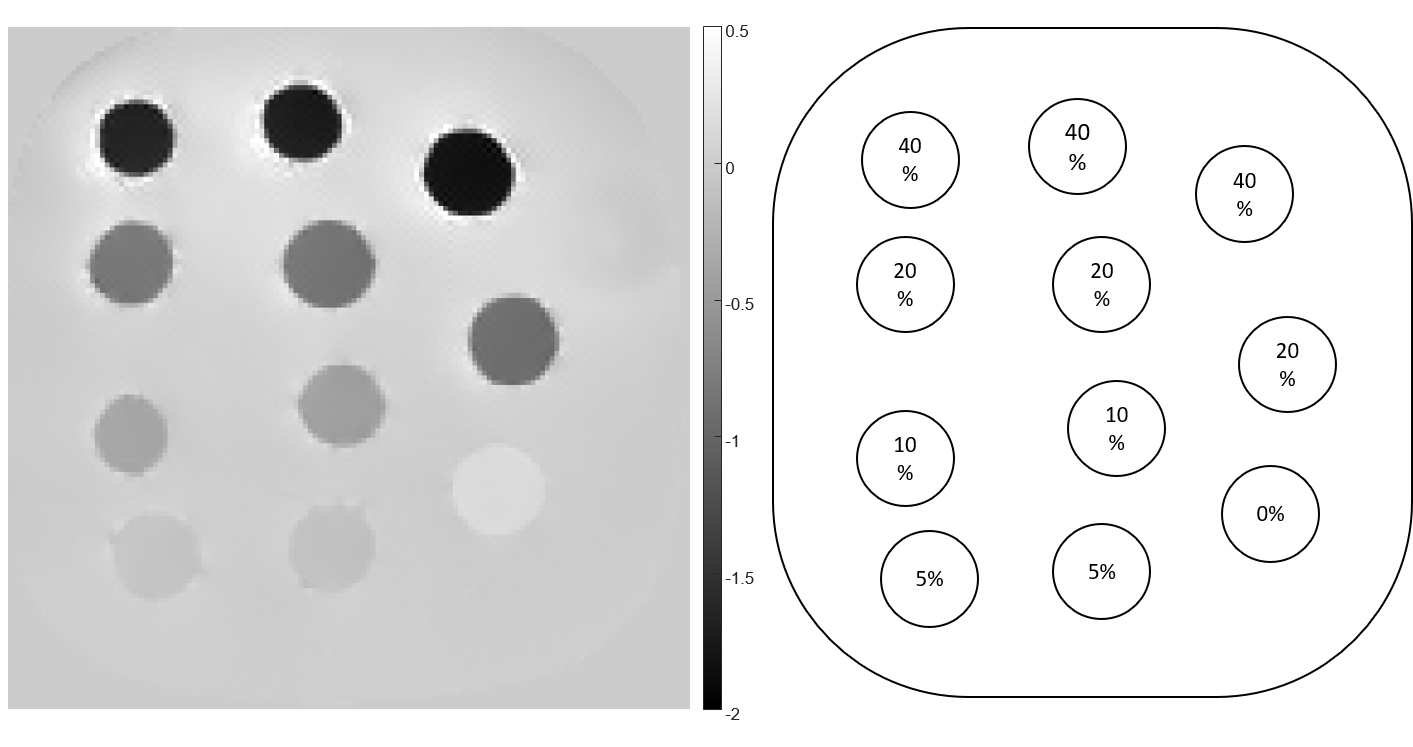
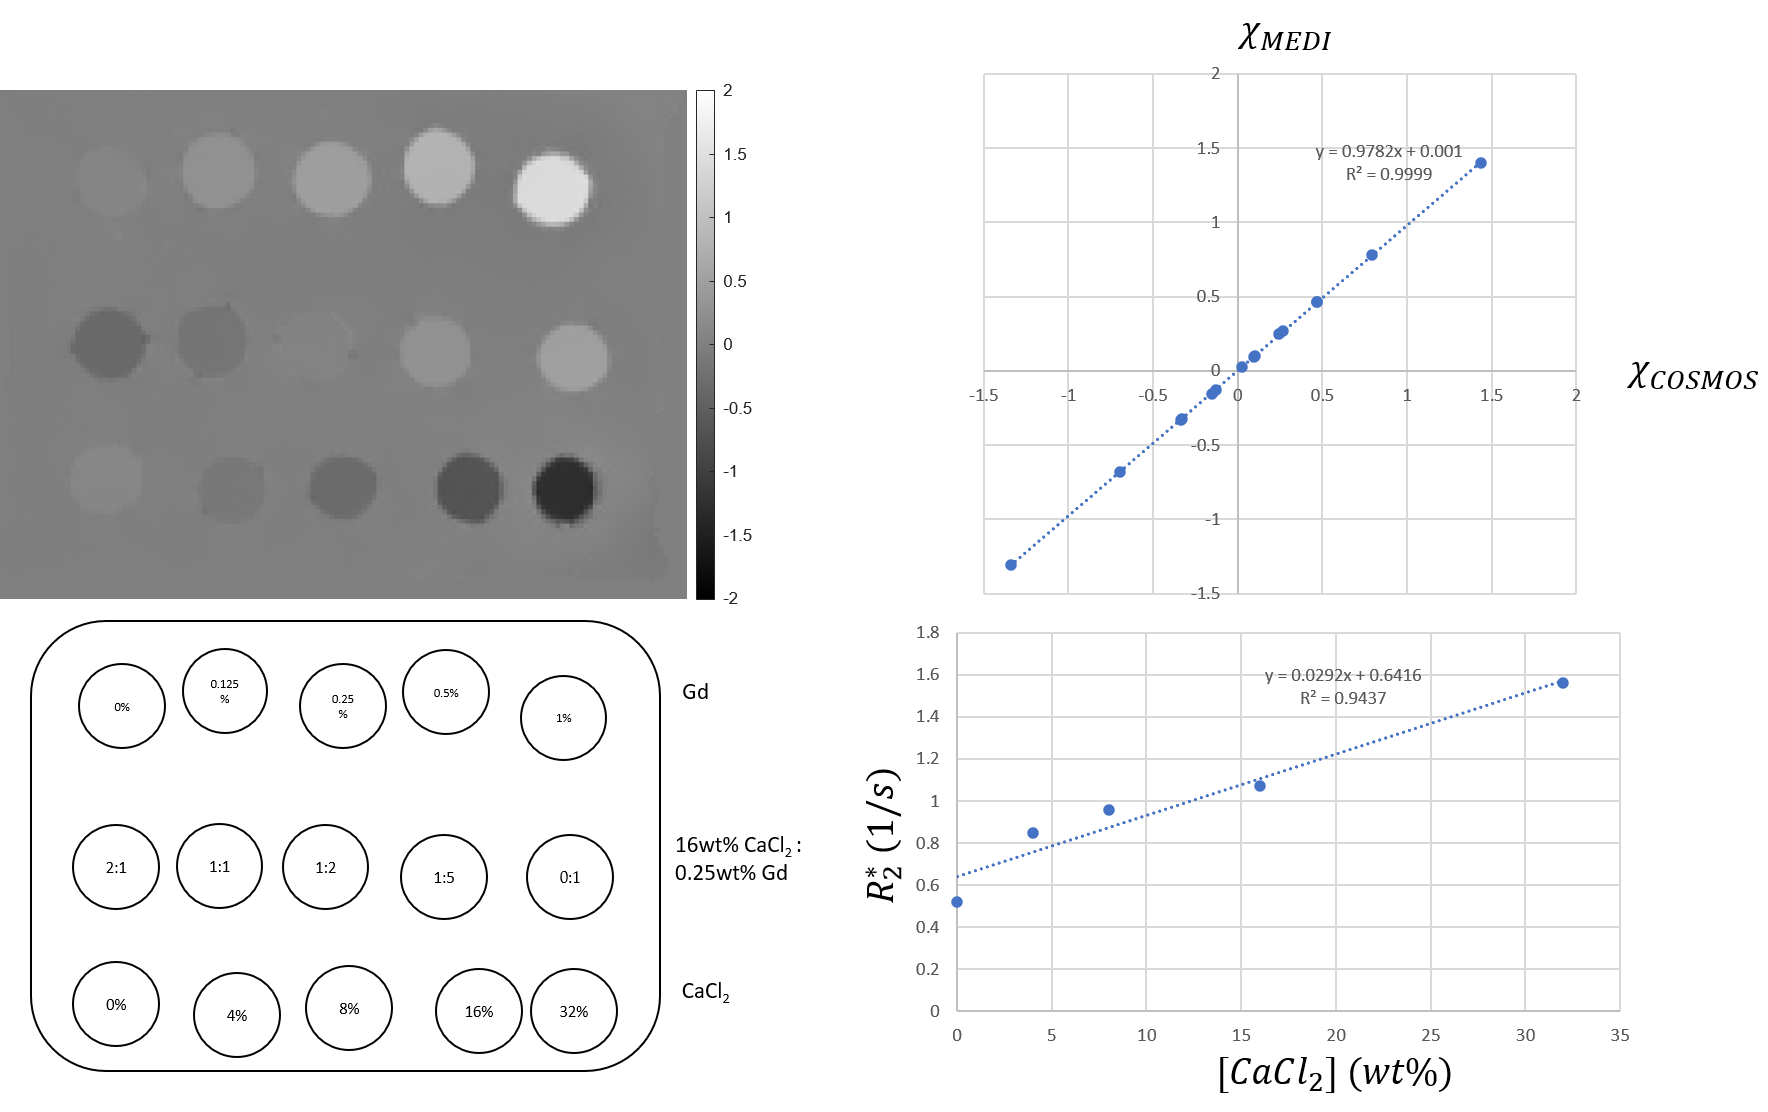
For initial characterization and reproducibility test, three 40wt% water-based solutions of CaCl2 (anhydrous, granular ≤7.0 mm, purity ≥93.0%, PubChem SID 329774838) were prepared: two using 40g of solute per 60 ml of solvent, and one using 13.3 g of solute per 20 ml of solvent. The first two preparations were used for further dilutions in which 10 ml of solution were mixed with 10, 30 and 90 ml of water; the last preparation was diluted once in proportion 1:1 with water. Thin-walled rubber balloons were filled with prepared solutions and embedded in agarose. Resultant phantom scanned on a 3T Siemens system using multi-echo GRE sequence (TR = 48msec, 10 echoes, TE1/ΔTE = 6.8/4.1 msec, voxel size 1×1×1mm3) under three different orientations separated by 60° in-plane rotation. Susceptibility maps were then reconstructed using COSMOS[10] technique. To demonstrate effects of mixing, the second phantom was built constructed using a) CaCl2 solutions (32wt%, 16wt%, 8wt% and 4wt%), b) Magnevist solutions (1wt%, 0.5wt%, 0.25wt%, and 0.125wt%), along with c) mixtures of CaCl2/Gd (16wt% CaCl2 mixed with 0.25wt% Gd in 0:1, 1:5, 1:2, 1:1 and 2:1 proportions). Susceptibility mapping using COSMOS and MEDI, as well as $$$R_2^*$$$ mapping [11] was performed.Results
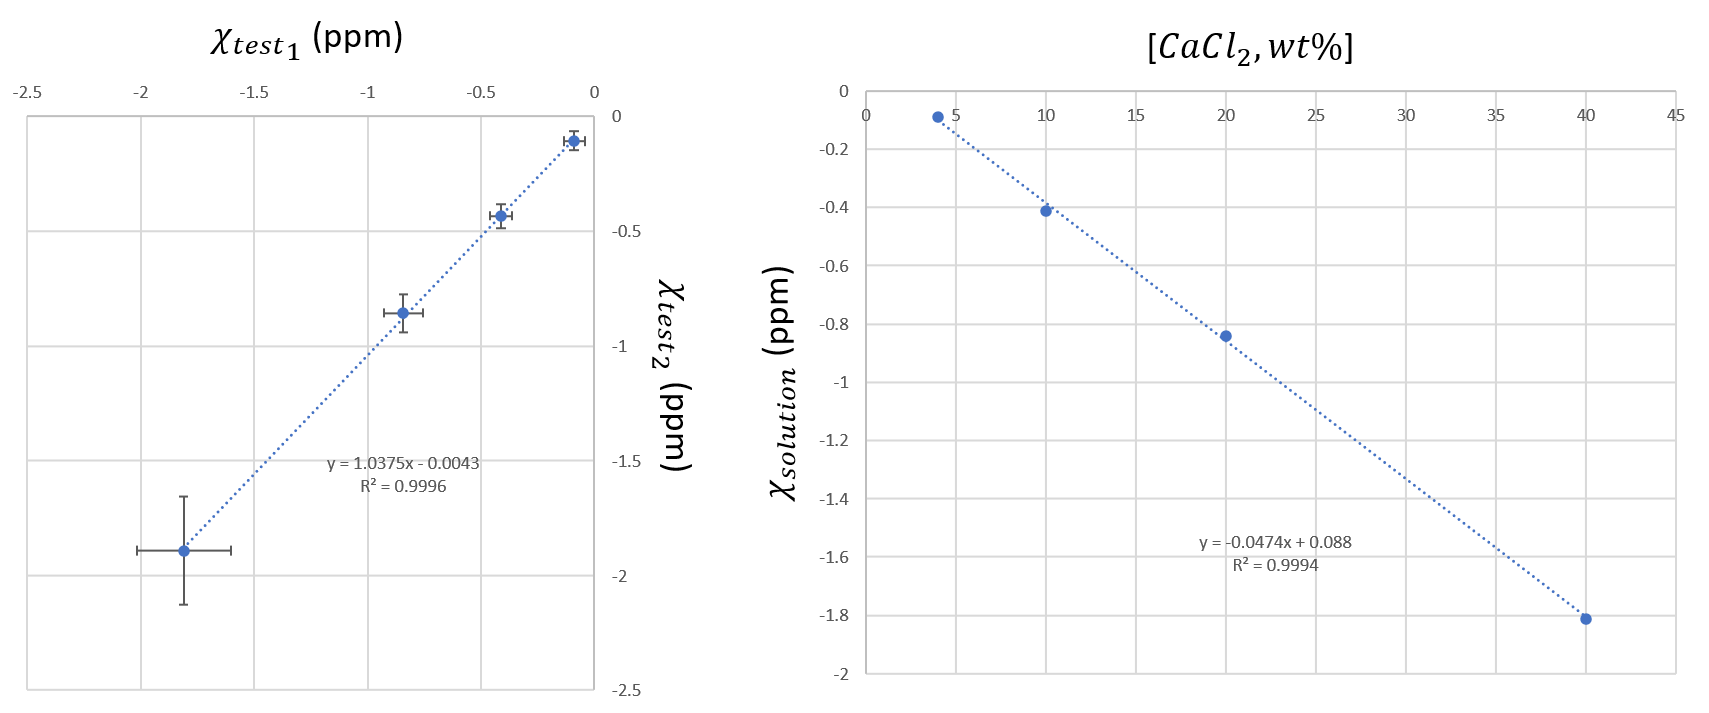
Structure and reconstructed susceptibility map of the first phantom is shown in Fig 1. It was found that relative to tap water, 40wt% solution of CaCl2 in has susceptibility of -2 ppm relative to water . Fig 2. shows linear regression of susceptibilities between two dilution series, demonstrating excellent reproducibility. COSMOS susceptibility map of the second phantom is shown in Fig 3. The phantom demonstrated good agreement between the MEDI and COSMOS estimations of susceptibilities of the prepared solutions. Cancellation of positive and negative susceptibilities as predicted by Wiedemann’s law was also observed. There was a significant correlation between CaCl2 solution concentration and measured apparent $$$R_2^*$$$.Discussion
We have demonstrated fabrication of a QSM phantom with a wide range of positive and negative magnetic susceptibilities for possible use as in calibration and validation of susceptibility imaging and separation of magnetic sources. Compared to traditionally used CaCO3, CaCl2 is highly soluble in water, allowing for very homogeneous distribution of magnetic susceptibility within a volume of interest and minimization of inclusion of unwanted air bubbles.Conclusion
The proposed method of phantom preparation allows repeatable production of susceptibility inclusions with controlled properties, which can be useful for experimental validation of MR phase imaging and quantitative susceptibility mapping.Acknowledgements
Grant #S10OD021782References
[1.] de Rochefort L, Liu T, Kressler B, et al. Quantitative susceptibility map reconstruction from MR phase data using bayesian regularization: validation and application to brain imaging. Magn Reson Med. 2010;63(1):194-206.
[2.] Stuber C, Morawski M, Schafer A, et al. Myelin and iron concentration in the human brain: a quantitative study of MRI contrast. Neuroimage. 2014;93 Pt 1:95-106.
[3.] Marques JP, Khabipova D, Gruetter R. Studying cyto and myeloarchitecture of the human cortex at ultra-high field with quantitative imaging: R1, R2(*) and magnetic susceptibility. Neuroimage. 2017;147:152-163.
[4.] Zhang Y, Gauthier SA, Gupta A, et al. Quantitative Susceptibility Mapping and R2* Measured Changes during White Matter Lesion Development in Multiple Sclerosis: Myelin Breakdown, Myelin Debris Degradation and Removal, and Iron Accumulation. AJNR Am J Neuroradiol. 2016;37(9):1629-1635.
[5.] Lee J, Nam Y, Choi JY, Shin H, Hwang T, Lee J. Separating positive and negative susceptibility sources in QSM. Paper presented at: Annual Meeting of ISMRM2017; Hawaii, USA.
[6.] Elkin R, Nadeem S, LoCastro E, et al. Optimal mass transport kinetic modeling for head and neck DCE-MRI: Initial analysis. Magn Reson Med. 2019;82(6):2314-2325.
[7.] Shin H-G, Lee J, Yun YH, et al. In-vivo histology of iron and myelin in the brain using magnetic susceptibility source separation in MRI. In: bioRxiv; 2020.
[8.] Oshima S, Fushimi Y, Okada T, et al. Brain MRI with Quantitative Susceptibility Mapping: Relationship to CT Attenuation Values. Radiology. 2020;294(3):600-609.
[9.] Li J, Lin H, Liu T, et al. Quantitative susceptibility mapping (QSM) minimizes interference from cellular pathology in R2* estimation of liver iron concentration. J Magn Reson Imaging. 2018;48(4):1069-1079.
[10.] Liu T, Spincemaille P, de Rochefort L, Kressler B, Wang Y. Calculation of susceptibility through multiple orientation sampling (COSMOS): a method for conditioning the inverse problem from measured magnetic field map to susceptibility source image in MRI. Magn Reson Med. 2009;61(1):196-204.
[11.] Pei M, Nguyen TD, Thimmappa ND, et al. Algorithm for fast monoexponential fitting based on Auto-Regression on Linear Operations (ARLO) of data. Magn Reson Med. 2015;73(2):843-850.
Figures