3349
Specialized Computational Methods for Denoising, B1 Correction, and Kinetic Modeling in Hyperpolarized 13C MR EPSI Studies of Liver Tumors
Philip Meng-en Lee1, Hsin-Yu Chen1, Jeremy W Gordon1, Zihan Zhu1, Peder EZ Larson1, Nicholas Dwork1, Mark Van Criekinge1, Lucas Carvajal1, Michael A Ohliger1, Zhen J Wang1, Duan Xu1, John Kurhanewicz1, Robert A Bok1, Rahul Aggarwal2, Pamela N Munster2, and Daniel B Vigneron1
1Department of Radiology & Biomedical Imaging, University of California, San Francisco, San Francisco, CA, United States, 2Department of Medicine, University of California, San Francisco, San Francisco, CA, United States
1Department of Radiology & Biomedical Imaging, University of California, San Francisco, San Francisco, CA, United States, 2Department of Medicine, University of California, San Francisco, San Francisco, CA, United States
Synopsis
The inhomogeneous B1 excitation profile of 13C surface transmit/receive coils provides high SNR near the surface, but results in a spatially-varying B1+. For accurately quantifying the pyruvate to lactate conversion rate (kPL), the flip angle needs to be corrected based on the B1 excitation profile. Simultaneously, random noise in hyperpolarized spectral data obscures peaks of downstream metabolites. In this work, we developed and tested a specialized computational pipeline incorporating denoising and a B1 excitation field correction method that improved quantitative kinetic rate analyses of hyperpolarized 13C MRSI scans of liver tumor patients acquired with a T/R 13C surface coil.
Introduction
Hyperpolarized (HP) 13C MR spectroscopic imaging enables quantitative imaging of enzyme-catalyzed metabolism in humans. Subsequent analysis and modeling can quantify enzymatic conversion rates in key metabolic pathways, most notably pyruvate-to-lactate conversion through lactate dehydrogenase. The measured rate constant kPL is a potential biomarker that has been shown to reflect treatment response in humans.1,2 However, low signal-to-noise ratio (SNR) in HP spectra can obscure the peaks of downstream metabolites, limiting the achievable spatial resolution and reducing the accuracy of kPL estimations. Though surface transmit/receive (T/R) coils can improve SNR, they produce an inhomogeneous transmit (B1+) profile, resulting in spatially varying flip angles that could bias quantification.3,4 The goal of this project was to develop a novel post-processing pipeline to improve spectral SNR using tensor rank truncation denoising and to correct kPL images for B1+ variations in patient liver tumor studies.Methods
Seven HP 13C MR exams, summarized in Table 1, were conducted on a clinical 3 T MRI with a custom figure-8 surface coil for 13C transmit and receive. Vitamin E capsules, embedded within the coil, facilitated coil positioning (Figure 1A). A 13C-enriched urea phantom was used for RF power calibration. Vitamin E capsules and urea phantom, highlighted by yellow dots, were used during the initial B1+ map acquisition and subsequent transformation (Figure 1B). This B1+ map was previously acquired from a phantom using the double angle method.5,6 Figure 1C-D show the coil-placement for a patient scan with the 13C coil and 32-channel 1H torso array. [1-13C]pyruvate and [1-13C]lactate signals were acquired with an echoplanar spectroscopic imaging (EPSI) sequence over 1 minute with a temporal resolution of 3 s and a voxel size of 1.2×1.2×1.2-3.0 cm, and nominal flip angles of 10°, 20°, and 15° for pyruvate, lactate, and alanine, respectively, were applied.The EPSI analysis pipeline consisted of a B0 inhomogeneity correction,7 a tensor rank truncation for denoising,8,9 and zero- and first-order phase corrections. In an HP tensor, the spectral, spatial, and temporal dynamics are inherently low-rank, allowing for most ranks to be truncated and preserving selected principal components. The number of ranks preserved in each dimension was optimized using a bias-variance tradeoff algorithm.9 Finally, using the fiducial markers, the previously acquired B1+ map was transformed to its orientation during the patient scan, registering each 13C voxel with a B1+ scaling factor used to scale the nominal flip angle. The corrected flip angle was subsequently provided as an input into an inputless single-compartment two-site exchange model to estimate kPL.3
Results
On average, apparent pyruvate SNR increased by 37.4-fold, lactate SNR increased by 34.0-fold, and alanine SNR increased by 20.1-fold. Figure 2 shows representative spectral data before and after denoising for two selected voxels from a patient with metastatic pancreatic cancer to the liver (Scan #5). Prior to denoising, the low SNR alanine peak was obscured . After denoising, both the lactate and alanine peaks were clearly resolved spectrally and temporally with SNR increases of 26.2 and 28.9-fold, respectively. The lactate dynamic profile was likewise recovered and greatly improved with the denoising pipeline.Using the fiducial markers, the previously acquired B1+ map was transformed to its orientation during the patient scan, resulting in a registered B1+ map where each 13C voxel corresponded with a B1+ scaling factor used to scale the nominal flip angle. The corrected flip angle was subsequently provided as an input into an inputless single-compartment two-site exchange model3 to estimate kPL.
Representative B1+ correction data are shown in Figure 3 (Scan #3). Figure 3A shows an axial T1-weighted spoiled gradient-echo anatomical scan with arrows highlighting large tumors. Two tumor voxels were selected, labeled Tumor #1 and #2. Figure 3B shows the previously acquired B1+ map aligned using the coil’s fiducial markers, highlighted in yellow. Figure 3C-D depict the kPL values for voxel Tumor #1 before and after B1+ correction, respectively. Before B1+ correction, the estimated kPL for this voxel was 0.053 s-1. After B1+ correction, the estimated kPL was 0.064 s-1. This voxel was over-flipped by 13% resulting in a -17.26% underestimation of kPL without B1+ correction. Figure 3E-F depict the kPL values for voxel Tumor #2 before and after B1+ correction, respectively. Before B1+ correction, the estimated kPL for this voxel was 0.083 s-1. After B1+ correction, the estimated kPL was 0.069 s-1. This voxel was under-flipped by 13% resulting in a 20.00% overestimation of kPL without B1+ correction. These voxels corresponded with the Monte Carlo simulations in that over-flipping resulted in an underestimation of kPL and under-flipping resulted in an overestimation of kPL (Figure 4). Figure 4A shows the simulated pyruvate and lactate signals and Figure 4B shows the inverse relationship between the relative B1+ error and the fractional kPL error.
Discussion and Conclusions
A specialized HP 13C EPSI post-processing pipeline was developed that integrated tensor denoising and B1+ correction to improve the quantitative accuracy of surface coil HP 13C metabolic MR in cancer patients. With tensor denoising, low signal metabolites were extracted for improved subsequent kinetic modeling of kPL in the tumors and adjacent regions. This approach could benefit future clinical trials using HP 13C MRSI to measure cancer metabolism and response to targeted drug therapies.Acknowledgements
This work was supported by NIH grants R01CA183071, U01EB026412, R01DK115987, and P41EB013598.References
- Aggarwal R, Vigneron DB, Kurhanewicz J. Hyperpolarized 1-[13C]-Pyruvate Magnetic Resonance Imaging Detects an Early Metabolic Response to Androgen Ablation Therapy in Prostate Cancer. Eur Urol. 2017;72(6):1028-1029. doi:10.1016/j.eururo.2017.07.022
- Chen HY, Aggarwal R, Bok RA, et al. Hyperpolarized 13C-pyruvate MRI detects real-time metabolic flux in prostate cancer metastases to bone and liver: a clinical feasibility study. Prostate Cancer Prostatic Dis. 2020;23(2):269-276. doi:10.1038/s41391-019-0180-z
- Larson PEZ, Chen HY, Gordon JW, et al. Investigation of analysis methods for hyperpolarized 13C-pyruvate metabolic MRI in prostate cancer patients. NMR Biomed. 2018;31(11):e3997. doi:10.1002/nbm.3997
- Walker CM, Fuentes D, Larson PEZ, Kundra V, Vigneron DB, Bankson JA. Effects of excitation angle strategy on quantitative analysis of hyperpolarized pyruvate. Magn Reson Med. 2019;81(6):3754-3762. doi:10.1002/mrm.27687
- Stollberger R, Wach P, G M, E J, Ebner F. RF-filed mapping in vivo. In: Proceedings of the 7th Annual Meeting of SMRM, San Francisco, CA, USA. ; 1988:106.
- Insko E, Bolinger L. B1 Mapping. In: Proceedings of the 11th Annual Meeting of SMRM, Berlin, Germany. ; 1992:4302.
- Crane JC, Gordon JW, Chen HY, et al. Hyperpolarized 13C MRI data acquisition and analysis in prostate and brain at University of California, San Francisco. NMR Biomed. Published online 2020:e4280. doi:10.1002/nbm.4280
- Brender JR, Kishimoto S, Merkle H, et al. Dynamic Imaging of Glucose and Lactate Metabolism by 13 C-MRS without Hyperpolarization. Sci Rep. 2019;9:3410. doi:10.1038/s41598-019-38981-1
- Chen HY, Autry AW, Brender JR, et al. Tensor image enhancement and optimal multichannel receiver combination analyses for human hyperpolarized 13C MRSI. Magn Reson Med. 2020;84(6):3351-3365. doi:10.1002/mrm.28328
Figures
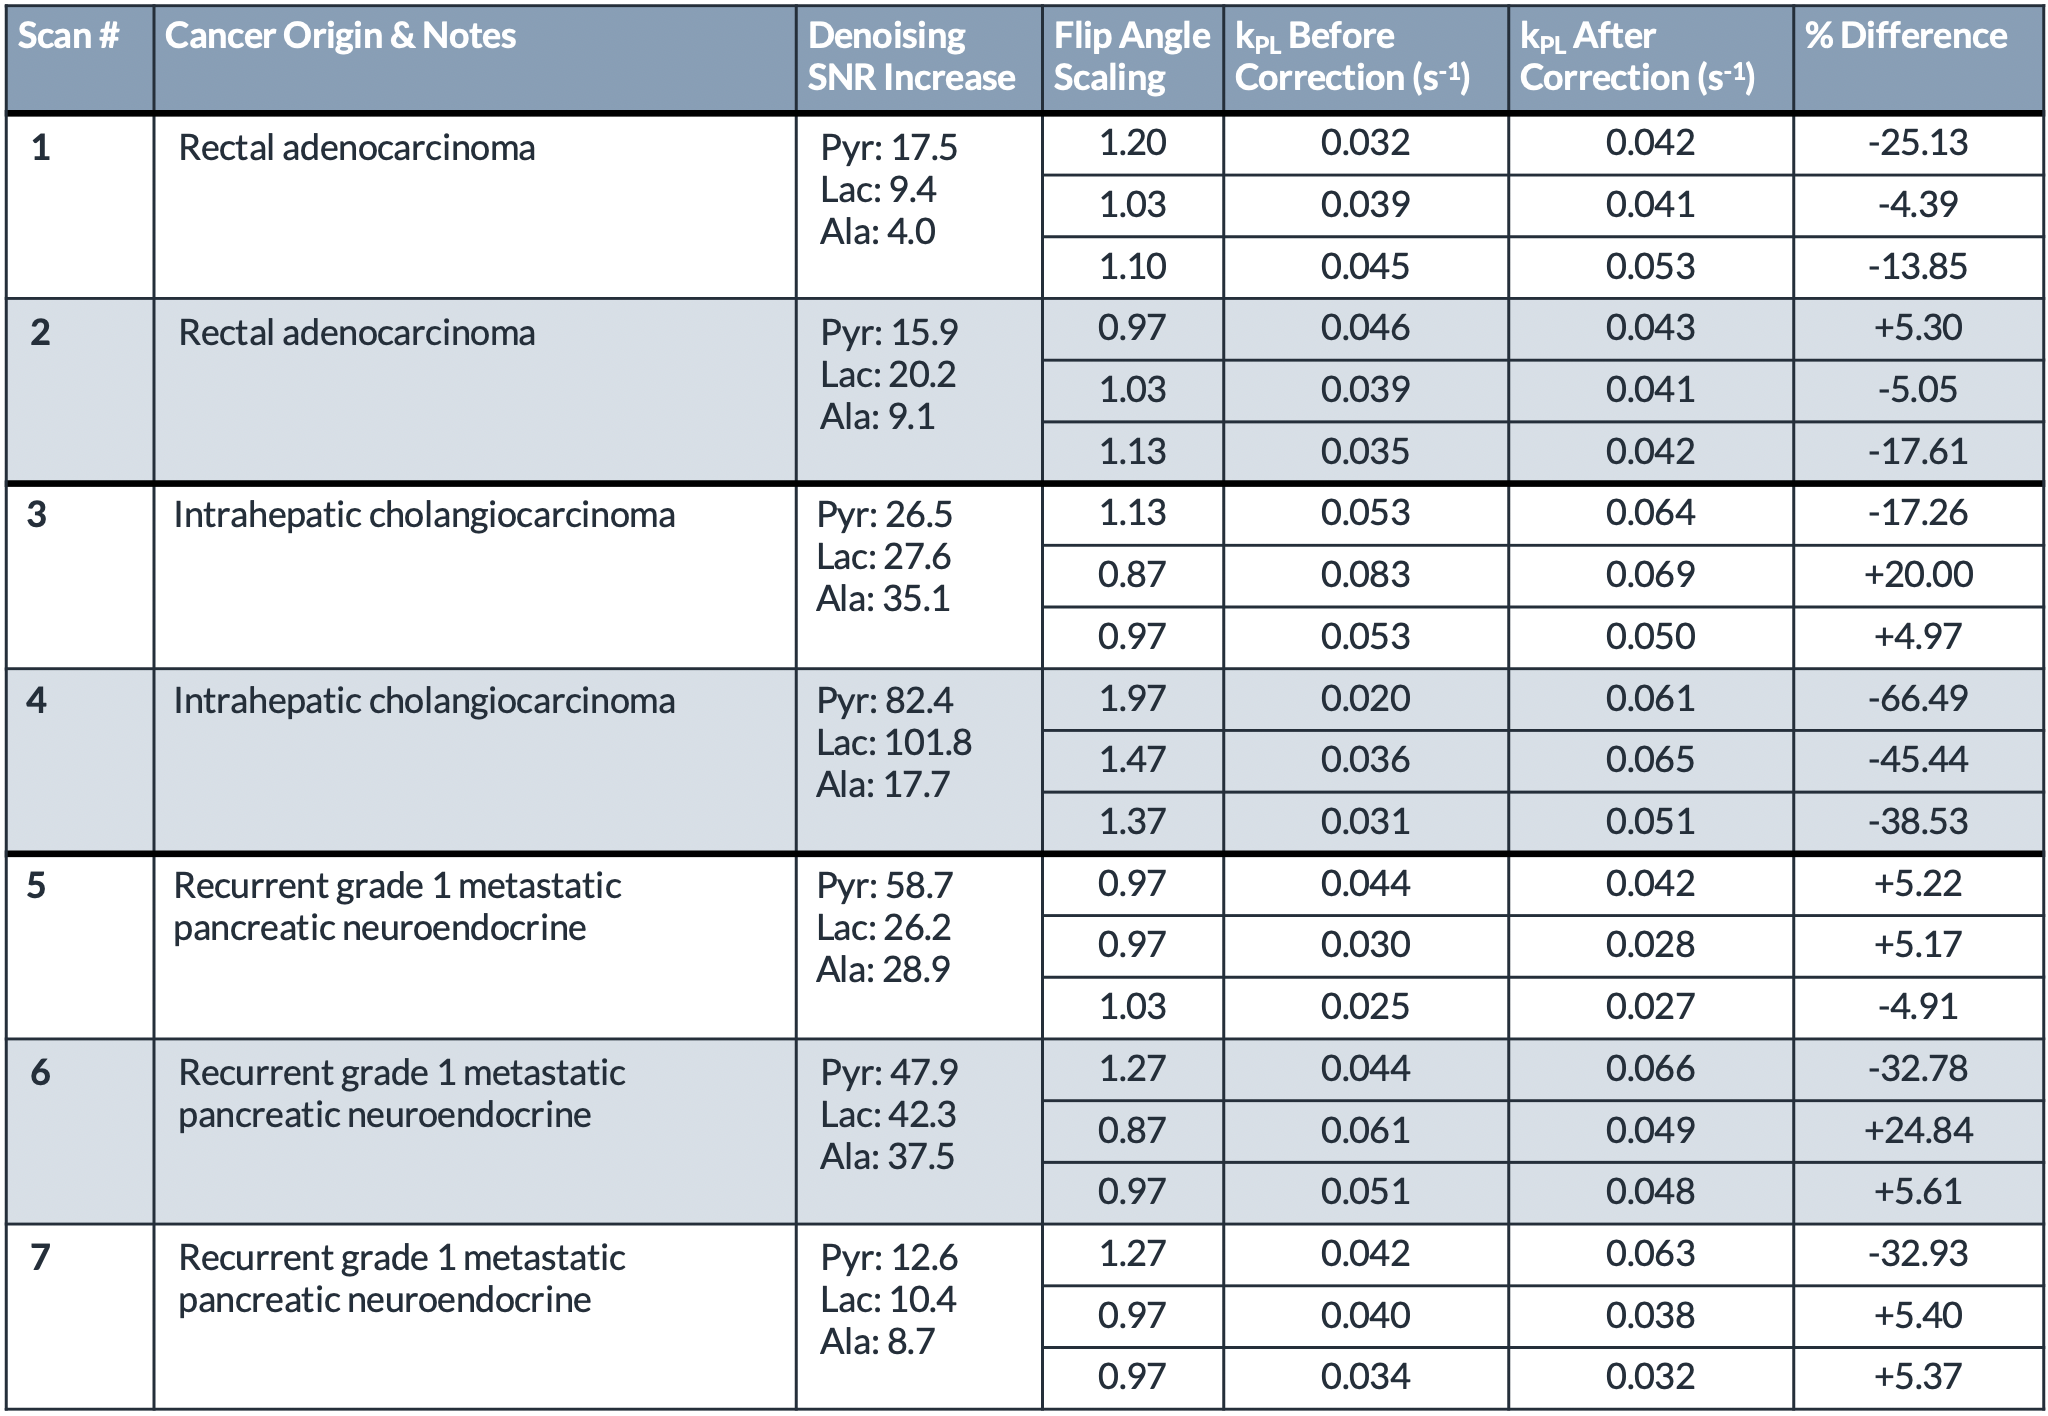
Table 1. Selected voxels from seven patient scans showing the improvements in SNR after denoising, the flip correction scaling factor (over-flipped: > 1, under-flipped: < 1), the kPL values before and after B1+ correction, and the percent difference.
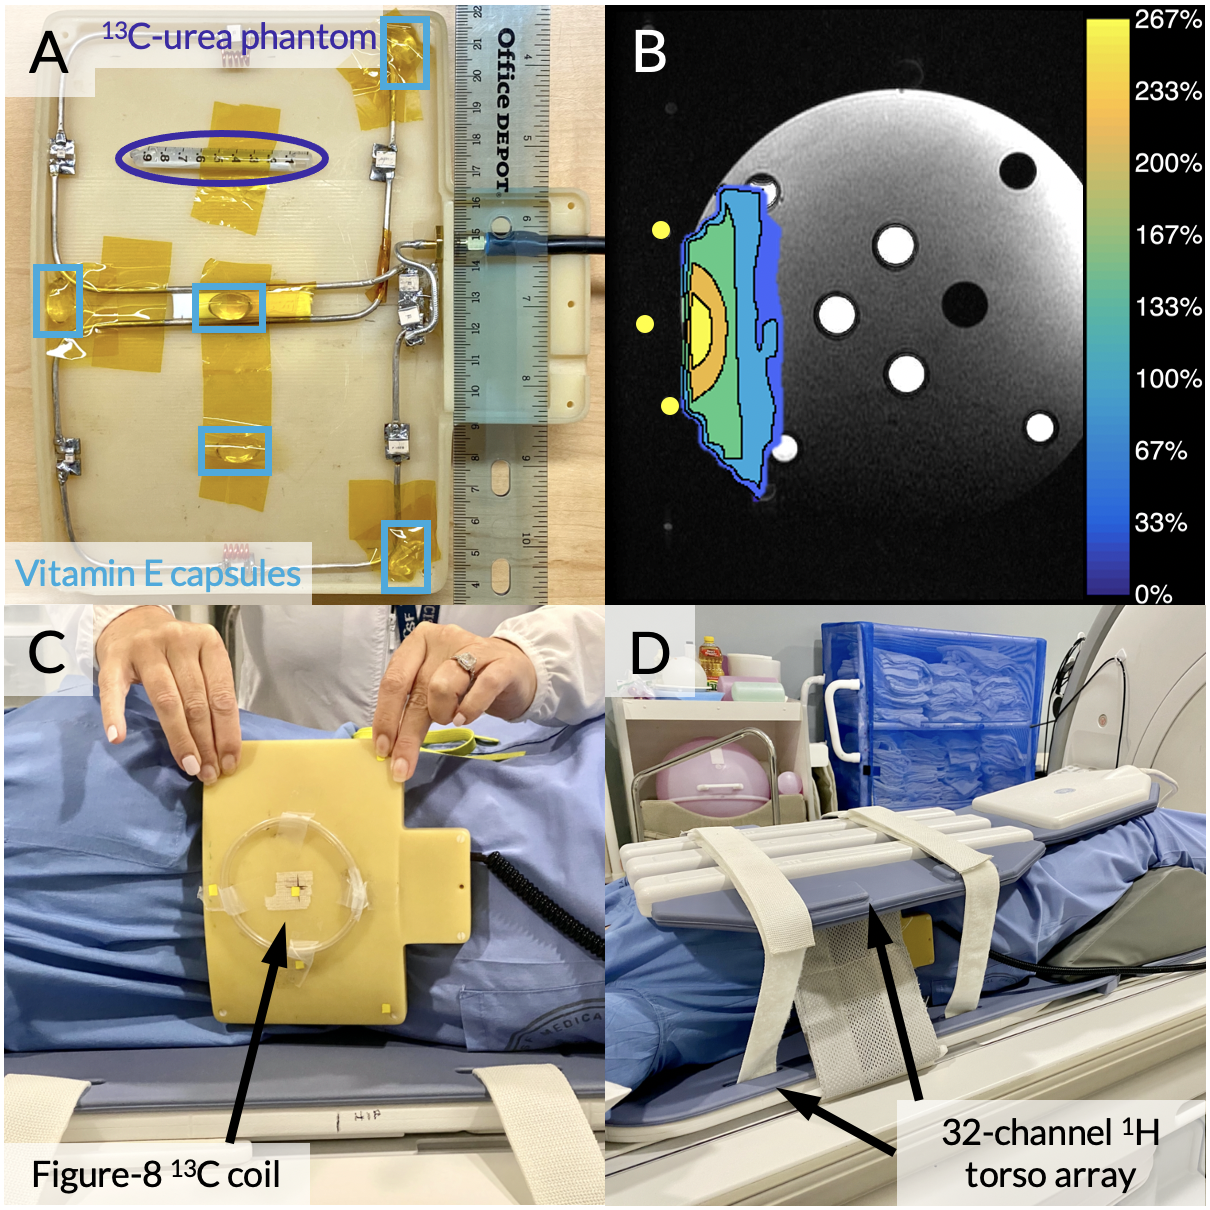
Figure 1. (A) The figure-8 T/R coil opened with a 13C-enriched urea phantom used for power calibration highlighted by a purple circle and vitamin E capsule fiducial markers highlighted by light blue rectangles. (B) The coil’s B1+ profile acquired using the double angle method. The contour map indicates the actual flip angle delivered relative to the prescribed flip angle. (C-D) Photos of an example coil-placement for a patient scan.
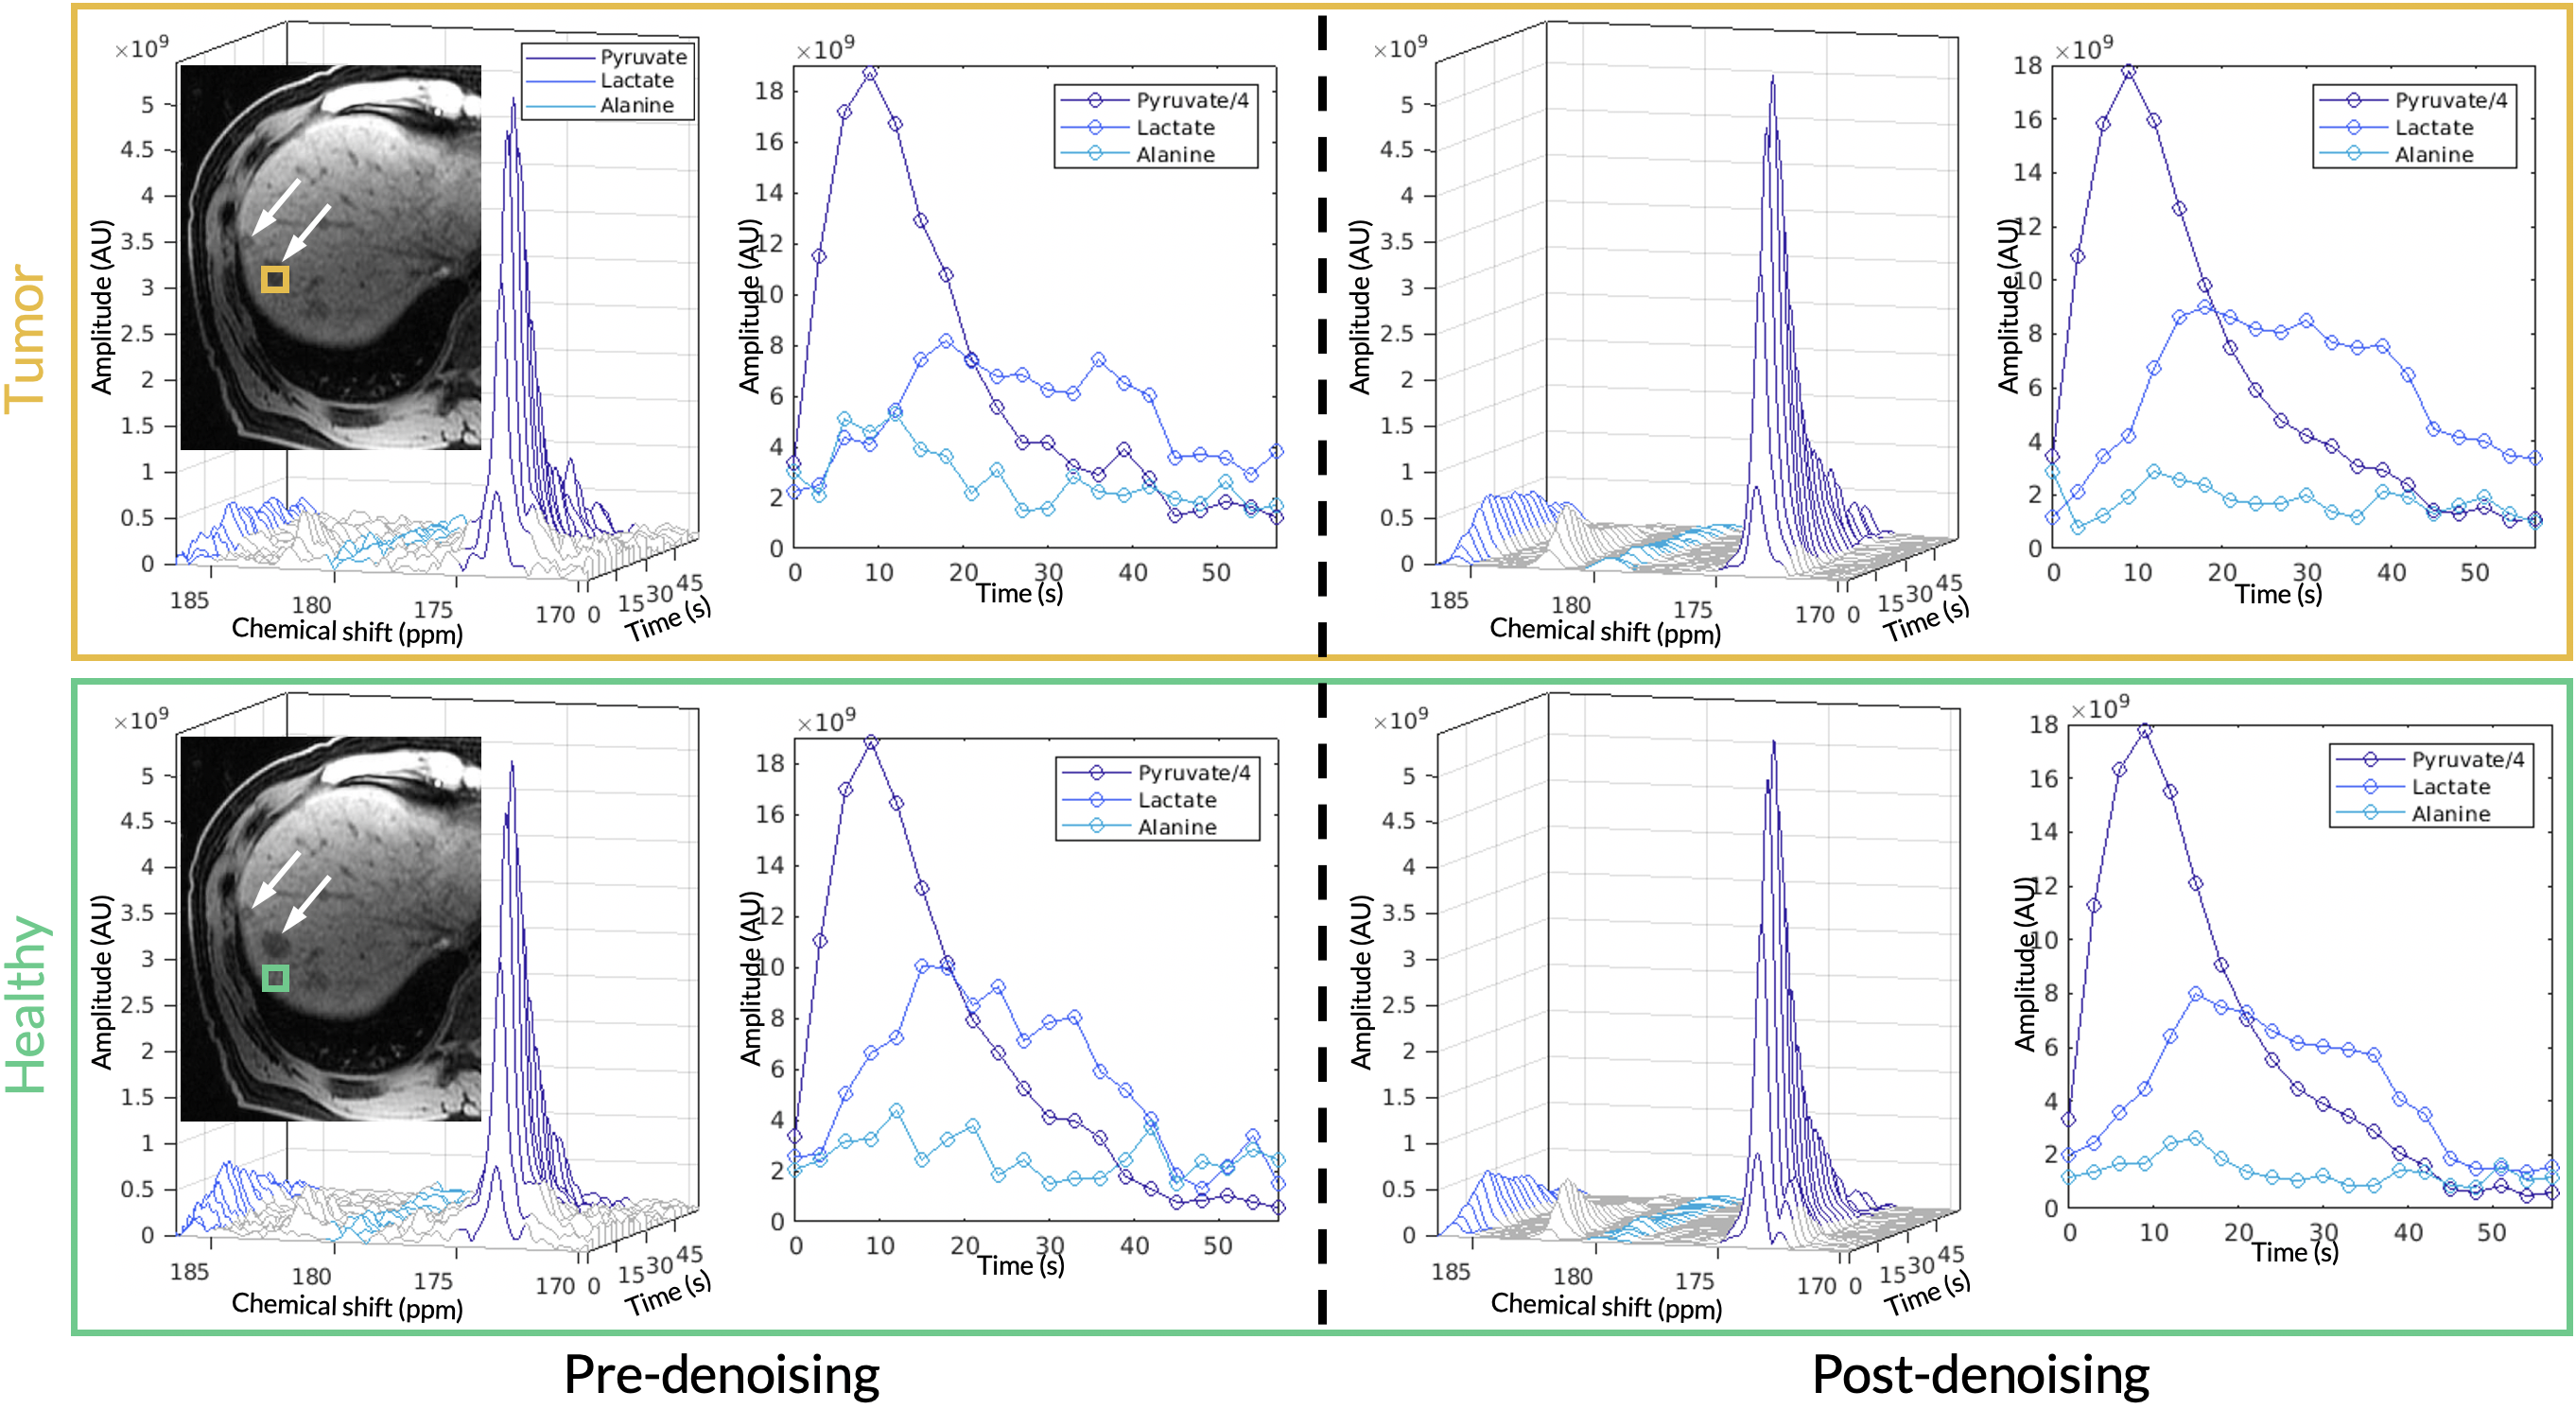
Figure 2. The top panel (orange box) shows the acquired HP 13C EPSI spectrum and dynamics before and after denoising for the tumor voxel. Likewise, the bottom panel (green box) shows the acquired EPSI spectrum and dynamics before and after denoising for a healthy-appearing voxel. The adjacent T1-weighted anatomical images highlight locations of the metastases and the selected voxel. Both are representative voxels taken from Scan #5.
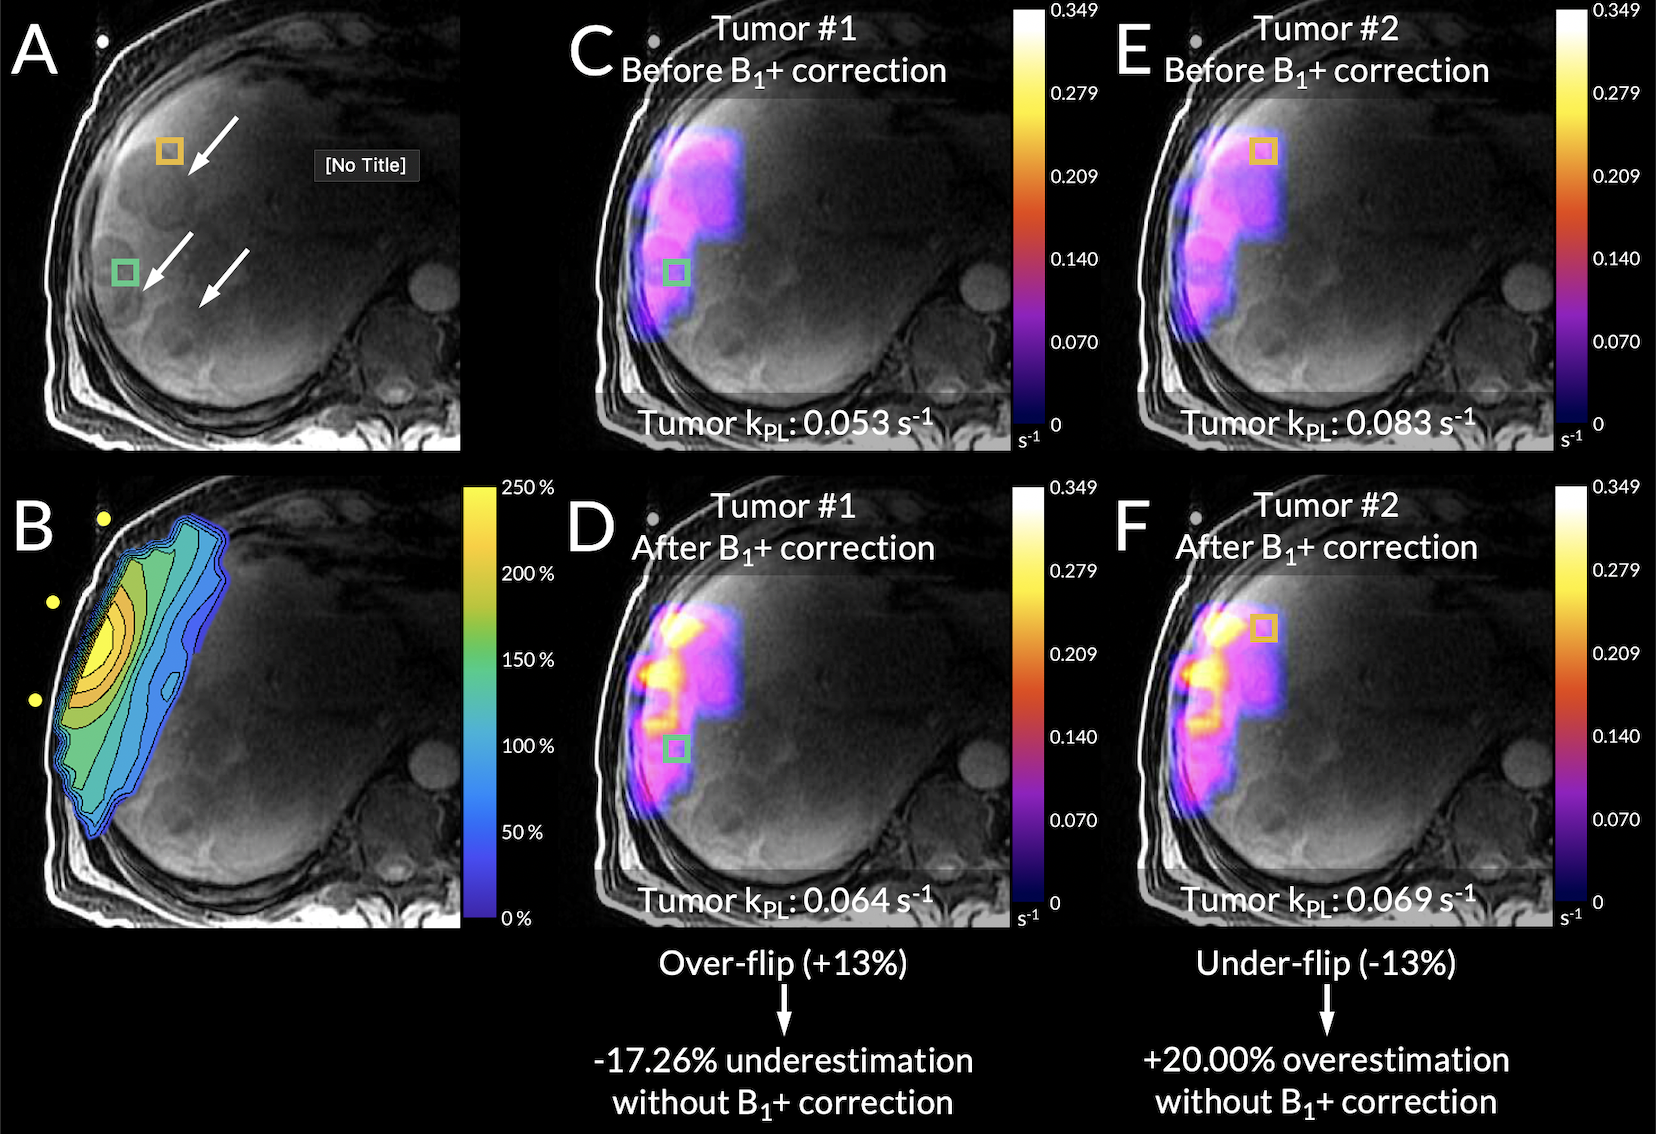
Figure 3. From Scan #3, (A) an axial T1-weighted spoiled gradient-echo anatomical scan. (B) The B1+ profile aligned to its position during the scan using the coil’s fiducial markers. (C-D) The kPL maps before and after B1+ correction with an over-flipped tumor voxel highlighted in green. (E-F) The kPL maps before and after B1+ correction with an under-flipped tumor voxel highlighted in orange.
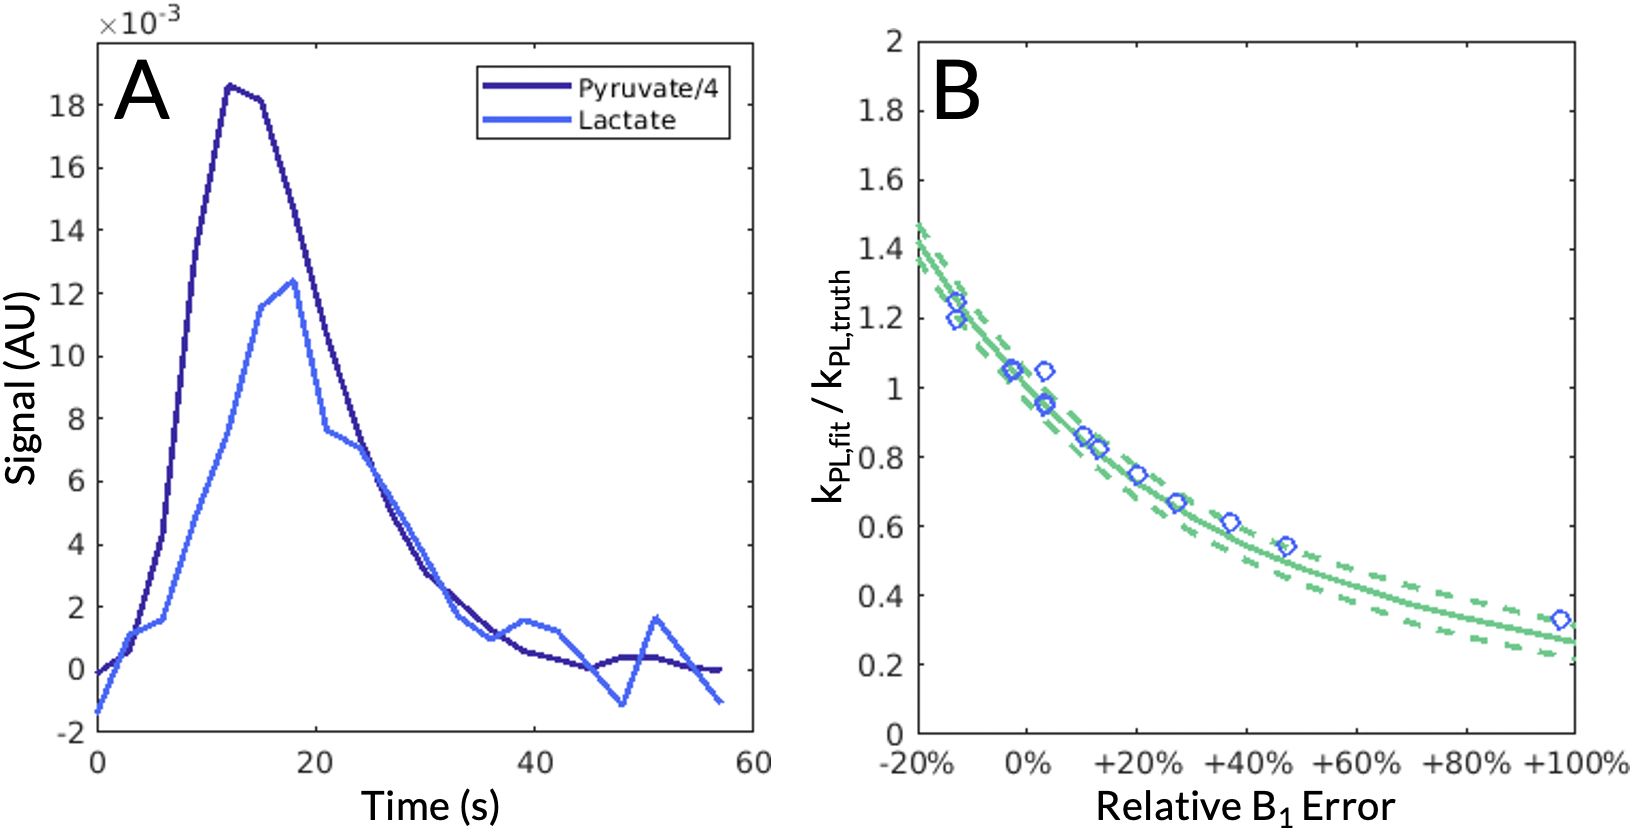
Figure 4. (A) The simulated pyruvate and lactate signals with simulation values of kPL = 0.03 s-1, pyruvate T1= 30 s, lactate T1 = 25 s, and noise standard deviation = 0.004. (B) Monte Carlo simulations of the two-site inputless model demonstrated an inverse relationship between the relative B1 error and the fractional kPL error (solid line = mean; dashed lines = 1 standard deviation): positive errors in B1+ resulted in underestimations of kPL and negative errors resulted in overestimations, agreeing with acquired data. Selected voxels presented in Table 1 are indicated by blue circles.