3326
B0 Susceptibility-Induced Geometric Image Distortion at Low-Field for Magnetic Resonance Imaging in Radiation Therapy1Siemens Healthcare GmbH, Erlangen, Germany
Synopsis
Our main purpose was to quantify geometric image distortion due to reduced susceptibility at 0.55T compared to 1.5T. Therefore, Bloch simulations of a digital phantom and a 2D GRE sequence were performed. The simulations at both field strengths were calculated twice: once without considering B0 susceptibility, and once considering B0 susceptibility artefacts. Additionally, 3D T2 SPACE images with high readout bandwidth as well as echo-planar diffusion-weighted images were obtained and compared in n=3 volunteers. Less geometric distortion due to B0 susceptibility artefacts was observed at 0.55T compared to higher field strengths.
INTRODUCTION
Effective radiation therapy relies on high geometric integrity of the MR image information used for treatment planning. Apart from gradient system non-idealities, main magnetic field inhomogeneities and patient-induced B0 susceptibility artefacts potentially lead to geometric distortion1. B0 susceptibility is field strength dependent2, and lower field strengths result in overall reduced absolute susceptibility3. The goal of this study is to analyze the effect of lower susceptibility on geometric image integrity of a conventional GRE and an echo-planar diffusion-weighted sequence by means of both digital simulations and in vivo measurements.METHODS
Simulations: Bloch simulations of a 2D GRE sequence (voxel size = 1.5x1.5x3mm3, FoV = 288x288mm3, acquisition matrix = 192x192, bandwidth = 350Hz/px) and a digital phantom4 were performed at 1.5T (TE = 3.5ms, TR = 7ms, flip angle = 20°) and 0.55T (TE = 4ms, TR = 8.9ms, flip angle = 30°). At both field strengths, two types of simulations were performed. First, an ideal system (main magnetic field, RF field, gradient fields, RX profile) is assumed, and B0 susceptibility effects are turned off (termed “Simulation ideal”). The second simulation applied similar parameters, but main magnet field inhomogeneities as provided by the manufacturer and B0 susceptibility effects are turned on (termed “Simulation B0”). The effect of B0 shimming was not simulated.In vivo Study: Three healthy volunteers (2 female, 1 male, age: 67±4 years, weight: 78±15 kg) were imaged at a 1.5T (MAGNETOM Sola, Siemens Healthcare, Erlangen, Germany) and a prototypical version of a 0.55T scanner (MAGNETOM Free.Max, Siemens Shenzhen Magnetic Resonance Ltd., Shenzhen, China). Measurements at both field strengths covering the optic nerve were performed directly one after another by means of dedicated head coils. A 3D T2 turbo-spin-echo sequence (SPACE) was used to acquire high-resolution data (voxel size = 1x1x1mm3, FoV = 268x268x176mm3, acquisition matrix = 256x256x176) at 1.5T (TE = 292ms, TR = 1900ms, echo spacing = 3.28ms, echo train duration = 758ms, acquisition time = 3min 13s) and 0.55T (TE = 412ms, TR = 3200ms, echo spacing = 4.68ms, echo train duration = 1076ms, acquisition time = 6min 38s). A high readout bandwidth of 651Hz/px was applied, to minimize image distortion due to B0 inhomogeneity. Echo-planar diffusion-weighted images were obtained at both field strengths, and Apparent Diffusion Coefficient (ADC) maps were calculated. Parameters that influence geometric distortions due to B0 inhomogeneities were matched (voxel size = 1.4x1.4x4mm3, acquisition matrix = 192x192x24, bandwidth = 766Hz/px, echo spacing = 1.53ms). Data acquisition in ky direction was accelerated two-fold using GRAPPA. The remaining imaging parameters included FoV = 268x268x119mm3, TE = 119ms, TR = 5300ms, b-value 1 = 0 s/mm2, b-value 2 = 1000 s/mm2, EPI factor = 154, and acquisition time = 2min 56s at both field strength. Additionally, quantitative B0 off-resonance field maps were calculated based on the phase differences of a 2-echo GRE sequence.
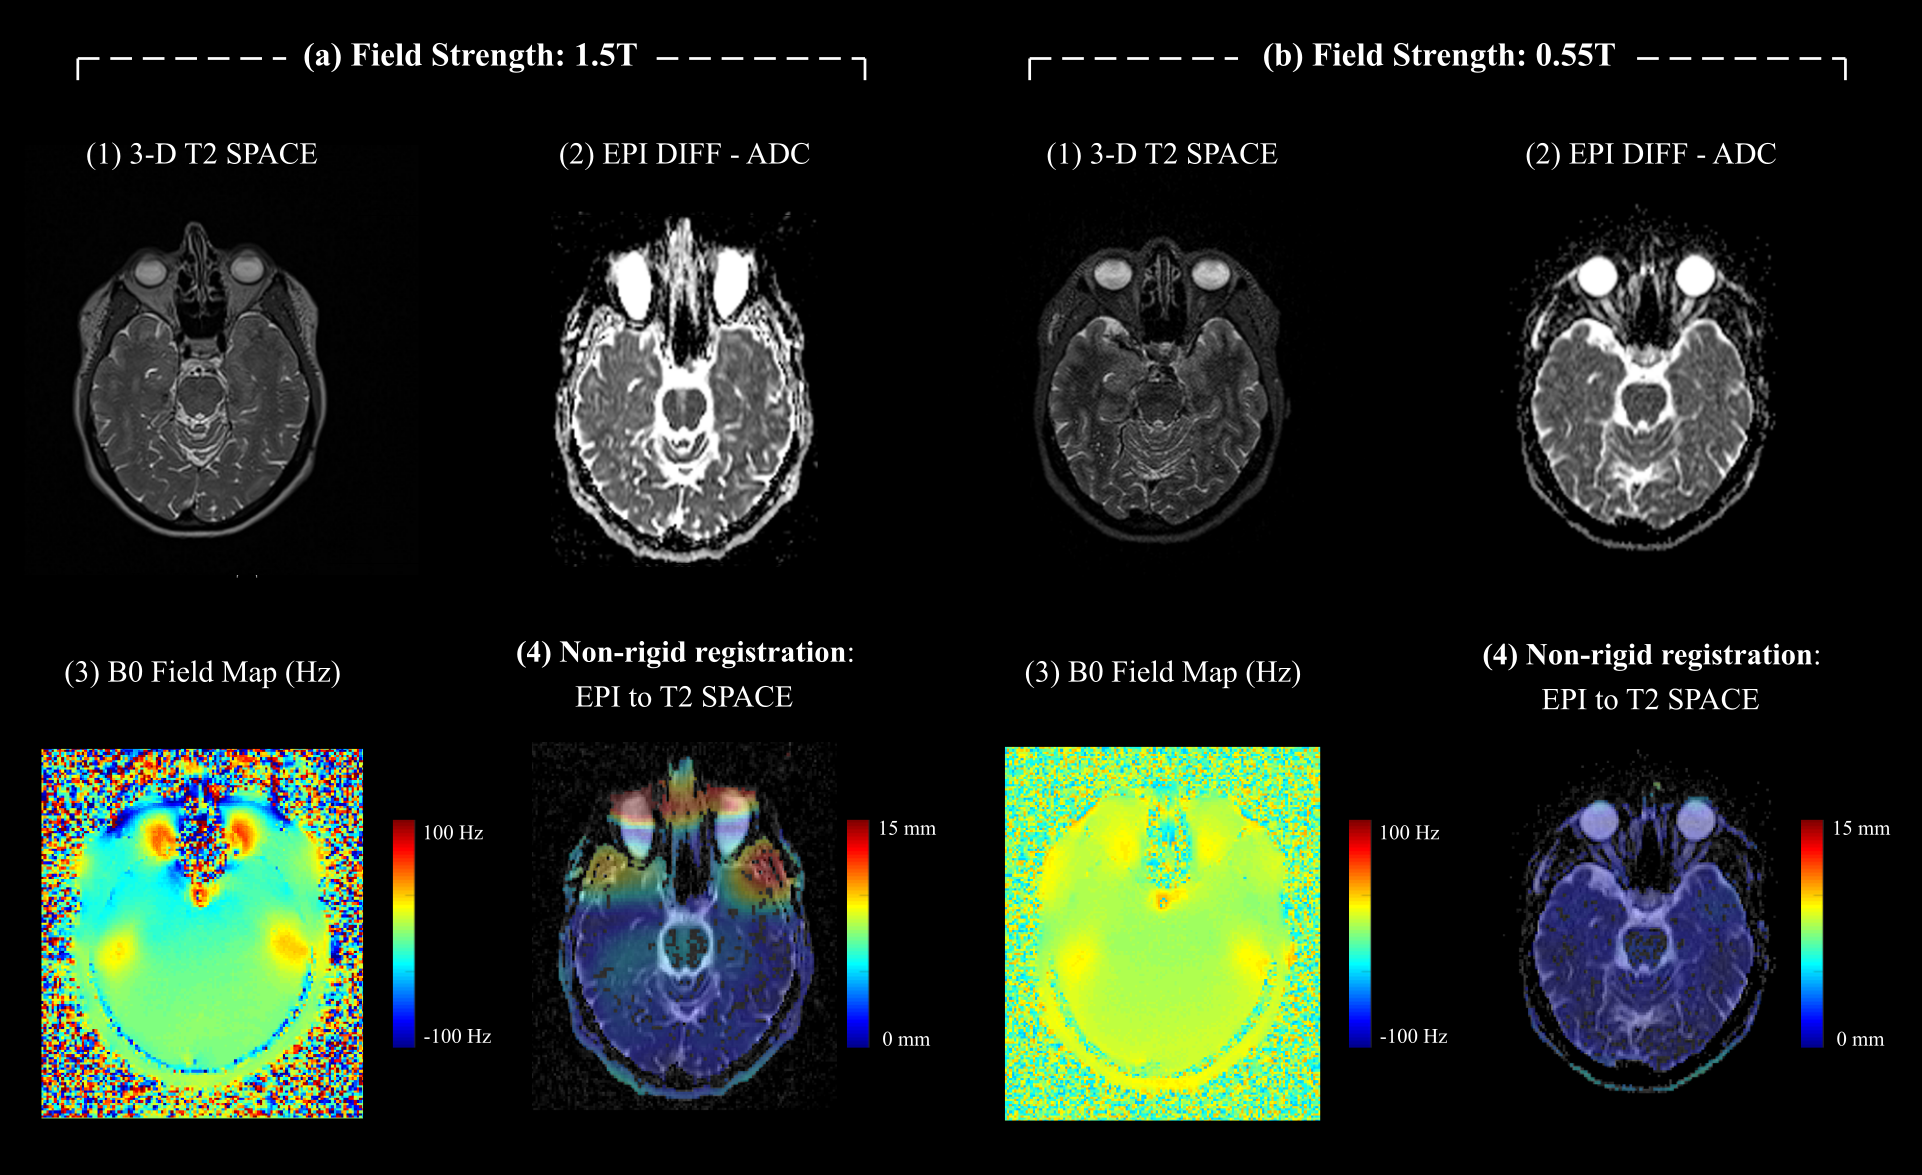
Evaluation: Gradient non-linearities have the same impact on geometric integrity of the in vivo EPI and SPACE images. Therefore, non-rigid registration between ADC and T2 SPACE reference images was performed. Mean and standard deviation of the resulting distortion vectors across all volunteers were used as a measure of ADC map distortion due to B0 field inhomogeneities and susceptibility. Additionally, we report mean and standard deviation of the minimal, maximal, and interquartile range (IQR) B0 off-resonance values across all volunteers in Hz in a slice covering the optic nerve.
RESULTS AND DISCUSSION
Figure 1 depicts reconstructed images of the performed Bloch simulations for 1.5T (left) and 0.55T (right). Smaller overall distortion in the simulations that consider B0 field inhomogeneities (“Simulation B0”) compared to the ideal simulations can be observed at 0.55T compared to 1.5T.Figure 2 depicts resulting images of the described in vivo study. Qualitatively, ADC maps acquired at 0.55T allowed better delineation of structures in high-susceptibility regions, such as the optic nerve. Quantitatively, imaging at 0.55T resulted in reduced mean ADC map distortion in a slice covering the optic nerve across all volunteers (1.8±0.3 mm) compared to ADC maps acquired at 1.5T (4.6±0.3 mm). Minimal, maximal, and IQR off-resonance B0 map values of -40±8 Hz, 56.3±9 Hz, and 13±2 Hz (at 1.5T) as well as -19±11 Hz, 28±4 Hz, and 5±1 Hz (at 0.55T) indicate smaller B0 map variance at low field compared to higher fields.
CONCLUSION
Imaging with less geometric distortion due to B0 susceptibility artefacts to support accurate MR in RT planning is achievable at 0.55T compared to higher field strengths.Acknowledgements
No acknowledgement found.References
1) Blumhagen, Jan O., et al. Magnetic Resonance in Medicine 70.4 (2013): 1047-1057.
2) Haacke, E. Mark, et al. Magnetic resonance imaging: physical principles and sequence design. Vol. 82. New York:: Wiley-Liss, 1999.
3) Campbell-Washburn, Adrienne E., et al. Radiology 293.2 (2019): 384-393.
4) J. W. Massey and A. E. Yilmaz, “AustinMan and AustinWoman: High-fidelity, anatomical voxel models developed from the VHP color images,” in Proc. 38th Annual International Conference of the IEEE Engineering in Medicine and Biology Society (IEEE EMBC), Orlando, FL, Aug. 2016.
Figures