3324
Distinction of T2 quantitative measurements between the nucleus pulposus and anulus fibrosus using Gaussian-fitted histogram analysis1Tongji Hospital, Tongji Medical College, Huazhong University of Science and Technology, Wuhan, China, 2MR Research,GE Healthcare, Beijing, China
Synopsis
The distinction between the nucleus pulposus (NP) and the peripheral annulus fibrosus (AF) of intervertebral disc is an important diagnostic indicators of intervertebral disc degeneration (IVDD) on MRI. So far, there have not been many studies or mature approaches to quantify the distinction between the NP and AF. This study aimed to discover histogram distribution of the T2 relaxation time of the AF and NP using Gaussian fitting. Our results showed that Gaussian-fitted histogram analysis of T2 relaxation time could achieve quantitative distinction between the NP and AF, and computed Gaussian-fitted histogram parameters had good performance on diagnosing IVDD.
main text
Introduction and purposeIntervertebral disc degeneration (IVDD) is believed to be common and crucial cause of low back pain (LBP). With the development of the emerging treatments to IVDD, early detection and accurate grading is very important to assist the choice of therapeutic protocols 1,2. The widely-used Pfirrmann grading system3 is based on the visual interpretation and subjective qualitative assessment of the signal intensity and distinction between of the nucleus pulposus (NP) and annulus fibrosus (AF) on T2WI under the limited degeneration rank classification and low inter-observer and intra-observer reproducibility. Therefore, this study aims to assess the feasibility of a Gaussian-fitted histogram analysis on quantifying the distinction between the NP and AF and grading IVDD.
Materials and methods
This study was approved by the institutional review board of our hospital. 394 lumbar intervertebral discs (IVDs) of 61 patients with chronic LBP (>3 months duration) and 20 apparently healthy subjects (37 males and 44 females in total; age range, 23-69 years; average age 39.48±13.86 years) were examined using standard sagittal T2-weighted sequence and axial T2 mapping protocol on a 3T MRI system (GE Discovery MR 750, GE Healthcare, Waukesha, WI, USA). All IVDs on sagittal T2-weighted images were classified based on the Pfirrmann grade system3, and grade I and II were defined as “normal” and grade III to V as “abnormal”. The mean, standard deviation (SD), and the 200-binned histograms of NP and AF containing individual voxel values and corresponding frequency obtained on FireVoxel (Department of Radiology, New York University, USA). Gaussian-fitted T2-based histogram of AF and NP were respectively generated using a customed and automated algorithm in the MATLAB software R2019a (Mathworks, Natick, Massachusetts, USA). Four appearance features of the two fitted lines were extracted, including μ1 and W1 of AF, μ2 and W2 of NP (μ: Gaussian mean; W: Full width of half maxima). The correlation between all quantitative parameters and Pfirrmann grade as well as the performance of all quantitative parameters for discriminating normal and abnormal discs were assessed using SPSS 22.0 (SPSS Institute, Chicago, IL, USA).
Results
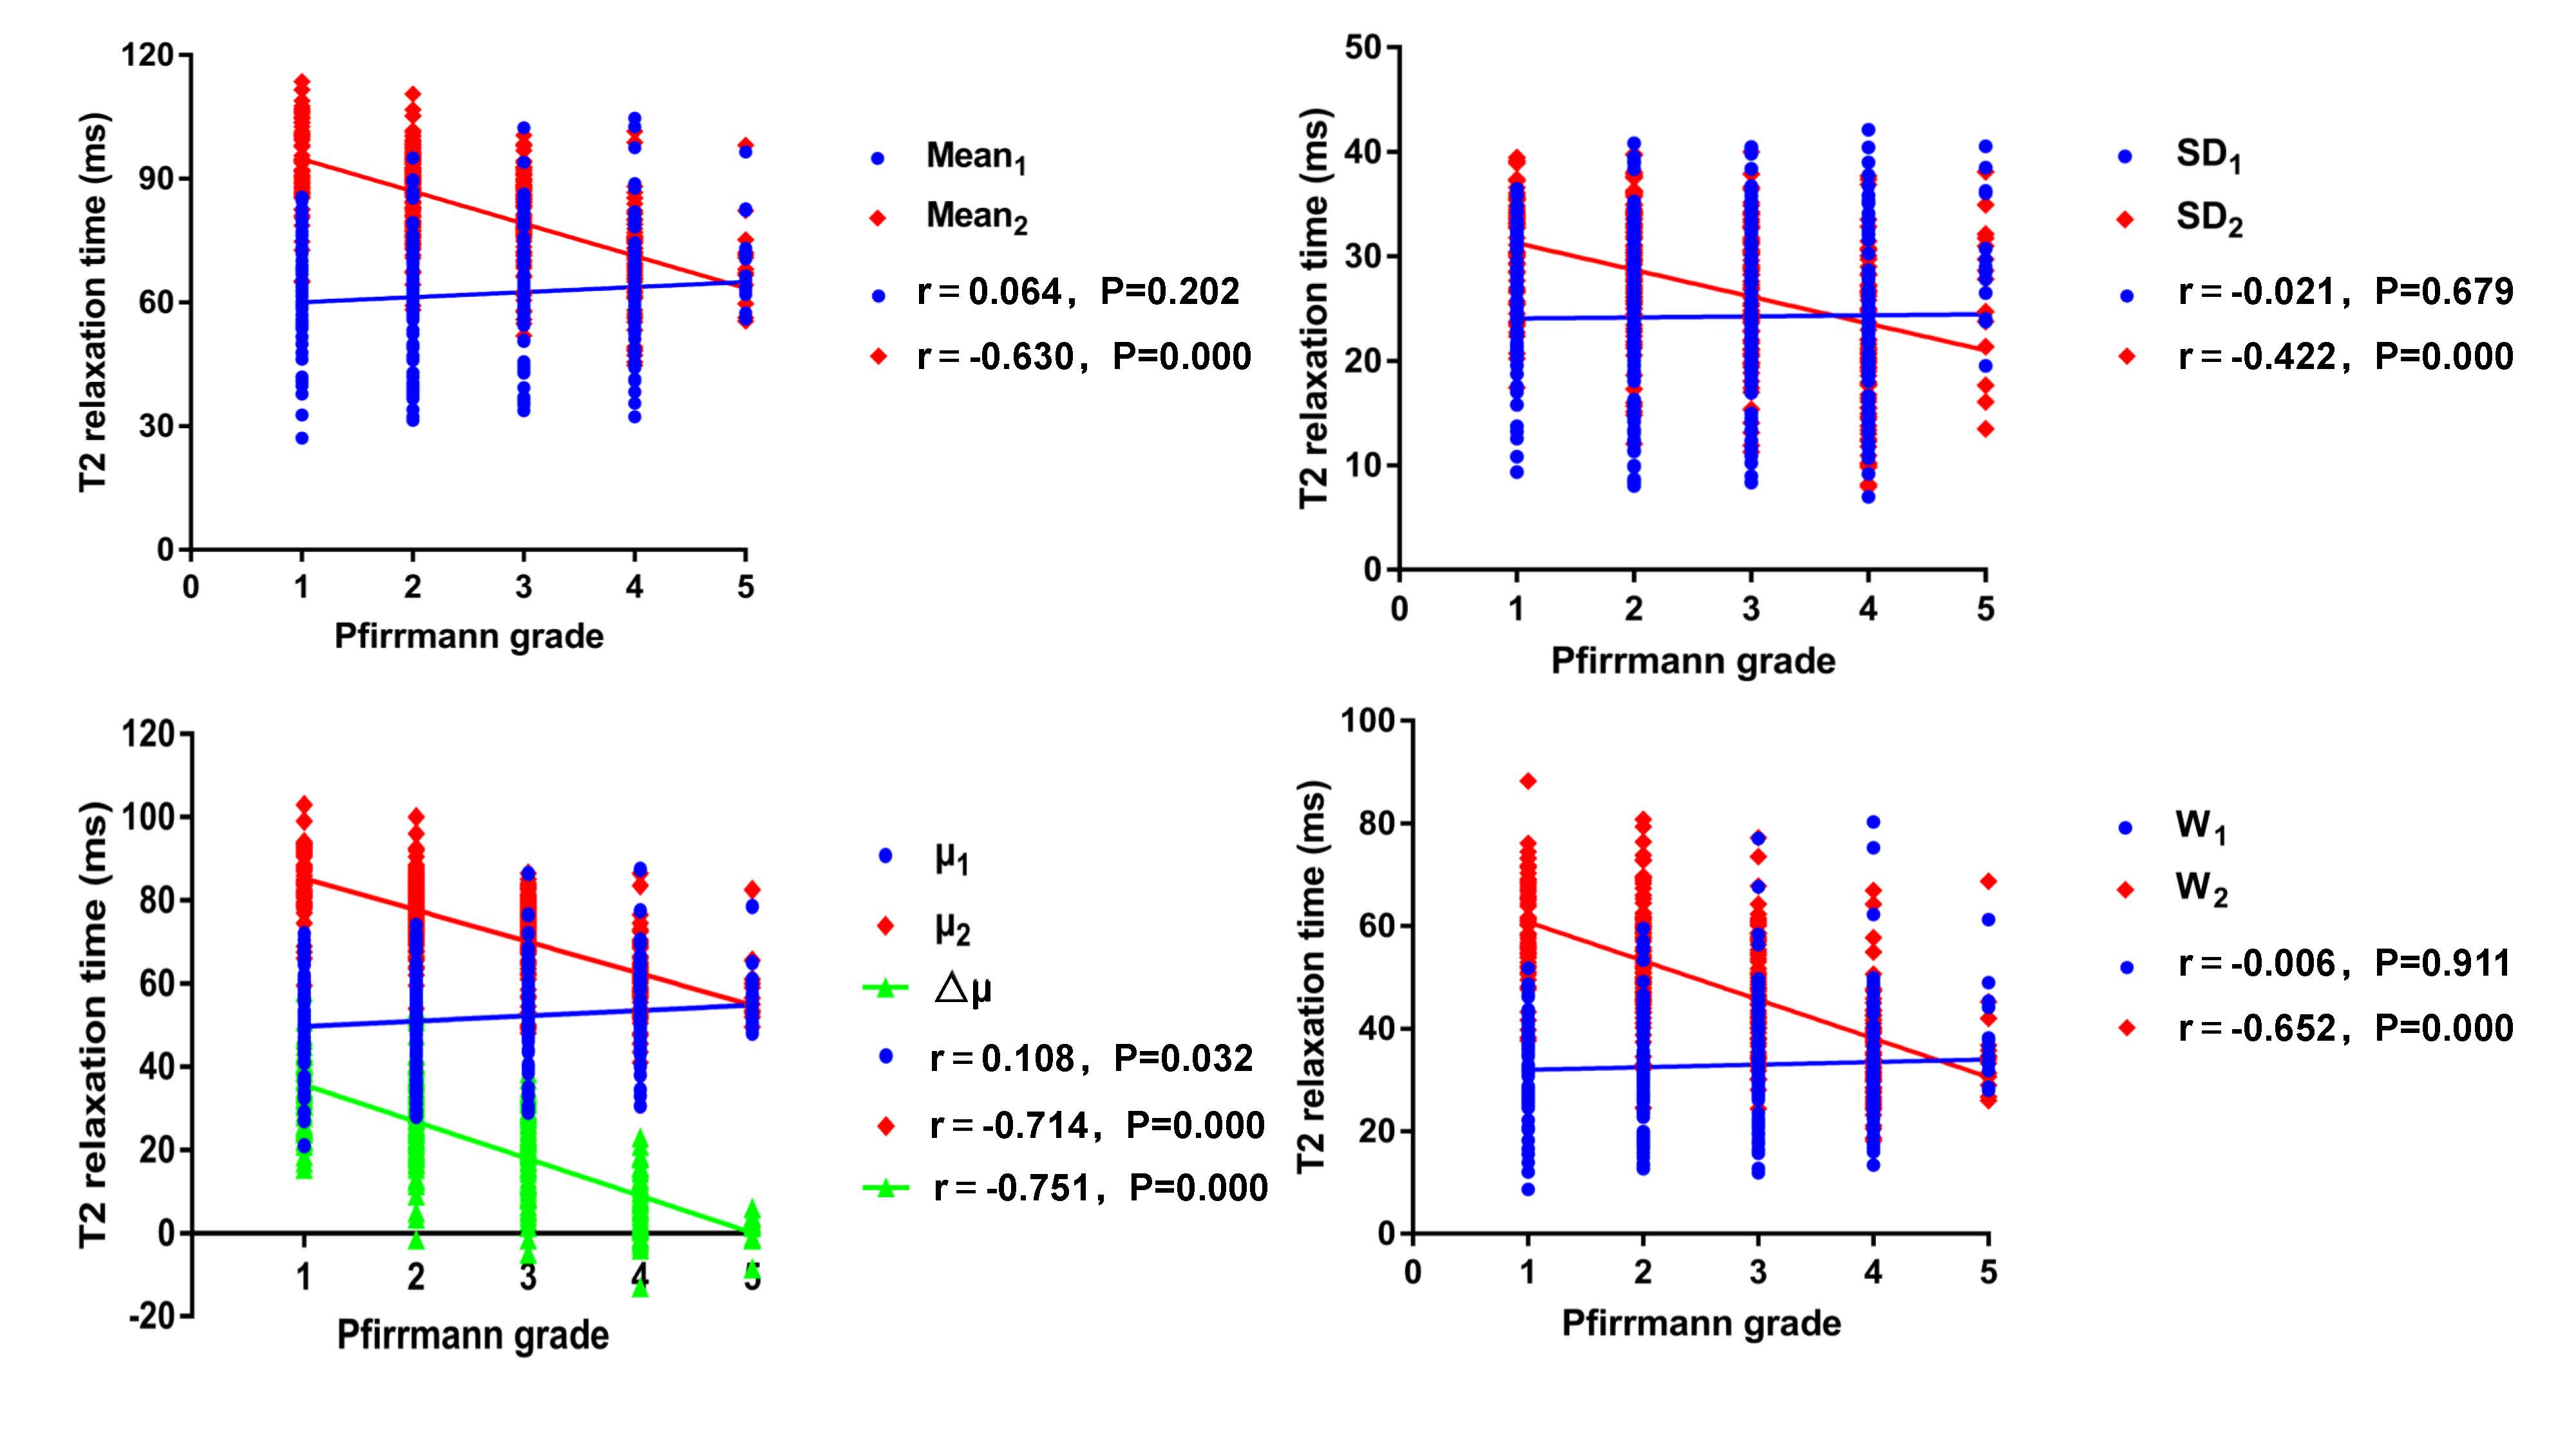
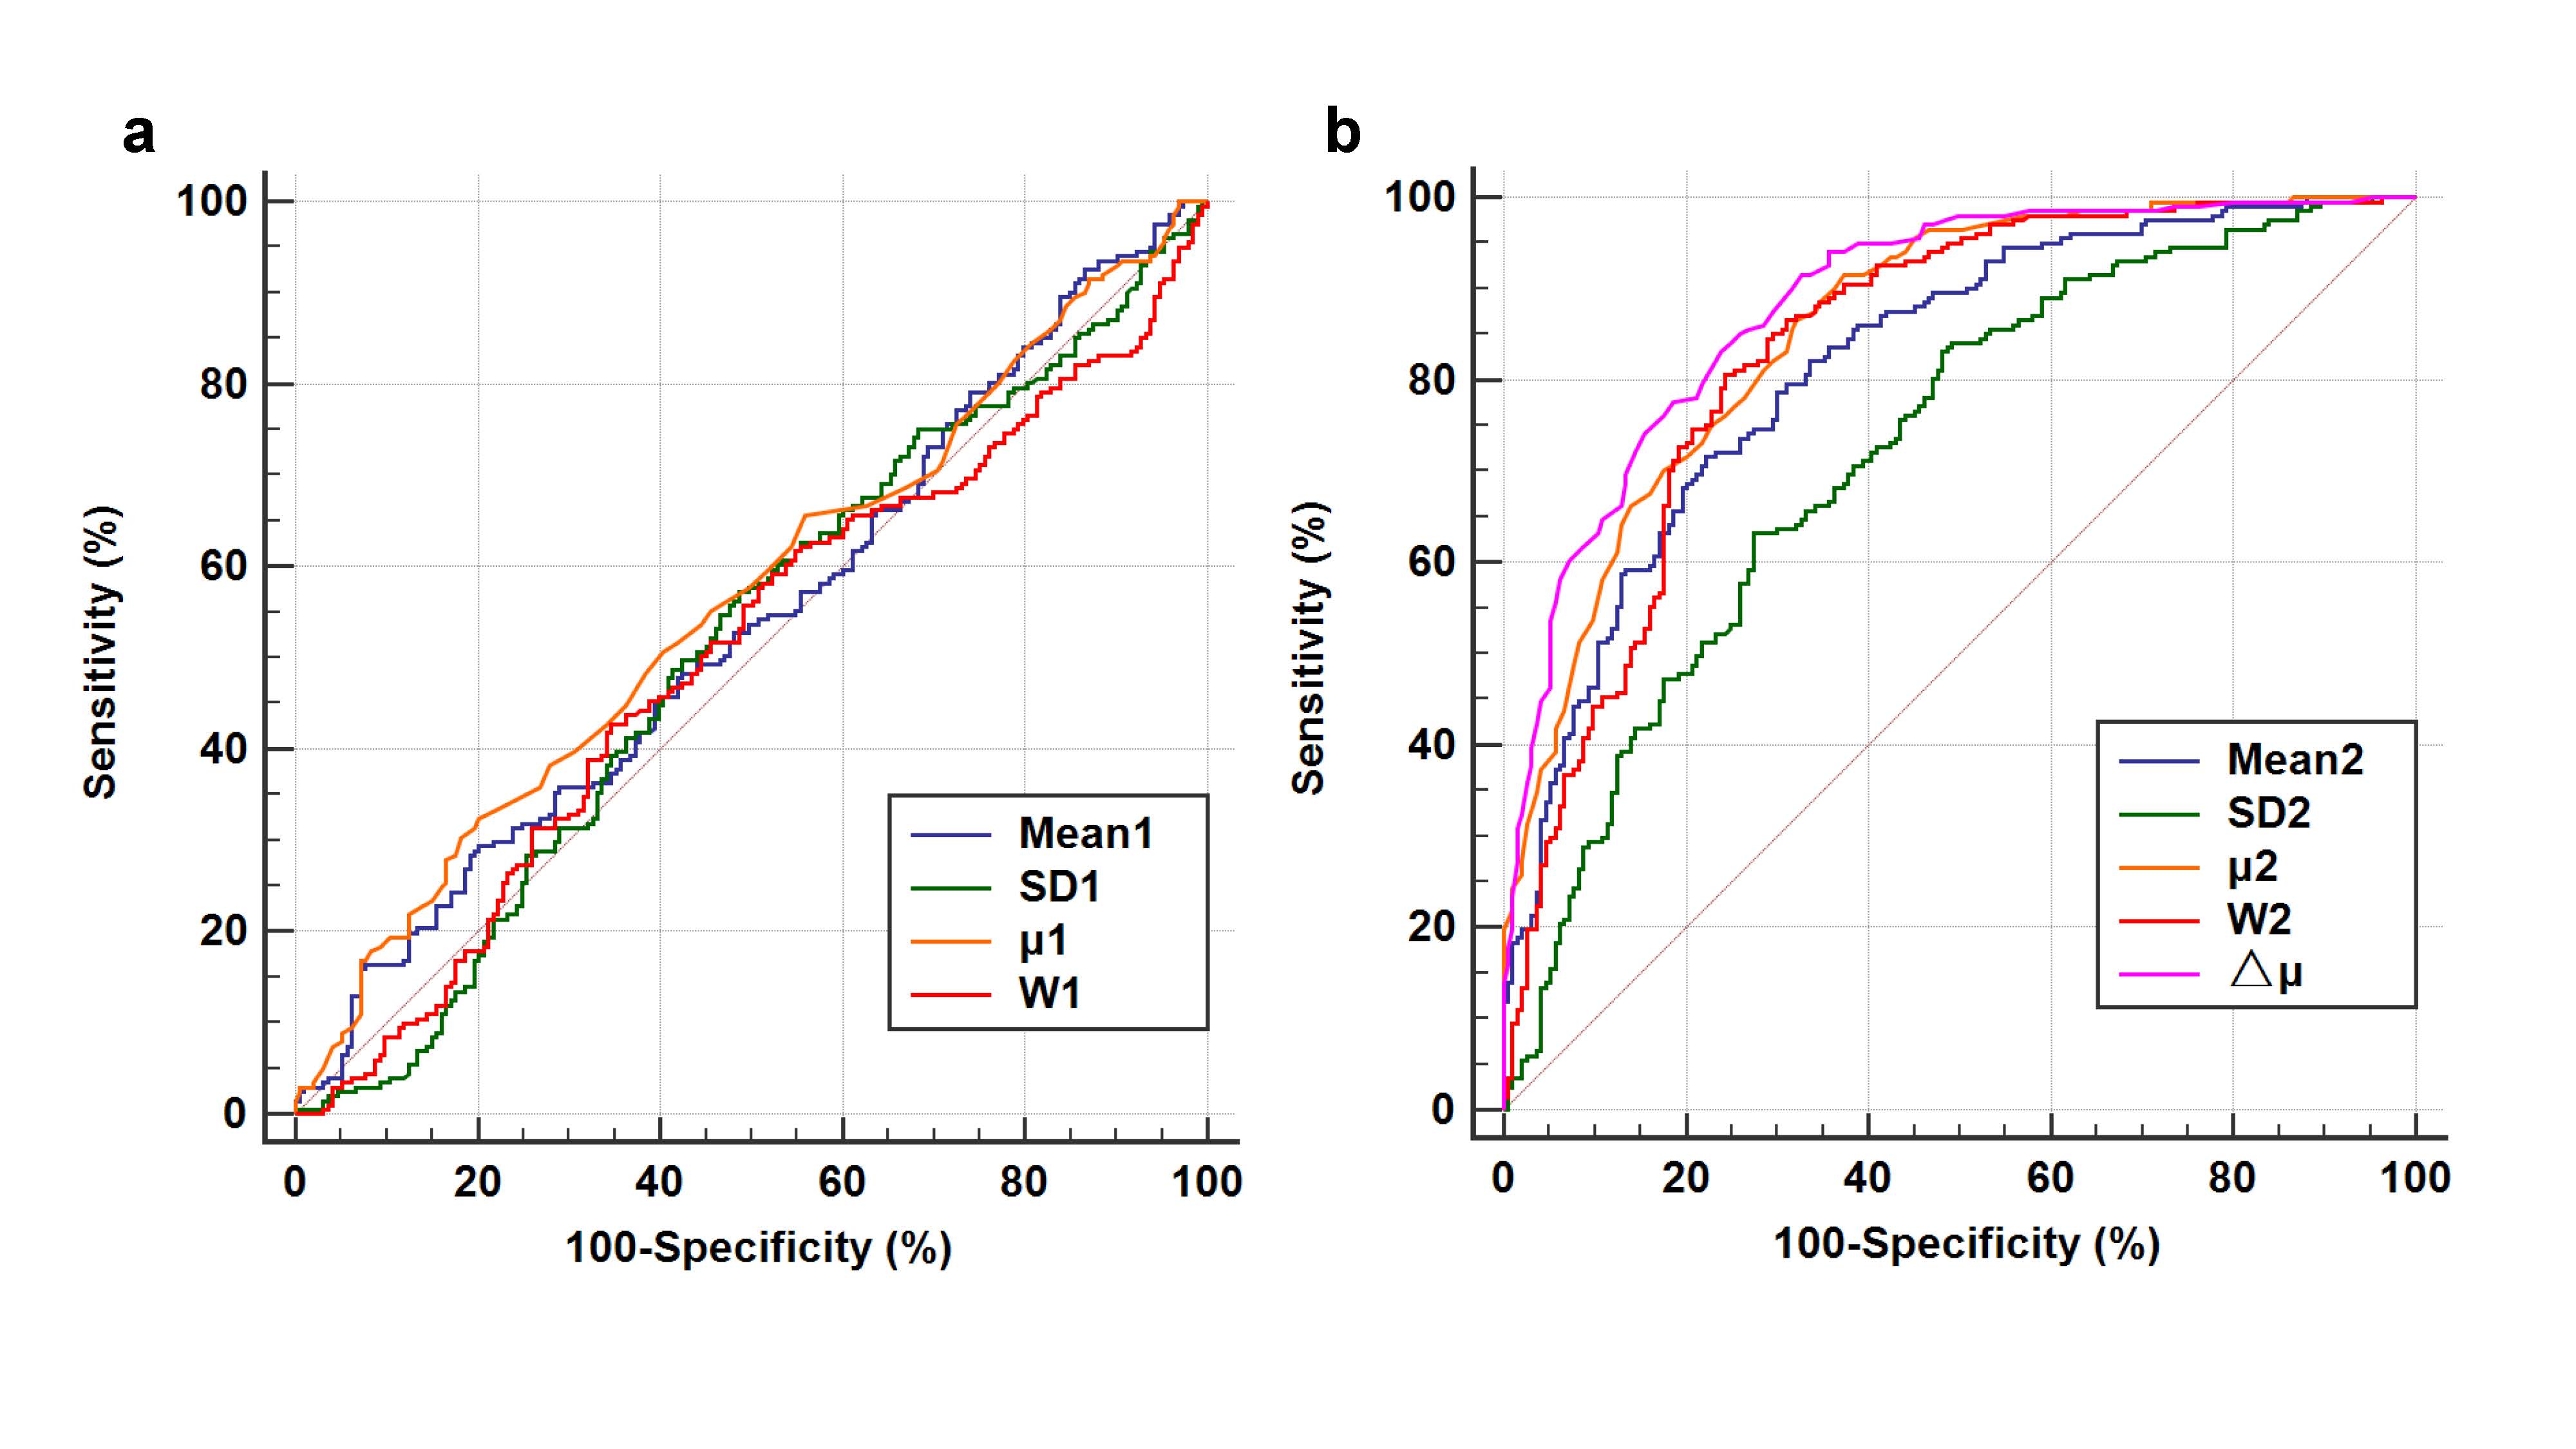
The interobserver agreement for Pfirrmann grade of 394 IVDs was good (κ = 0.715, P < 0.001). 66 (16.8%), 135 (34.3%), 96 (24.4%), 83 (21.0%) and 14 (3.5%) were classified as grade I, II, III, IV and Ⅴ accordingly according to Pfirrmann grading system3. 201 discs were defined as normal/healthy while 193 discs as abnormal/degeneration. Gaussian-fitted quantitative T2-based distribution of the AF and NP were clearly separated in the intact healthy discs (grade Ⅰ and Ⅱ). With the degeneration severity, the peak value of the NP gradually decreased and shifted towards the peak of the AF, and in the end two fitted lines overlaps mostly (Fig.1a-e) even with the peak value of NP was lower than AF (μ2<μ1, Fig. 1f). Mean1 (r = 0.064, P=0.202), SD1 (r = − 0.021, P=0.679), and W1 (r = 0.108, P=0.911) of the AF had no statistically significant correlation with Pfirrmann grading; μ1 was weakly correlated with Pfirrmann grading (r = 0.108, P=0.032). Mean2 (r = − 0.630, P=0.000), SD2 (r = − 0.422, P=0.000) and W2 (r = − 0.652, P=0.000) of the NP had moderate negative correlation with Pfirrmann grading, μ2 (r = − 0.714, P=0.000) and △μ (r = − 0.751, P=0.000) were highly correlated to Pfirrmann grading (Fig. 2). Similarly, all parameters of the AF have very low AUC (0.501-0.561) for identifying normal and abnormal IVDs (Fig. 3a). All Gaussian parameters of the NP and △μ generated higher AUC (△μ, 0.885; μ2, 0.859; W2, 0.834) than Mean2 (AUC 0.818) and SD2 (AUC 0.723)(Fig. 3b).
Discussion and conclusions
Previous study4 has performed two component Gaussian mixture models on intervertebral discs based T2 value and showed that the peak separation of the Gaussian distributions was strongly correlated with Pfirrmann grade. In this study, we respectively fitted and obtained the Gaussian distribution of the AF and NP, which can distinctly demonstrate the distribution contours of the AF and NP on the T2 histograms no matter how much they overlapped. In addition, our fitted model detected some unusual phenomenon that the T2 value distribution of NP was lower than the AF in some discs, which is difficult to detect using a mixed model. This condition may indicate some certain disc diseases, such as AF fissures5. The current results showed that all T2 quantitative parameters of the NP decreased significantly with increasing grades and had great ability of discriminating healthy from degenerative IVDs, particularly the Gaussian parameters μ2 and △μ. This study illustrates the feasibility of Gaussian-fitted histogram analysis on quantification of the distinction between the NP and AF (△μ) and IVDD detection.
Acknowledgements
Funding: This work was supported by projects of the National Natural Science Foundation of China (NSFC) (No. 31630025 and 81930045)References
1. Davies BM, Atkinson RA, Ludwinski F, Freemont AJ, Hoyland JA, Gnanalingham KK (2016) Qualitative grading of disc degeneration by magnetic resonance in the lumbar and cervical spine: lack of correlation with histology in surgical cases. Br J Neurosurg 30:414-421
2. Michopoulou S, Costaridou L, Vlychou M, Speller R, Todd-Pokropek A (2011) Texture-based quantification of lumbar intervertebral disc degeneration from conventional T2-weighted MRI. Acta Radiol 52:91-98
3. Pfirrmann CW, Metzdorf A, Zanetti M, Hodler J, Boos N (2001) Magnetic resonance classification of lumbar intervertebral disc degeneration. Spine (Phila Pa 1976) 26:1873-1878
4. Waldenberg C, Hebelka H, Brisby H, Lagerstrand KM (2018) MRI histogram analysis enables objective and continuous classification of intervertebral disc degeneration. Eur Spine J 27:1042-1048
5. Ohtori S, Inoue G, Miyagi M, Takahashi K (2015) Pathomechanisms of discogenic low back pain in humans and animal models. Spine J 15:1347-1355
Figures
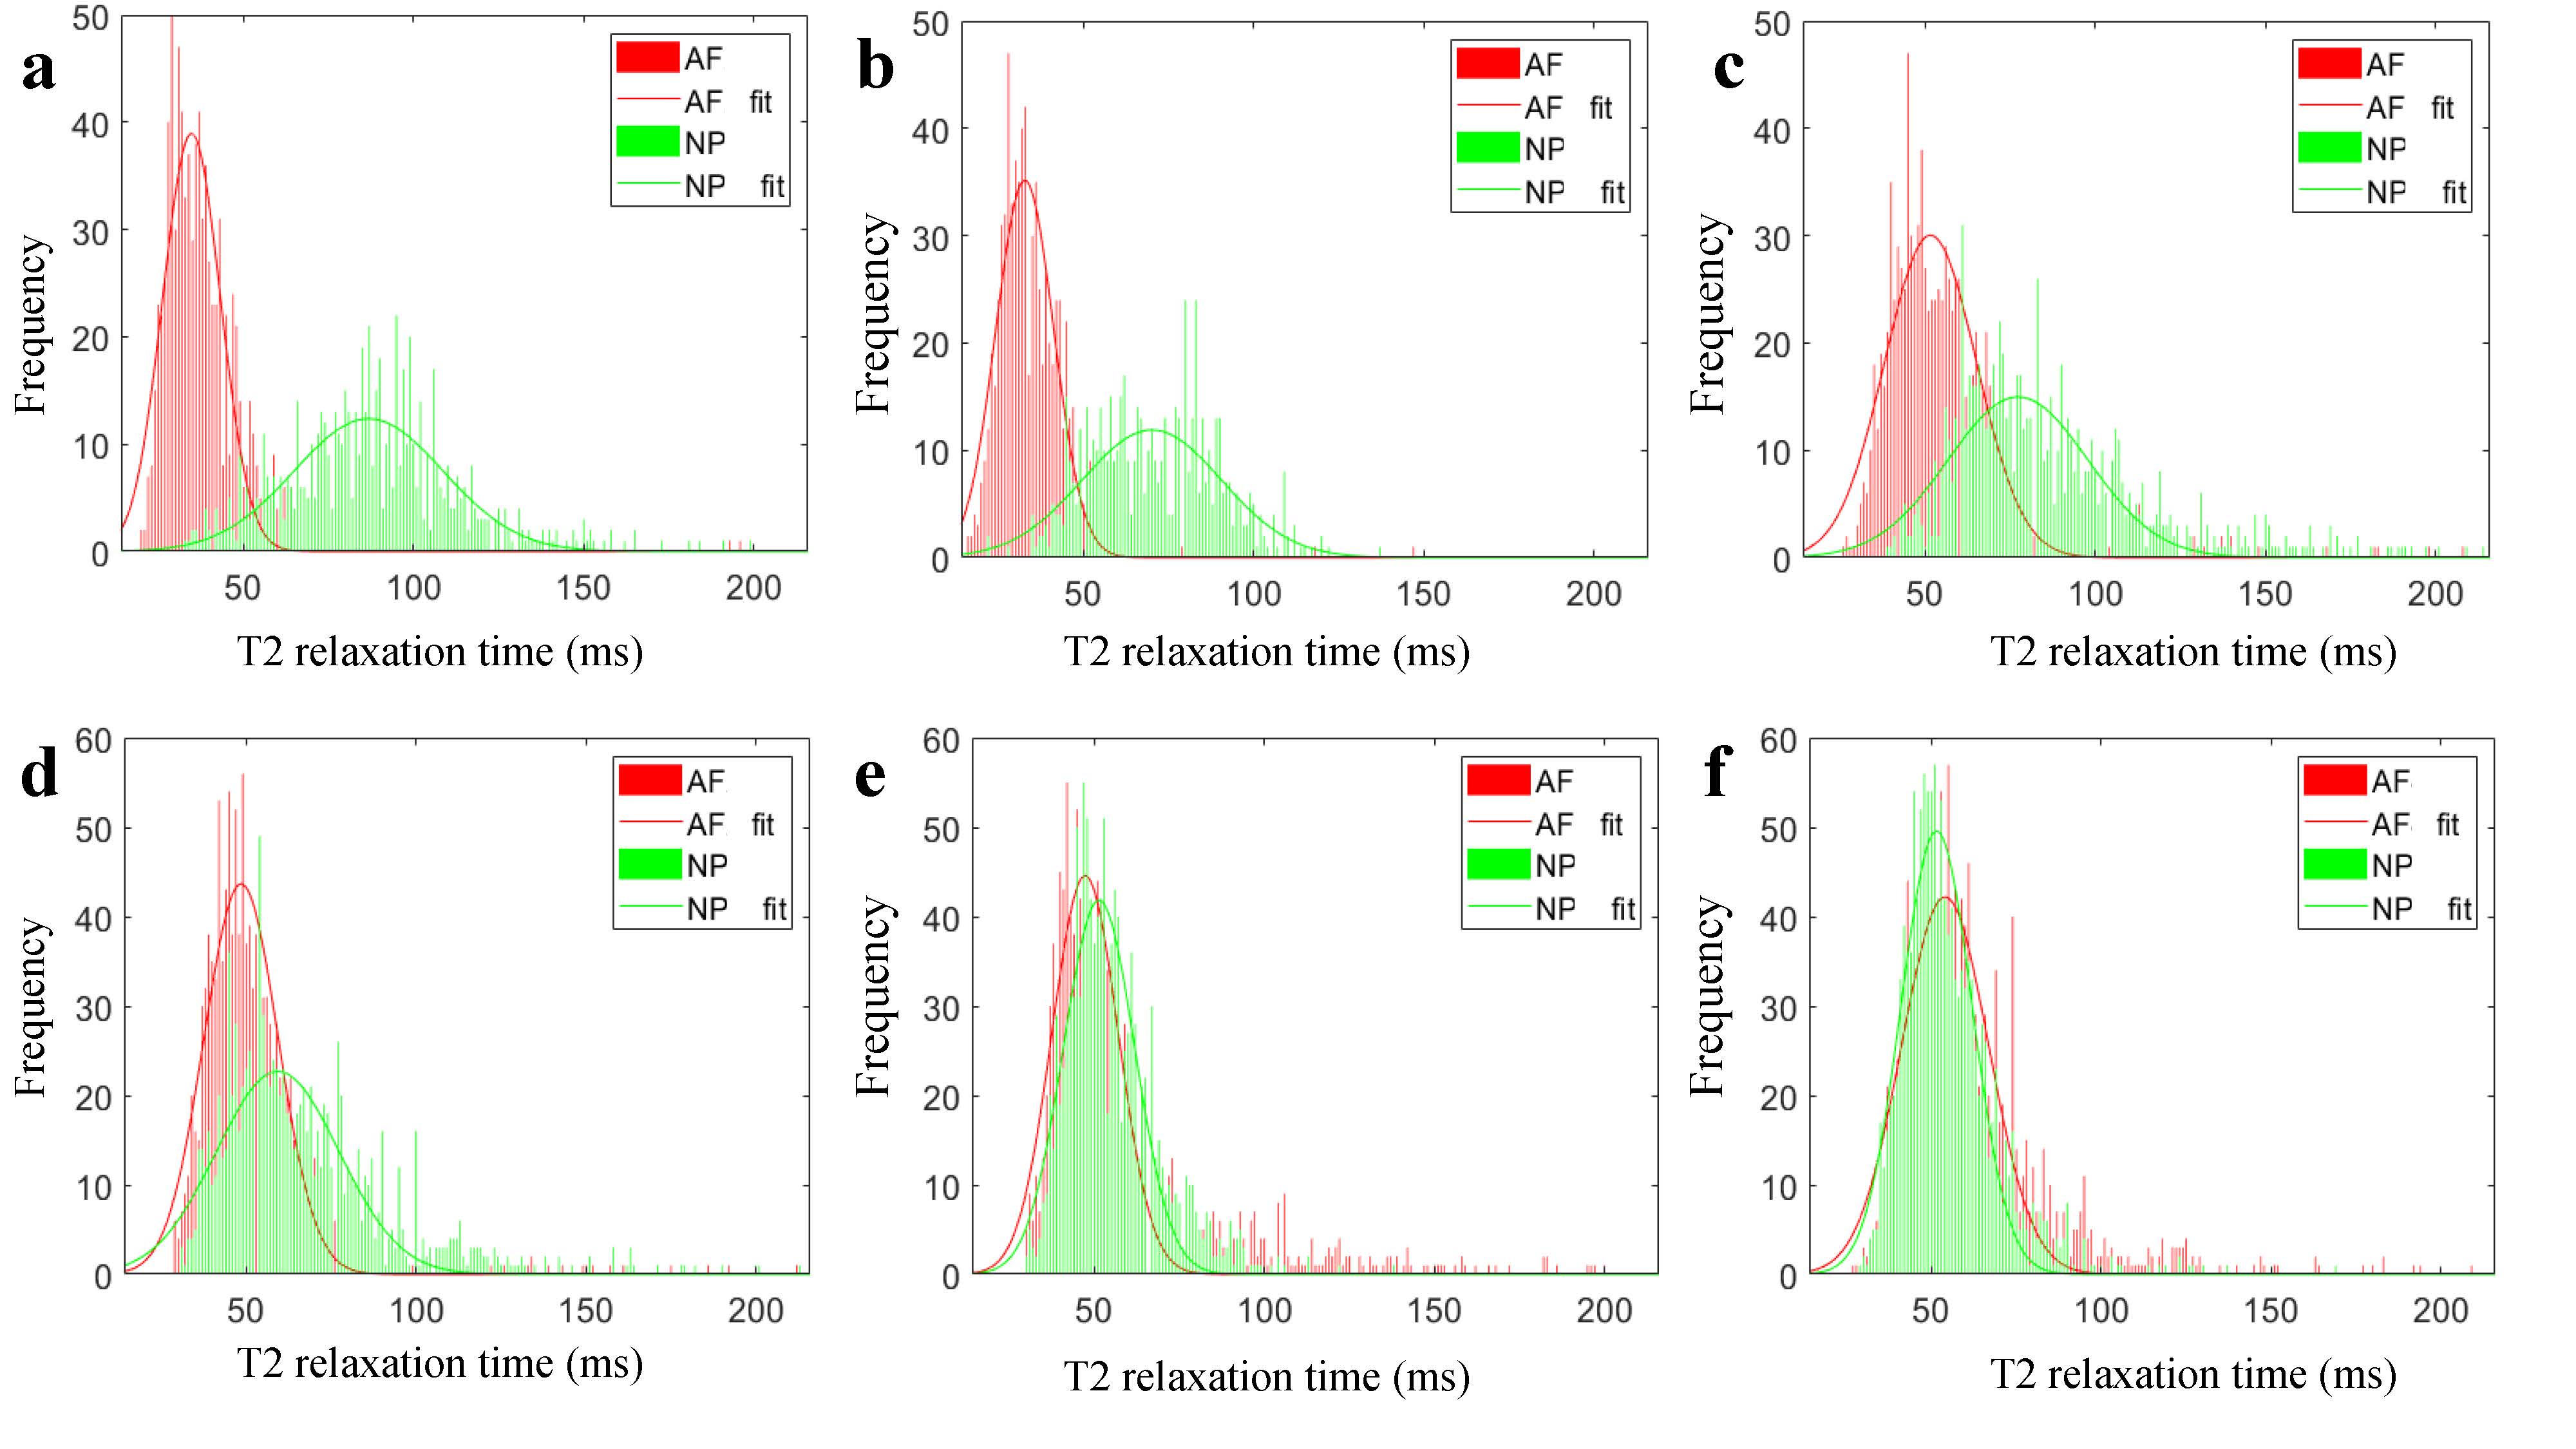
Figure.1 T2 histograms and Gaussian distributions of AF and NP.
a-e: Pfirrmann grade I-Ⅴ discs. The peak value of the NP gradually decreased and shifted towards the peak of the AF with the increasing grades.
f: The peak value of the NP was significantly lower than the AF of grade Ⅳ disc.