3323
T1rho Dispersion Imaging of Intervertebral Discs1Barrow Neurological Institute, Phoenix, AZ, United States, 2Institute of Imaging Science, Vanderbilt University, Nashville, TN, United States
Synopsis
This study aims to develop a T1ρ dispersion protocol method for human lumbar spine imaging, with a specific goal to detect proteoglycan loss in the intervertebral disc (IVD), which is an initial step in degenerative disc disease (DDD). T1ρ dispersion parametric images are able to distinguish the nucleus pulposus from annulus fibrosus based on differences in exchangeable protons, as predicted theoretically. This work is relevant for clinical applications for DDDas it provides novel, quantitative, and clinically translatable in vivo imaging biomarkers capable of detecting proteoglycan changes.
INTRODUCTION
This study aims to develop an imaging technique using T1ρ dispersion to assess proteoglycan changes in the extracellular matrix (ECM) in degenerative disc disease (DDD). DDD is caused by cellular, biochemical, and structural alterations that lead to a reduction in the number of cells in the intervertebral disc (IVD) and the loss of the ECM components,1 in which the loss of proteoglycans in the nucleus pulposus (NP) is thought the initial step in a degenerative cycle that is followed by a reduction in osmotic pressure in the disc matrix and a loss of water molecules.2,3 The IVD consists of two main structures, the nucleus pulposus and the annulus fibrosus (AF), see Fig. 1, with the NP composed of mainly water and proteoglycans, opposite to the AF that consists of mainly collagen. T1ρ dispersion imaging can in principle provide a quantitative characterization of tissue composition and alterations associated with pathology.4-6 Our recent studies suggest that at high fields (>= 3T) T1ρ dispersion specifically reflects the contribution of chemical exchange to transverse relaxation, and likely reflects the concentration of exchangeable species in tissue that exchange at an appropriate rate.7-9 T1ρ dispersion has been used previously in tissues to assess glycosaminoglycan (GAG, a side chain of proteoglycan) content, but it has not been used in IVD. In this study, we measured T1ρ dispersion on healthy volunteers to evaluate the feasibility of using T1ρ dispersion in future applications of DDD.METHODS
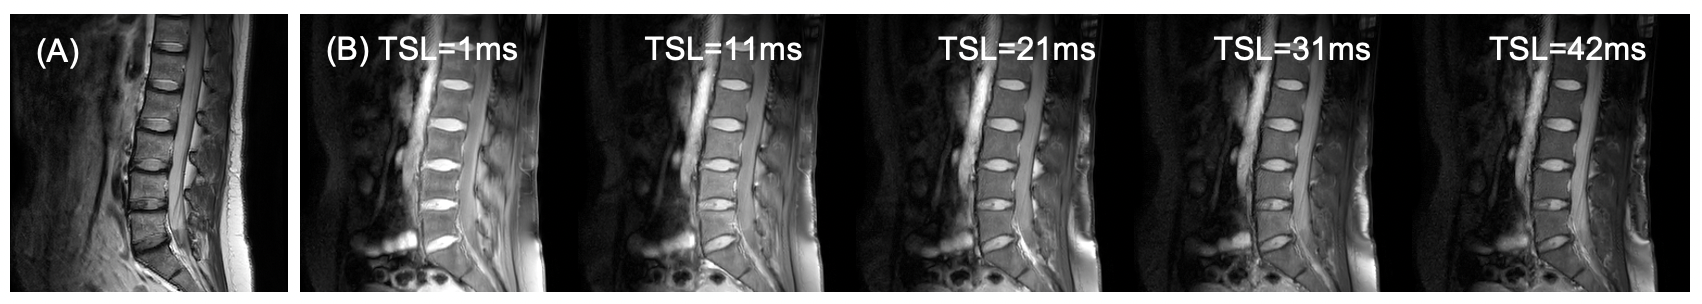
MRI was performed on a Philips 3T Ingenia scanner with a ds-posterior spine coil (Philips Healthcare, Best, The Netherlands). Two healthy volunteers underwent T1ρ imaging using an MRI sequence as described previously.10 The parameters are field of view = 322x378mm2, pixel size = 1x1mm2, thickness = 5mm, matrix = 256x256. Five spin-lock times (TSLs) = [1ms, 11ms, 21ms, 31ms, 41ms] are used with a TSE (turbo spin echo) sequence for data acquisition. Repetition time (TR) = 3000ms, and echo time (TE) = 5.8ms, TSE factor = 16 (low-high profile), and CS-SENSE factor = 4, bandwidth = 122Hz/pixel, signal average = 1, resulting in a total scan time of 02m 16s. T1ρ values can be calculated by fitting the signal to a mono-exponential decay. According to our theoretical analyses,7 variations of T1ρ between 0 and ~100Hz mainly reflect the contribution of diffusion-induced dephasing in gradients, while the difference between 100Hz and above reflects mainly chemical exchange effects. Considering the power limit of the RF (radiofrequency) amplifier, we chose the low spin-lock frequency (FSLlow) = 100Hz and the high spin-lock frequency (FSLhigh) = 300Hz to calculate a T1ρ difference, i.e., ΔT1ρ = T1ρ(300Hz) - T1ρ(100Hz).9 To view the effect of constituent differences, we purposely set up an oblique slice (relative to the spine axis) with the upper disc level covering more nucleus pulposus and less annulus fibrosus, while the lower disc level covering less nucleus pulposus and more annulus fibrosus.RESULTS
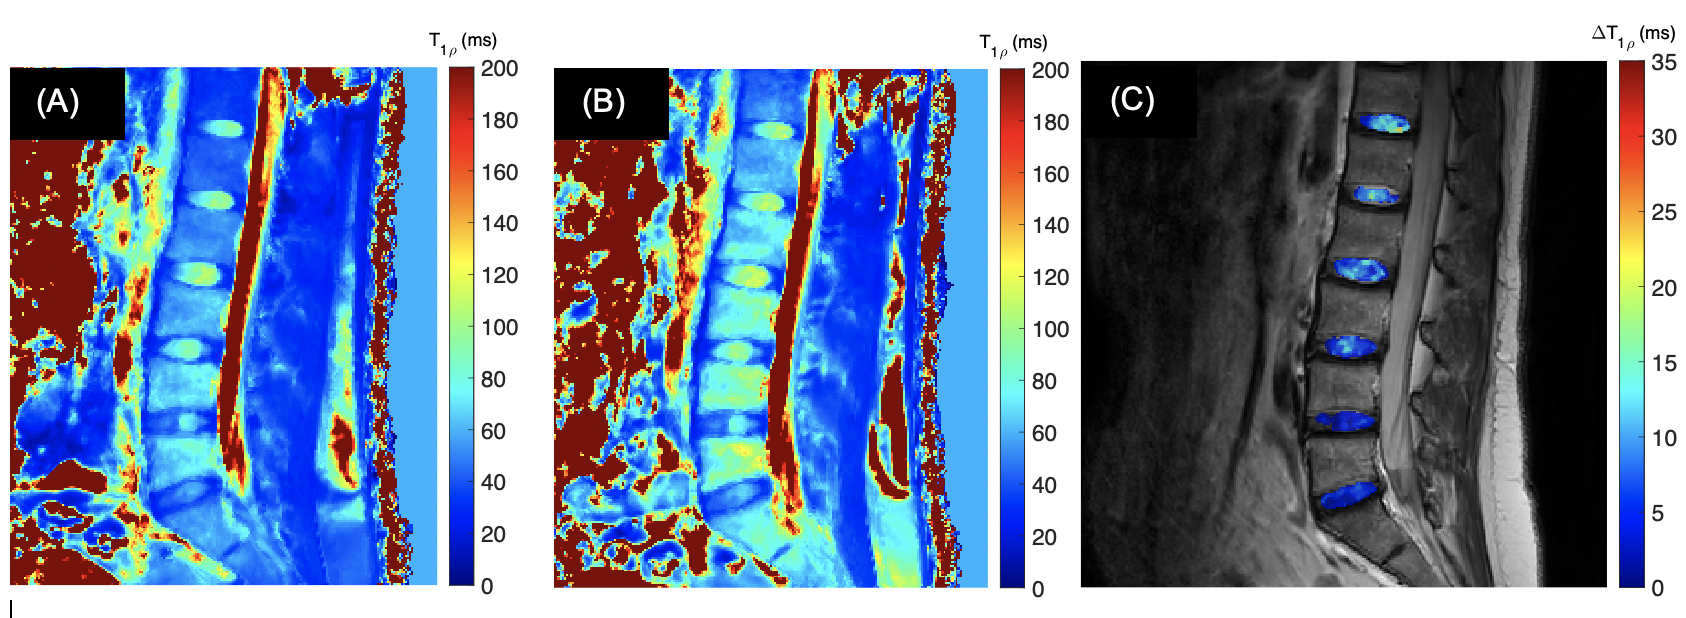
Fig. 2 shows an example of T1ρ imaging from a volunteer. Fig. 3 (A) - (B) show the T1ρ maps acquired under FSL = 100Hz and FSL = 300Hz, the measured median T1ρ value in the disc area is 65.1ms and 84.3ms, respectively. The T1ρ dispersion in the disc areas, as represented by ∆T1ρ = T1ρ(300Hz) - T1ρ(100Hz), is shown in Fig. 3 (C). Note that the T1ρ dispersion (i.e., ∆T1ρ) clearly distinguishes the inner NP and the outer AF, the value of map is expected to report the concentration of exchangeable protons in the region.DISCUSSION
We have showed that T1ρ dispersion imaging was feasible for IVD imaging with a practical scan time. The T1ρ dispersion showed its capability to distinguish NP from AF. Whether their different relaxation characteristics reflect differences in exchanging protons, exchange rates or water content remains to be clarified using additional quantification. For the GAG-rich NP region, the exchangeable protons are known to be hydroxyl protons, which may play a key role in the early detection of DDD due to proteoglycan loss. This has the potential to significantly improve DDD diagnosis and assessments of treatment response.CONCLUSION
We have successfully developed a T1ρ dispersion imaging technique for human lumbar spine, which is expected to detect GAG (or proteoglycan) loss in early intervertebral disc degeneration.Acknowledgements
The authors would like to thank the Philips Healthcare's support.References
1. de Oliveira CP, Rodrigues LM, Fregni MV, et al. Extracellular matrix remodeling in experimental intervertebral disc degeneration. Acta trOop Bras. 2013; 21(3): 144-149.
2. Tanaka N, An HS, Lim TH, et al. The relationship between disc degeneration and flexibility of the lumbar spine. Spine J. 2001; 1(1): 47-56.
3. Paul CPL, Smit TH, de Graaf M, et al. Quantitative MRI in early intervertebral disc degeneration: T1rho correlates better than T2 and ADC with biomechanics, histology and matrix content. PLoS One. 2018; 13(1): e0191442.
4. Duvvuri U, Goldberg AD, Kranz JK, et al. Water magnetic relaxation dispersion in biological systems: the contribution of proton exchange and implications for the noninvasive detection of cartilage degradation. Proc Natl Acad. 2001; 98(22): 12479-12484.
5. Cobb JG, Xie J, Gore JC. Contributions of chemical exchange to T1rho dispersion in a tissue model. Magn Reson Med. 2011; 66(6): 1563-1571.
6. Hills BP, Babonneau F. A quantitative study of water proton relaxation in packed beds of porous particles with varying water content. Magn Reson Imaging. 1994; 12(6): 909-922.
7. Cobb JG, Xie J, Gore JC. Contributions of chemical and diffusive exchange to T1rho dispersion. Magn Reson Med. 2013; 69(5): 1357-1366.
8. Wang P, Block J, Gore JC. Chemical exchange in knee cartilage assessed by R1rho (1/T1rho) dispersion at 3T. Magn Reson Imaging. 2015; 33(1): 38-42.
9. Wang P, Zhu H, Kang H, Gore JC. R1rho dispersion and sodium imaging in human calf muscle. Magn Reson Imaging. 2017; 42: 139-143.
10. Witschey WR, Borthakur A, Elliott MA, et al. Artifacts in T1rho-weighted imaging: compensation for B1 and B0 field imperfections. J Magn Reson. 2007; 186(1): 75-85.
Figures
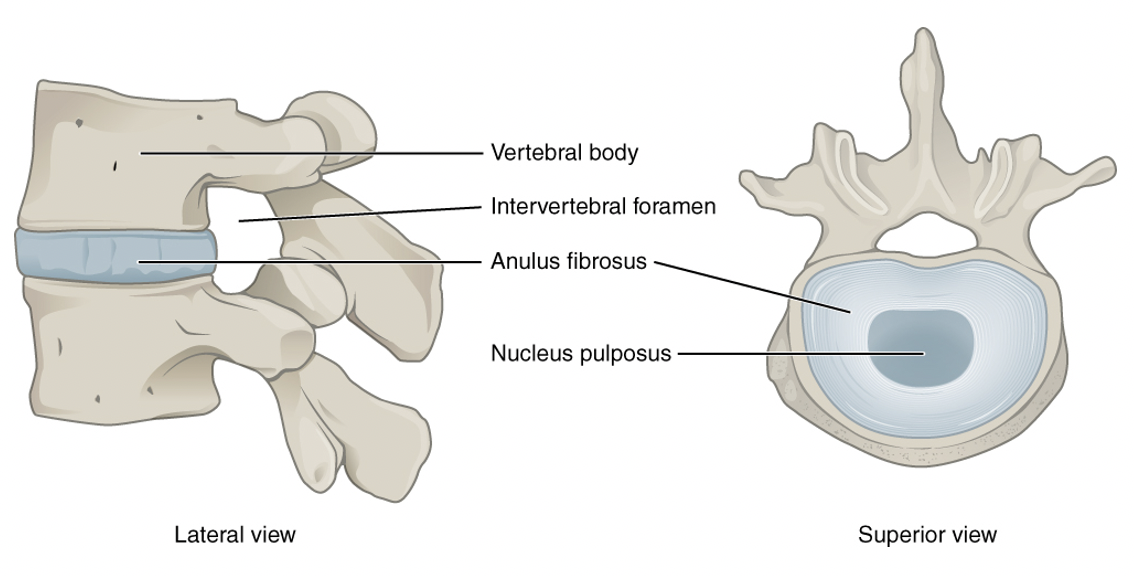
Fig. 1: Structure of the intervertebral disc that consists of two main parts, the nucleus pulposus and the annulus fibrosus.
(Picture adopted from: https://en.wikipedia.org/wiki/Intervertebral_disc)