3322
Reliability and reproducibility of synthetic spine MRI with different coils1Tongji Hospital, Tongji Medical College, Huazhong University of Science and Technology, Wuhan, China, 2MR Research, GE Healthcare, Beijing, China
Synopsis
Multiple relaxation quantitative maps can be obtained from a single scan with synthetic MRI. Previous researches have investigated this technique in lumbar spine applications, but coil selection, which may introduce bias into the quantitative data, has not been taken into account. In this study, we compared the measured quantitative parameters (T1, T2, and PD) using three coils separately and evaluated data reliability and repeatability. Coil selection contributes to differences in measurements of lumbar spine synthetic MRI, which should be concerned in future studies.
Introduction
Synthetic MRI is a novel method that allows images with multiple contrasts and quantitative relaxation maps to be obtained in a single scan.1 The quantitative parameters (T1, T2, and PD) in reflection of inherent tissue properties have been used in many studies.2,3 To have reliable and repeatable data is essential for research; otherwise, the “normal” or “abnormal” characterization of T1, T2, and PD values would be considered invalid. Previous studies have demonstrated the effect of different coils on acquired tissue relaxation parameters in knee joint.4,5 There have been several studies of synthetic MRI on lumbar spine imaging;2,6 however, no one has specifically focused on the use of coils. Thus, our research aims to investigate the influence of different coils on the quantitative data of lumbar spine acquired by synthetic MRI.Methods
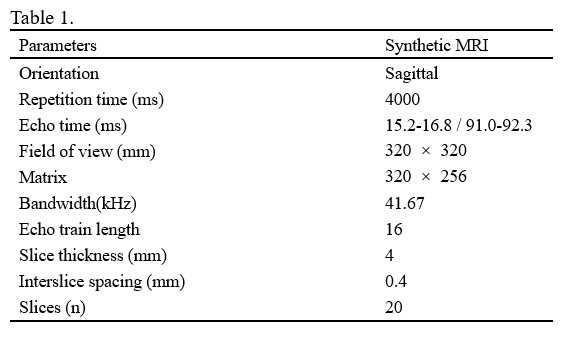
This study was approved by the institutional review board of our hospital. Thirty intervertebral discs (IVDs) from T12-L1 to L5-S1 and thirty vertebral bodies from T12 to L5 of five healthy volunteers (five women, mean age was 25.2 years, ranged 24-27 years) were recruited. All volunteers underwent the synthetic MRI (Magnetic Resonance Image Compilation, MAGiC) sequence on 3.0 T MRI system (Signa Pioneer, GE Healthcare, Milwaukee, USA) with the main parameters presented in Table 1. Three types of coils were used: (Ⅰ) a 32-element spine coil with the Digital Surround Technology (DST) (Spine 32 DST 4, abbreviated as “Spine DST”), (Ⅱ) an anterior 32-element body phased-array coil and a 32-element posterior spine coil (Body 32 4, termed as “Body”), (Ⅲ) a 16-channel large phased-array receive only flex coil (termed as “Flex Large”). Each subject underwent lumbar spine MAGiC sequence scanning using three different coils on the same day. In addition, all scans were repeated within three days for three volunteers who were randomly selected from all subjects. All ROIs of the IVDs and vertebral bodies were manually delineated in the middle sagittal slices. A radiologist conducted ROI-based measurements of T1, T2, and PD values from MAGiC and repeated the measurements two weeks later. SPSS 20.0 software was utilized to prove the consistency of measured values acquired with different coils; the reproducibility of quantitative values between scans, which was analyzed using the root-mean-square coefficient-of-variation (RMS CV%) from Gluer et al;7 and the measurement repeatability of the same observer was tested using the intra-class correlation coefficient (ICC).Results
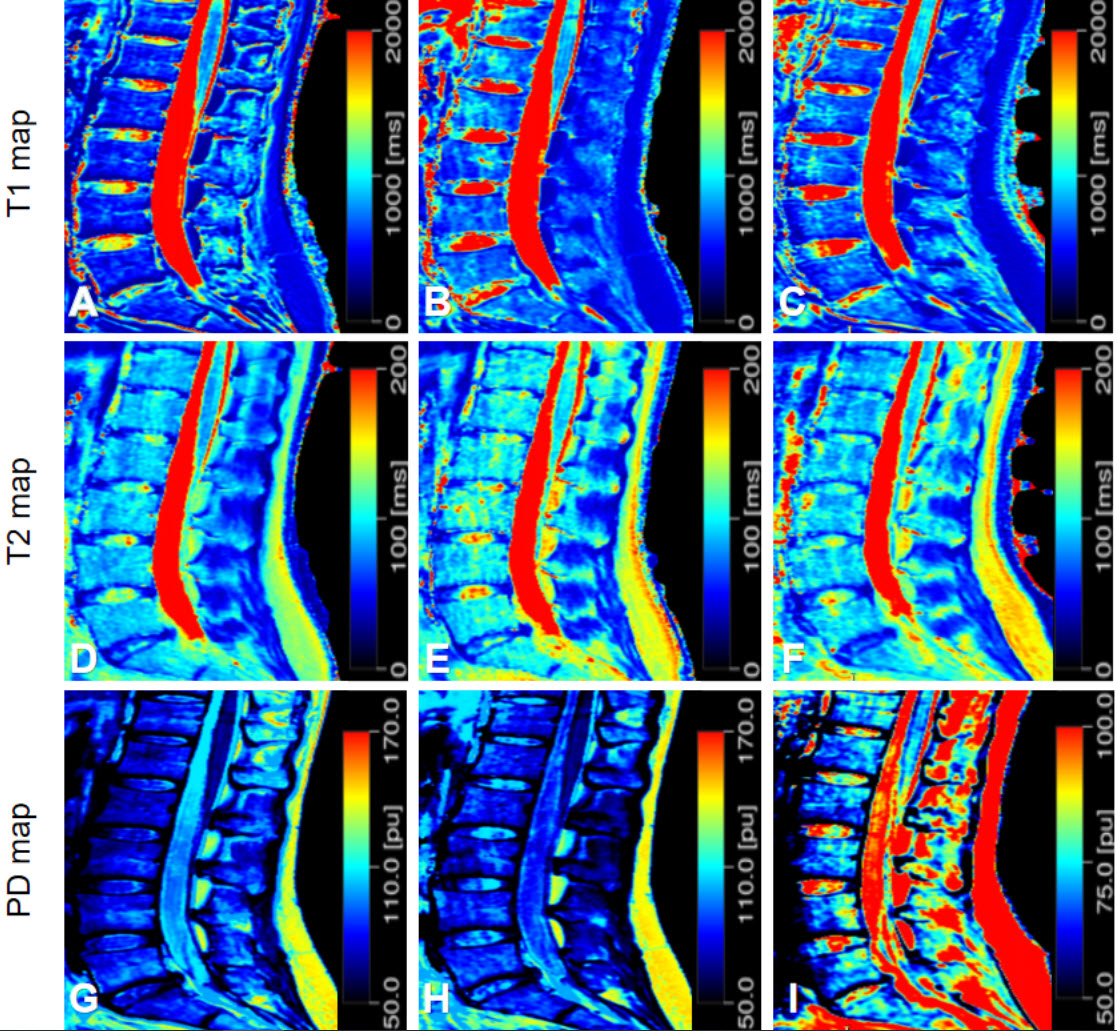
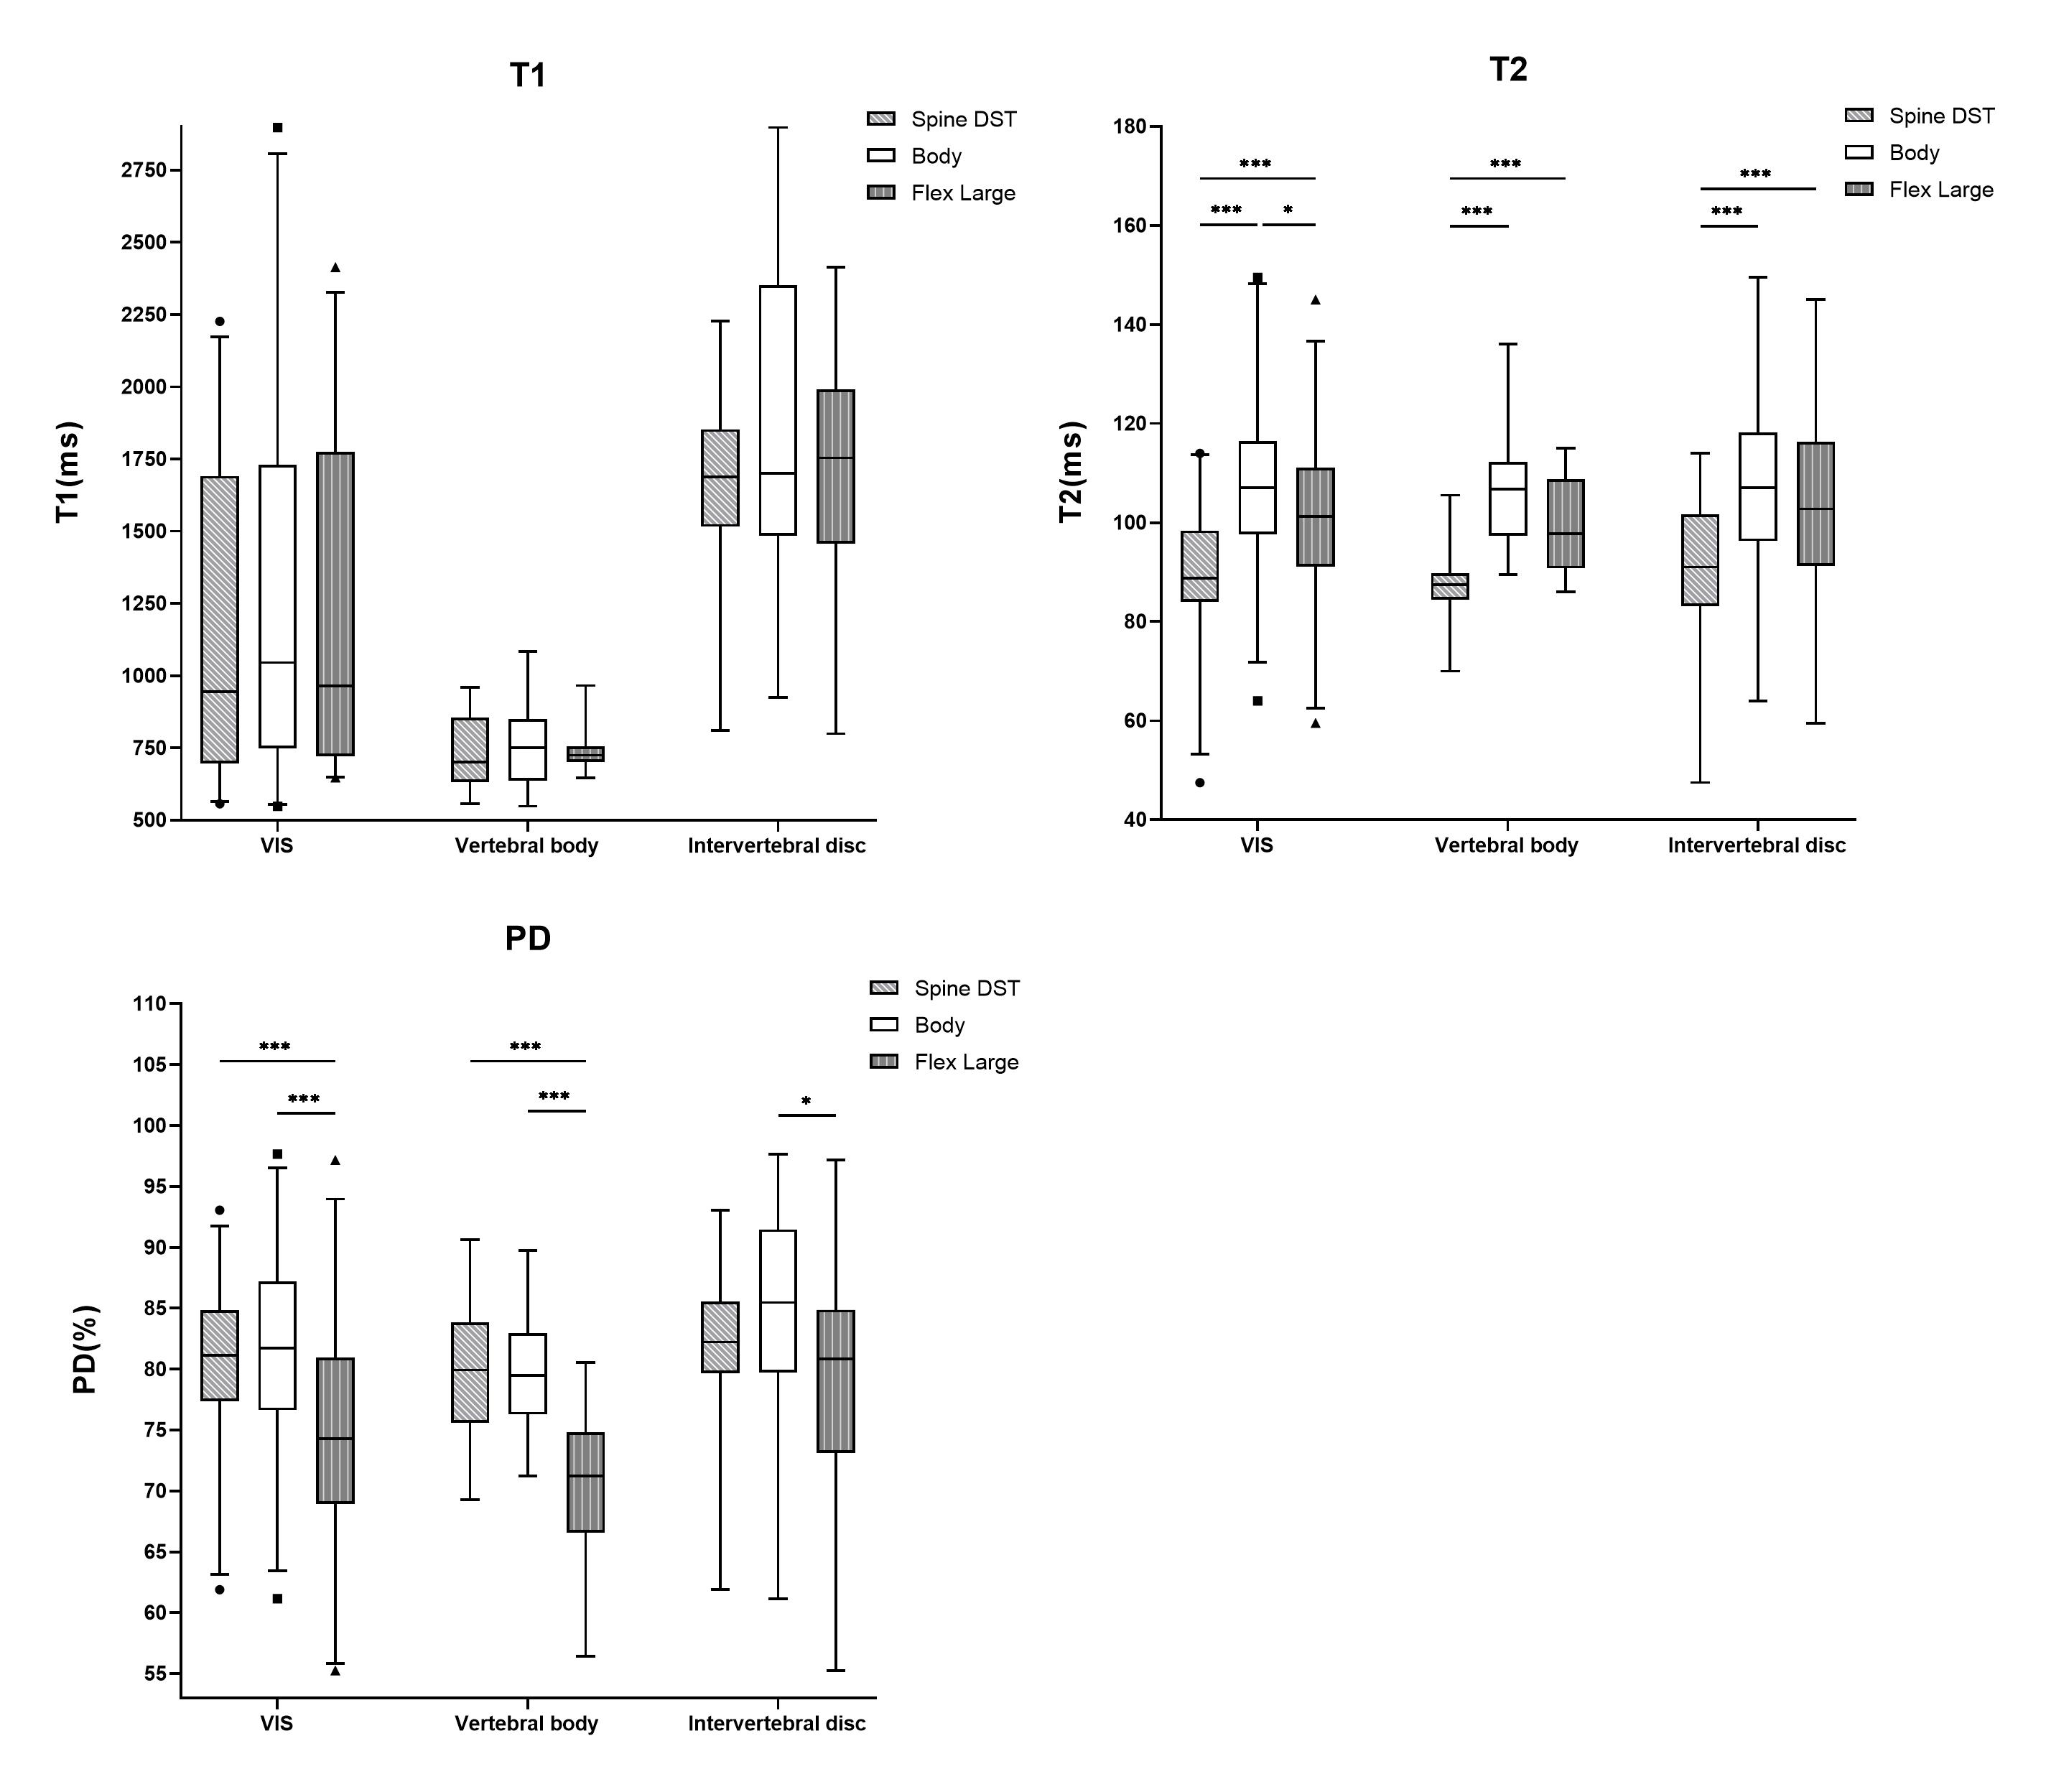
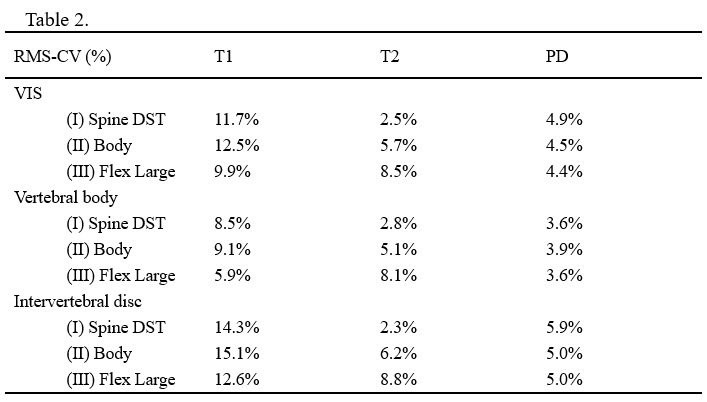
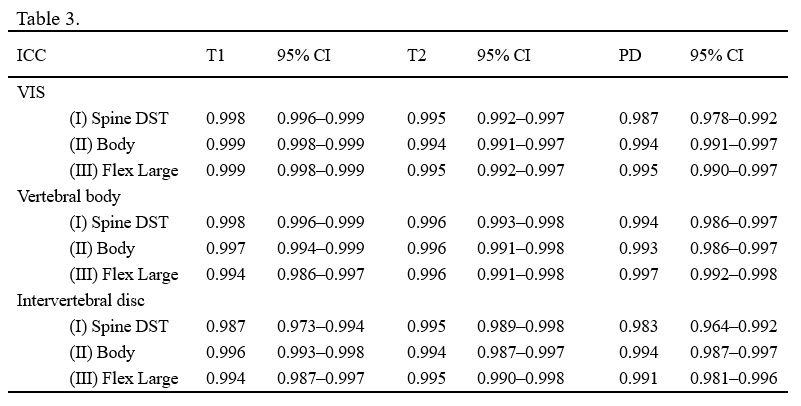
T1, T2, and PD maps obtained from MAGiC for different coils are shown in Figure 1.There was no statistically significant difference in T1 values between coils. Nevertheless, T2 values of vertebral bodies and IVDs between Spine DST and Body as well as between Spine DST and Flex Large were statistically different (p <0.001).When the vertebral bodies and IVDs were considered as a whole (here we named it as VIS) the T2 values measured by the three coils were statistically different from each other (p <0.001 for Spine DST and Body, also for Spine DST and Flex Large; p =0.024 for Body and Flex Large). PD values of IVDs acquired with Body were higher than those obtained with Flex Large (p =0.020). As for the PD values of the vertebral bodies and VIS, there were statistically significant differences between Spine DST and Flex Large as well as between Body and Flex Large (p <0.001). All these differences between different coils are illustrated in details in Figure 2. The T2 reproducibility of all quantitative relaxation parameters analyzed based on RMS-CV% values are summarized in Table 2.The measurement repeatability in Table 3 showed excellent repeatability for each coil.Discussion
Our observations for quantitative measurements of synthetic lumbar spine MRI revealed statistical differences of the T2 and PD values depending on the used coils. Every coil possesses different transmit performance. For example, the depth of penetration is governed by the number of coil elements; transmit uniformity depends on coil arrangement and electric loading controlled by subject weight.8 Therefore, coil usage plays a key role in signal collection, subsequently contributing to different results of relaxation time. As for clinical diagnosis and scientific research, the results could be affected by comparing the quantitative parameters acquired by the MAGiC sequence with different coils even if the choice of coil has no direct influence on the relaxation time as relaxation time is the inherent characteristic of tissue. In short, the differences of measurements caused by using different coils found in this study need attention in future research.The analysis of ICC reveals the high reliability of our measurements for each coil. As for the scan reproducibility assessed by RMS-CV%, different coils performed differently, especially on T2 and T1 relaxation time, and thus coil selection should be taken into consideration. Further studies with larger sample sizes are needed to validate the findings of this study. Furthermore, a standard protocol for lumbar spine synthetic MRI scanning including coil selection needs to be mentioned in order to ensure the comparability of data across studies.
Conclusion
Our results suggested that the quantitative relaxation parameters obtained by lumbar spine synthetic MRI could be influenced by the selected coil. Hence, it is necessary to use the same coil to assure data comparability, especially in longitudinal and multi-center studies.Acknowledgements
Thank for the support of the National Natural Science Foundation of China (NSFC) (No. 31630025 and 81930045).References
1. Warntjes J B, Leinhard O D, West J, et al. Rapid magnetic resonance quantification on the brain: Optimization for clinical usage. Magn Reson Med. 2008; 60(2): 320-9.
2. Jiang Y, Yu L, Luo X, et al. Quantitative synthetic MRI for evaluation of the lumbar intervertebral disk degeneration in patients with chronic low back pain. Eur J Radiol. 2020; 124: 108858.
3. Cui Y, Han S, Liu M, et al. Diagnosis and Grading of Prostate Cancer by Relaxation Maps From Synthetic MRI. J Magn Reson Imaging. 2020; 52(2): 552-564.
4. Pachowsky M L, Trattnig S, Apprich S, et al. Impact of different coils on biochemical T2 and T2* relaxation time mapping of articular patella cartilage. Skeletal Radiol. 2013; 42(11): 1565-72.
5. Chang G, Wiggins G C, Xia D, et al. Comparison of a 28-channel receive array coil and quadrature volume coil for morphologic imaging and T2 mapping of knee cartilage at 7T. J Magn Reson Imaging. 2012; 35(2): 441-8.
6. Zhang W, Zhu J, Xu X, et al. Synthetic MRI of the lumbar spine at 3.0 T: feasibility and image quality comparison with conventional MRI. Acta Radiol. 2020; 61(4): 461-470.
7. Glüer C C, Blake G, Lu Y, et al. Accurate assessment of precision errors: how to measure the reproducibility of bone densitometry techniques. Osteoporos Int. 1995; 5(4): 262-70.
8. Li X, Pedoia V, Kumar D, et al. Cartilage T1ρ and T2 relaxation times: longitudinal reproducibility and variations using different coils, MR systems and sites. Osteoarthritis Cartilage. 2015; 23(12): 2214-2223.
Figures