3321
Pseudo-T2 mapping of T2-weighted MRI of the prostate: Comparison to gold standard1Department of Circulation and Medical Imaging, Norwegian University of Science and Technology, Trondheim, Norway, 2Department of Physics, Norwegian University of Science and Technology, Trondheim, Norway, 3Department of Radiology and Nuclear Medicine, St. Olavs University Hospital, Trondheim, Norway
Synopsis
Quantitative analysis of T2-weighted (T2W) MR images is hindered by the lack of signal intensity standardization. The tissue T2 values are independent of variations in scanner parameters, but T2 mapping is normally not part of the clinical pathway. Autoref is an automated dual-reference tissue normalization of T2W images developed in our group, aiming to reproduce the prostate T2 values. In this study we measured the prostate T2 value in seven healthy volunteers, and compared them with pseudo-T2 values from Autoref normalized T2W. The Autoref was proven to reproduce prostate T2 values as well as contrast within the prostate zones.
Introduction
The signal intensity (SI) in T2-weighted (T2W) MRI does not carry physical meaning, as variations in scanner parameters such as field strength, coil type, signal amplification and acquisition protocols provide irreproducible SI.1 Quantitative T2 mapping of the prostate has shown high reproducibility, 2,3 and the quantitative T2 values are shown to vary significantly between prostate cancer and normal gland tissue. 3,4 T2 mapping is, however, not included in the standardized clinical pathway following the Prostate Imaging–Reporting and Data System (PI-RADS).5 Autoref is an automated method for prostate T2W image normalization using dual-reference tissue recently developed in our group, where the normalized images produced are reflecting the tissue T2 values.6 The aim of this study was to evaluate the accuracy of the Autoref pseudo-T2 values in the prostate. The prostate T2 relaxation time was measured in seven healthy volunteers by using a multi-echo spin echo sequence. The ability of Autoref to reproduce these values was tested by applying the normalization method on T2W images acquired for the same volunteers. The performance of Autoref for three pairs of reference tissues was tested.Methods
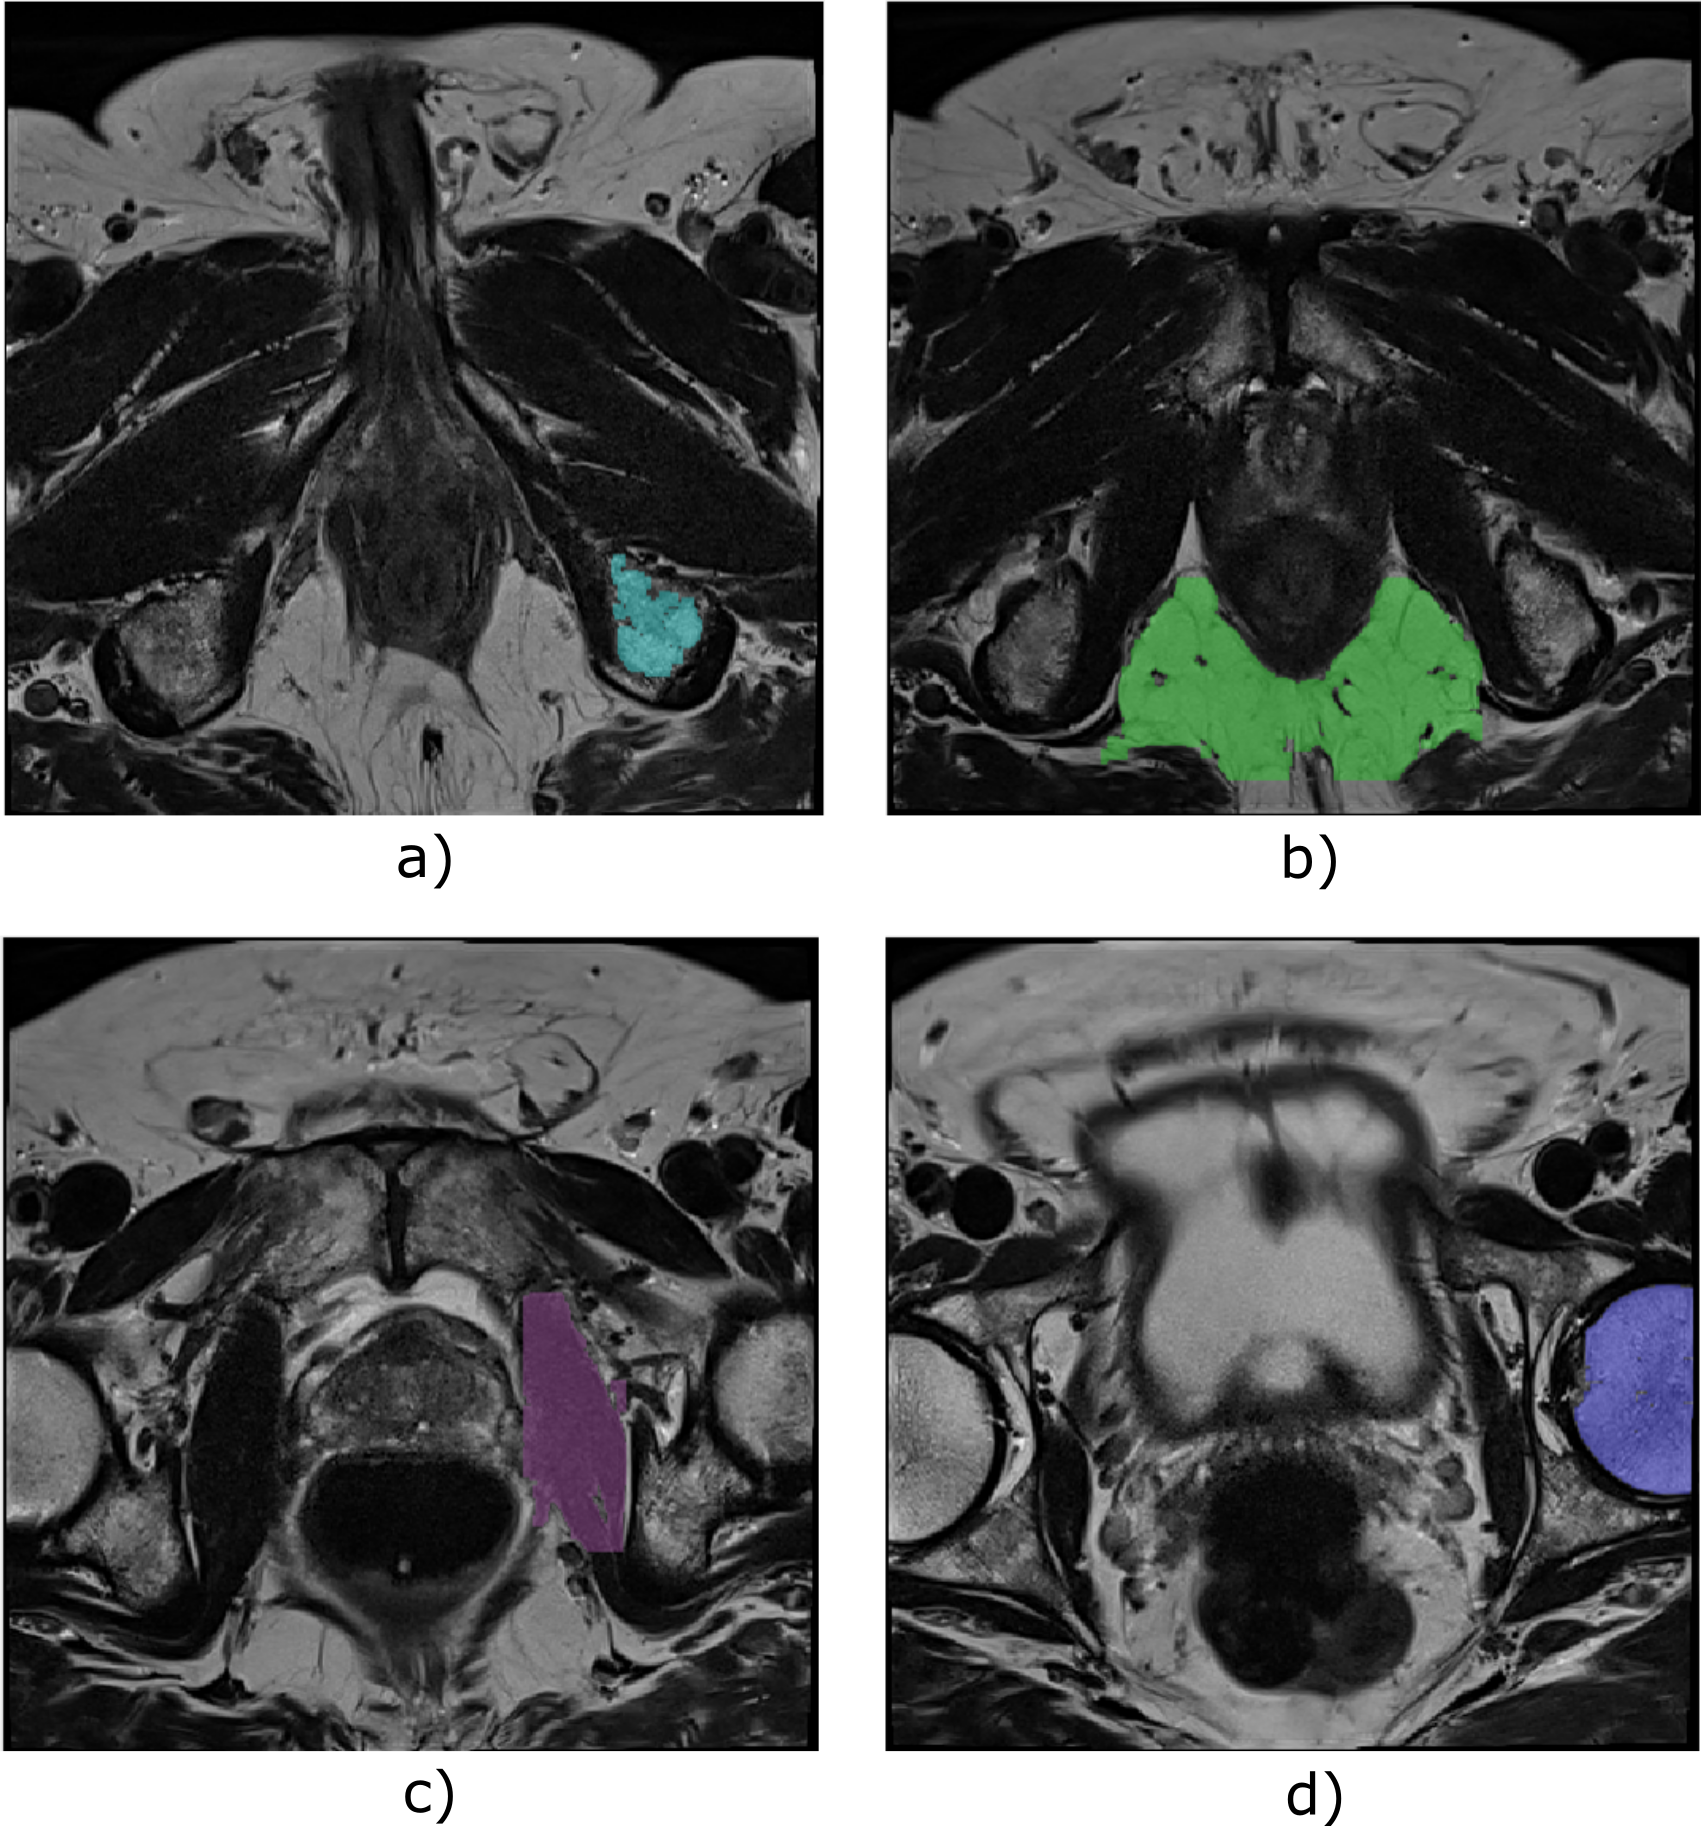
In Autoref, aggregate channel features object detectors (acfObjectDetector, Matlab R2019b) are trained to detect reference regions of interest (ROI), that are further processed by extracting the largest connected regions in these areas. By mapping the 90th percentile of the higher intensity ROI and 10th percentile of the lower intensity ROI to their corresponding tissue T2 values, the entire 3D T2W image is linearly scaled – creating a pseudo-T2 map.6 In this work, the object detector was trained on manually drawn rectangles around reference tissues on 79 cases from PROMISE 12 (n = 39, all endorectal coil cases excluded), 7 Prostate X (n = 20),8 and an in-house dataset (n = 20). The in-house dataset was selected from a cohort of patients examined at St. Olavs University Hospital, Trondheim, Norway between March 2015 and December 2018 due to suspicion of prostate cancer. MRI was performed on a Magnetom Skyra 3 T MRI system (Siemens Healthineers, Erlangen, Germany) with T2W images from a turbo spin-echo sequence.T2 relaxation times in the reference tissues were measured in eight healthy volunteers (median age 28.5, range 26 to 65 years) using a multi-echo spin echo (MESE) imaging sequence on the same MRI system. 17 echoes were acquired with echo times (TE) ranging from 10.6 ms to 180.2 ms, but only the first five even TE were included in analysis due to signal contamination generated in the MESE sequence.9 ROIs were manually drawn within the obturator internus muscle, ischial tuberosity (pelvic bone), fat and the yellow bone marrow in the femoral head. A mono-exponential fit of the change in mean ROI intensities with increasing TE provided estimates of the tissue T2 values. For seven of the healthy volunteers, the whole prostate gland (WP), peripheral zone (PZ) and remaining zones (transitional zone (TZ), central zone (CZ) and anterior fibromuscular stroma (AFS)) were manually segmented on the T2W images by a radiology resident (E.S.) using ITK-SNAP. 10 The segmentations were registered to the images acquired by MESE, and the Autoref prostate pseudo-T2 values were compared with the MESE calculated T2 values in the same region. In Autoref, muscle was always used as the low intensity ROI, but the high intensity ROI varied between fat, femoral head and pelvic bone.
The paired Wilcoxon signed-rank test was used to compare the pseudo-T2 values to the MESE T2 values. P-values less than 0.05 were considered statically significant.
Results
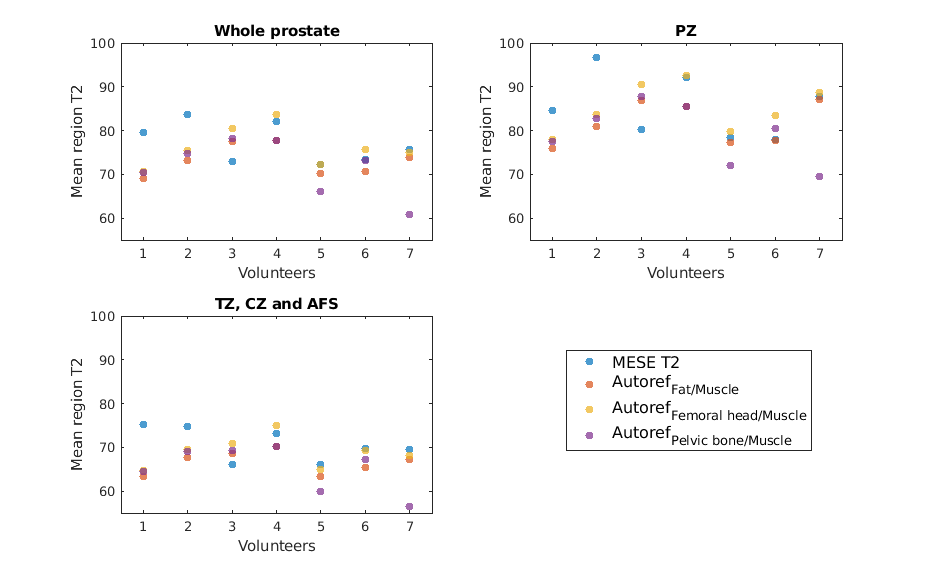
The MESE reference tissue T2 values, averaged over eight volunteers, were 137.0 ± 2.7 ms for femoral head, 37.4 ± 0.9 ms for muscle, 98.7 ± 7.6 ms for pelvic bone and 129.7 ± 1.9 ms for fat. A set of reference ROIs detected by the object detectors for one volunteer is shown in Figure 1. Table 1 shows the mean prostate MESE T2 and pseudo-T2 values from seven volunteers, and Figure 2 shows all the individual observations. The resulting p-values from the paired Wilcoxon signed-rank test are found in Table 2.Discussion
The MESE T2 value in the prostate, as well as the contrast between the peripheral and remaining prostate zones was reproduced with Autoref normalization with femoral head as high intensity ROI. Autoref with fat as high intensity ROI overall provided contrast similar to the MESE T2 between zones, but the statistical test indicated a difference to the MESE T2 in TZ, CZ and AFS. The statistical test indicated that the MESE T2 values were reproduced with pelvic bone as high intensity ROI, but the mean pseudo-T2 values were overall lower than the MESE T2 values.Multi-echo sequences have shown considerable inaccuracy in the estimation of T2,11 but the prostate T2 values found in this study were similar to what others have reported.12,13 The young study population in this work could, however, have led to a biased prostate T2 value. Consequently, confirmation of these results to a clinical cohort would be the next necessary step.
Conclusion
Normalization of T2W using Autoref could reproduce prostate T2 values as well as contrast within the prostate zones, but a further confirmation in a clinical cohort is necessary.Acknowledgements
No acknowledgement found.References
[1] Schieda N, Lim CS, Zabihollahy F, Abreu‐Gomez J, Krishna S, Woo S, Melkus G, Ukwatta E, Turkbey B. Quantitative Prostate MRI. Journal of Magnetic Resonance Imaging. 2020 May 15.
[2] Liu W, Turkbey B, Sénégas J, Remmele S, Xu S, Kruecker J, Bernardo M, Wood BJ, Pinto PA, Choyke PL. Accelerated T2 mapping for characterization of prostate cancer. Magnetic resonance in medicine. 2011 May;65(5):1400-6.
[3] Dinh AH, Souchon R, Melodelima C, Bratan F, Mège-Lechevallier F, Colombel M, Rouvière O. Characterization of prostate cancer using T2 mapping at 3 T: a multi-scanner study. Diagnostic and interventional imaging. 2015 Apr 1;96(4):365-72.
[4] Mai J, Abubrig M, Lehmann T, Hilbert T, Weiland E, Grimm MO, Teichgräber U, Franiel T. T2 mapping in prostate cancer. Investigative radiology. 2019 Mar 1;54(3):146-52.
[5] Weinreb JC, Barentsz JO, Choyke PL, Cornud F, Haider MA, Macura KJ, Margolis D, Schnall MD, Shtern F, Tempany CM, Thoeny HC. PI-RADS prostate imaging–reporting and data system: 2015, version 2. European urology. 2016 Jan 1;69(1):16-40.
[6] Sunoqrot MR, Nketiah GA, Selnæs KM, Bathen TF, Elschot M. Automated reference tissue normalization of T2-weighted MR images of the prostate using object recognition. Magnetic Resonance Materials in Physics, Biology and Medicine. 2020 Jul 31:1-3.
[7] Litjens G, Toth R, van de Ven W, Hoeks C, Kerkstra S, van Ginneken B, Vincent G, Guillard G, Birbeck N, Zhang J, Strand R. Evaluation of prostate segmentation algorithms for MRI: the PROMISE12 challenge. Medical image analysis. 2014 Feb 1;18(2):359-73.
[8] Armato SG, Huisman H, Drukker K, Hadjiiski L, Kirby JS, Petrick N, Redmond G, Giger ML, Cha K, Mamonov A, Kalpathy-Cramer J. PROSTATEx Challenges for computerized classification of prostate lesions from multiparametric magnetic resonance images. Journal of Medical Imaging. 2018 Nov;5(4):044501.
[9] Ben‐Eliezer N, Sodickson DK, Block KT. Rapid and accurate T2 mapping from multi–spin‐echo data using Bloch‐simulation‐based reconstruction. Magnetic resonance in medicine. 2015 Feb;73(2):809-17.
[10] Yushkevich PA, Piven J, Hazlett HC, Smith RG, Ho S, Gee JC, Gerig G. User-guided 3D active contour segmentation of anatomical structures: significantly improved efficiency and reliability. Neuroimage. 2006 Jul 1;31(3):1116-28.
[11] Liney GP, Knowles AJ, Manton DJ, Turnbull LW, Blackband SJ, Horsman A. Comparison of conventional single echo and multi‐echo sequences with a fast spin‐echo sequence for quantitative T2 mapping: application to the prostate. Journal of Magnetic Resonance Imaging. 1996 Jul;6(4):603-7.
[12] Bojorquez JZ, Bricq S, Brunotte F, Walker PM, Lalande A. A novel alternative to classify tissues from T 1 and T 2 relaxation times for prostate MRI. Magnetic Resonance Materials in Physics, Biology and Medicine. 2016 Oct 1;29(5):777-88.
[13] De Bazelaire CM, Duhamel GD, Rofsky NM, Alsop DC. MR imaging relaxation times of abdominal and pelvic tissues measured in vivo at 3.0 T: preliminary results. Radiology. 2004 Mar;230(3):652-9.
Figures