3320
Towards in-vivo myeloarchitecture: optimising T1 maps point spread function by very high resolution multi-shot inversion-recovery EPI
Fabrizio Fasano1,2, John Evans3, Chloe Benson4, Yifei Wang4, Derek K Jones3,5, Alison Paul4, and Robert Turner6,7
1Siemens Healthcare Ltd, Camberly, United Kingdom, 2Siemens Healthcare GmbH, Erlangen, Germany, 3Cardiff University Brain Research Imaging Centre (CUBRIC), Cardiff University, Cardiff, United Kingdom, 4School of Chemistry, Cardiff University, Cardiff, United Kingdom, 5Mary McKillop Institute for Health Research, Faculty of Health Sciences, Australian Catholic University, Melbourne, Australia, 6Department of Neurophysics, Max Planck Institute for Human Cognitive and Brain Sciences, Leipzig, Germany, 7Sir Peter Mansfield Imaging Centre, University of Nottingham, Nottingham, United Kingdom
1Siemens Healthcare Ltd, Camberly, United Kingdom, 2Siemens Healthcare GmbH, Erlangen, Germany, 3Cardiff University Brain Research Imaging Centre (CUBRIC), Cardiff University, Cardiff, United Kingdom, 4School of Chemistry, Cardiff University, Cardiff, United Kingdom, 5Mary McKillop Institute for Health Research, Faculty of Health Sciences, Australian Catholic University, Melbourne, Australia, 6Department of Neurophysics, Max Planck Institute for Human Cognitive and Brain Sciences, Leipzig, Germany, 7Sir Peter Mansfield Imaging Centre, University of Nottingham, Nottingham, United Kingdom
Synopsis
Myeloarchitecture has a critical role in the specialisation of brain microcircuitry. It shapes network functions from small to large scale, and ultimately behaviour. We tested, on homemade Agar gel phantoms, the multi-shot inversion recovery slice shuffled EPI IR-MS-EPI approach recently proposed by Sanchez and co-workers (Proc. Intl. Soc. Mag. Reson. Med. 2018, 60). Our measurement results and the simulated performances of MS-IR-EPI showed a good reproducibility of the T1 maps and a preserved quality of its point spread function, when acquiring at higher-than 500μm in-plane resolution, making it suitable for assessing grey matter myelination process.
Introduction
Myeloarchitecture has a critical role in the specialisation of brain microcircuitry. It shapes network functions from small to large scale, and ultimately behaviour [1]. State-of-the-art MRI can potentially allow direct observation of the bootstrapped development of patterned myelination in the cortex [1]. Recently, Sanchez and co-workers proposed to identify specific myeloarchitecture by mapping T1, by means of slice-shuffled interleaved multi-shot inversion recovery EPI (MS-IR-EPI) at 7T [2,3]. At sufficient spatial resolution (better than 500μm), this approach has some advantages when compared with other commonly-used T1 mapping methods (e.g. MP2RAGE [4]). Use of EPI for T1 quantification is reliable and is often used as a gold standard [4], it can minimise the effect of T1 relaxation on the point spread function (PSF) [5], and its SNR per acquisition time can exceed that of many other techniques. In the readout direction, PSF is only significantly affected by k-space truncation and discrete sampling. In the phase-encode direction, however, relaxation effects are not negligible. In IR-EPI, transverse relaxation occurring during the echo train can cause some broadening of PSF. This effect can be minimised by using more EPI segments, at the expense of total acquisition time. Effects due to T1 relaxation, occurring only through radiation damping [6], can be neglected. By contrast, when very high spatial resolution is required for MP2RAGE, the k-space sampling in the second phase-encode direction (phase2) takes place during a significant proportion of the inversion recovery curve, and T1 relaxation can significantly affect the PSF. In the current investigation, we explored the reproducibility of MS-IR-EPI T1 maps. Using homemade phantoms, we also estimated and tested the quality of the PSF for both MS-IR-EPI and MP2RAGE T1 maps.Methods
Phantoms were created by filling 15ml FalconTM tubes with different concentrations of agar/agarose gel and CuSO4 or MnCl2 (Sigma Aldrich), in deionised water. Acquisitions were performed on a whole-body 7T research MR-system (Siemens Healthcare GmbH, Erlangen, Germany) equipped with a 32-channel head receive/volume transmit coil (Nova Medical). A prototype MS-IR-EPI [3], a Turbo Spin Echo (TSE) and an MP2RAGE were used (see Fig.1). Post-processing computations were performed under Jupyter Lab and MATLAB R2014b on a Mac Pro running OSX 10.11. MS-IR-EPI T1 maps for six phantoms were computed voxelwise by fitting the IR relaxation equation to the data acquired with 16 equally spaced inversion times(see Fig.2a). T1 values were averaged on manually drawn ROIs. Reproducibility was assessed by computing the mean value and standard deviation (StDev) across 8 repetitions. One phantom (#14) was formed by filling the vial with two different gel compositions, separated by a thin transition layer (see Fig.2). A TSE image with 100µm in-plane resolution was acquired on this phantom to depict the boundary profile (Fig.2b). MS-IR-EPI and MP2RAGE profiles across the gel boundary for this phantom were measured on four transects of the boundary near the centre of the phantom. We estimated the theoretically expected image profiles for the phase2-across-gap MP2RAGE and phase-across-gap MS-IR-EPI protocols, by calculating analytically the optical transfer function (OTF) in the presence of transverse and longitudinal relaxation. A discrete Fourier Transform of this OTF, which involves the k-space truncation and sampling effects, was used to determine the PSF. The PSF was convolved with a step function representing the gel boundary in phantom #14, to provide an estimate of the MRI signal profile across the gel boundaryResults
The reproducibility of the T1 map is shown in Fig.2a. Fig.2b shows the gel transition boundary profile of phantom #14 determined by high-resolution TSE. Fig.3 shows the measured T1 map profiles of phantom #14. Fig.4 shows theoretical estimates of the OTF and PSF for data acquired with the phase-encode direction across the boundary. Fig.5 shows the modelled effects of low flip-angle 6/8 partial Fourier pulse trains on the longitudinal relaxation after an inversion pulse. Our simulations clearly show the expected narrow PSF of MS-IR-EPI PSF. The MP2RAGE data shown in Fig.3 confirm the expected improved sharpness for a readout direction across the gel boundary, as compared with 6/8-partial-Fourier-phase direction across the boundary.Discussion
For very high-resolution T1 mapping (better than 500µm) using sequences with inversion pulses and long trains of low flip-angle acquisitions, T1 relaxation can impair the PSF. In MP2RAGE, for instance, although the longitudinal relaxation is only weakly affected by the low flip-angle RF pulses, (see Fig.5a), the relaxation effect on PSF cannot be ignored (see Fig.5b) and shows up in the poor visibility with MP2RAGE of cortical layers of myelin. Attempts to minimize this effect with partially parallel or partial Fourier acquisition unfavourably reduces the already critical SNR per unit time. By contrast, high-resolution MS-IR-EPI provides an optimally narrow PSF when the acquisition time and echo train length are appropriately set. Importantly, the flexibility of the MS-IR-EPI approach allows margins of improvement, affecting only the acquisition time, that is unavailable for other approaches.Conclusion
The recently proposed MS-IR-EPI based approach to map myelin patterns in the GM shows good reproducibility when tested on homemade phantoms and appears suitable to improve the mapping of grey matter myelination at the nominal (desired) acquisition resolution, thanks to the preserved quality of its PSF at resolutions better than 500µm.Acknowledgements
No acknowledgement found.References
- Turner R “Myelin and Modeling: Bootstrapping Cortical Microcircuits” Front. In Neural Circuits 13, 34:1-11 (2019).
- Ordidge RJ et al. High‐speed multislice T1 mapping using inversion‐recovery echo‐planar imaging. Magnet Reson Med 16, 238–245 (1990).
- Sanchez RP et al. “A 2D multi-shot inversion recovery EPI (MS-IR-EPI) sequence for high spatial resolution T1-mapping at 7T” Proc. Intl. Soc. Mag. Reson. Med. 26 (2018), 60.
- Marques JP et al. “MP2RAGE, a self bias-field corrected sequence for improved segmentation and T1-mapping at high field”. Neuroimage 49, 1271–1281 (2010).
- Rossman K. “point Spread-Function, Line Spread-Function, and Modulation Transfer Function” Radiology 93: 257-282 (1969).
- Guo J & Mao X “Longitudinal-relaxation effects on transverse magnetization and the nuclear-magnetic-resonance line shape”. Phys Rev B 50, 13461–13466 (1994).
- Howseman AM. et al. “Improvements in snap-shot nuclear magnetic resonance imaging”. Br J Radiology 61, 822–828 (1988).
Figures
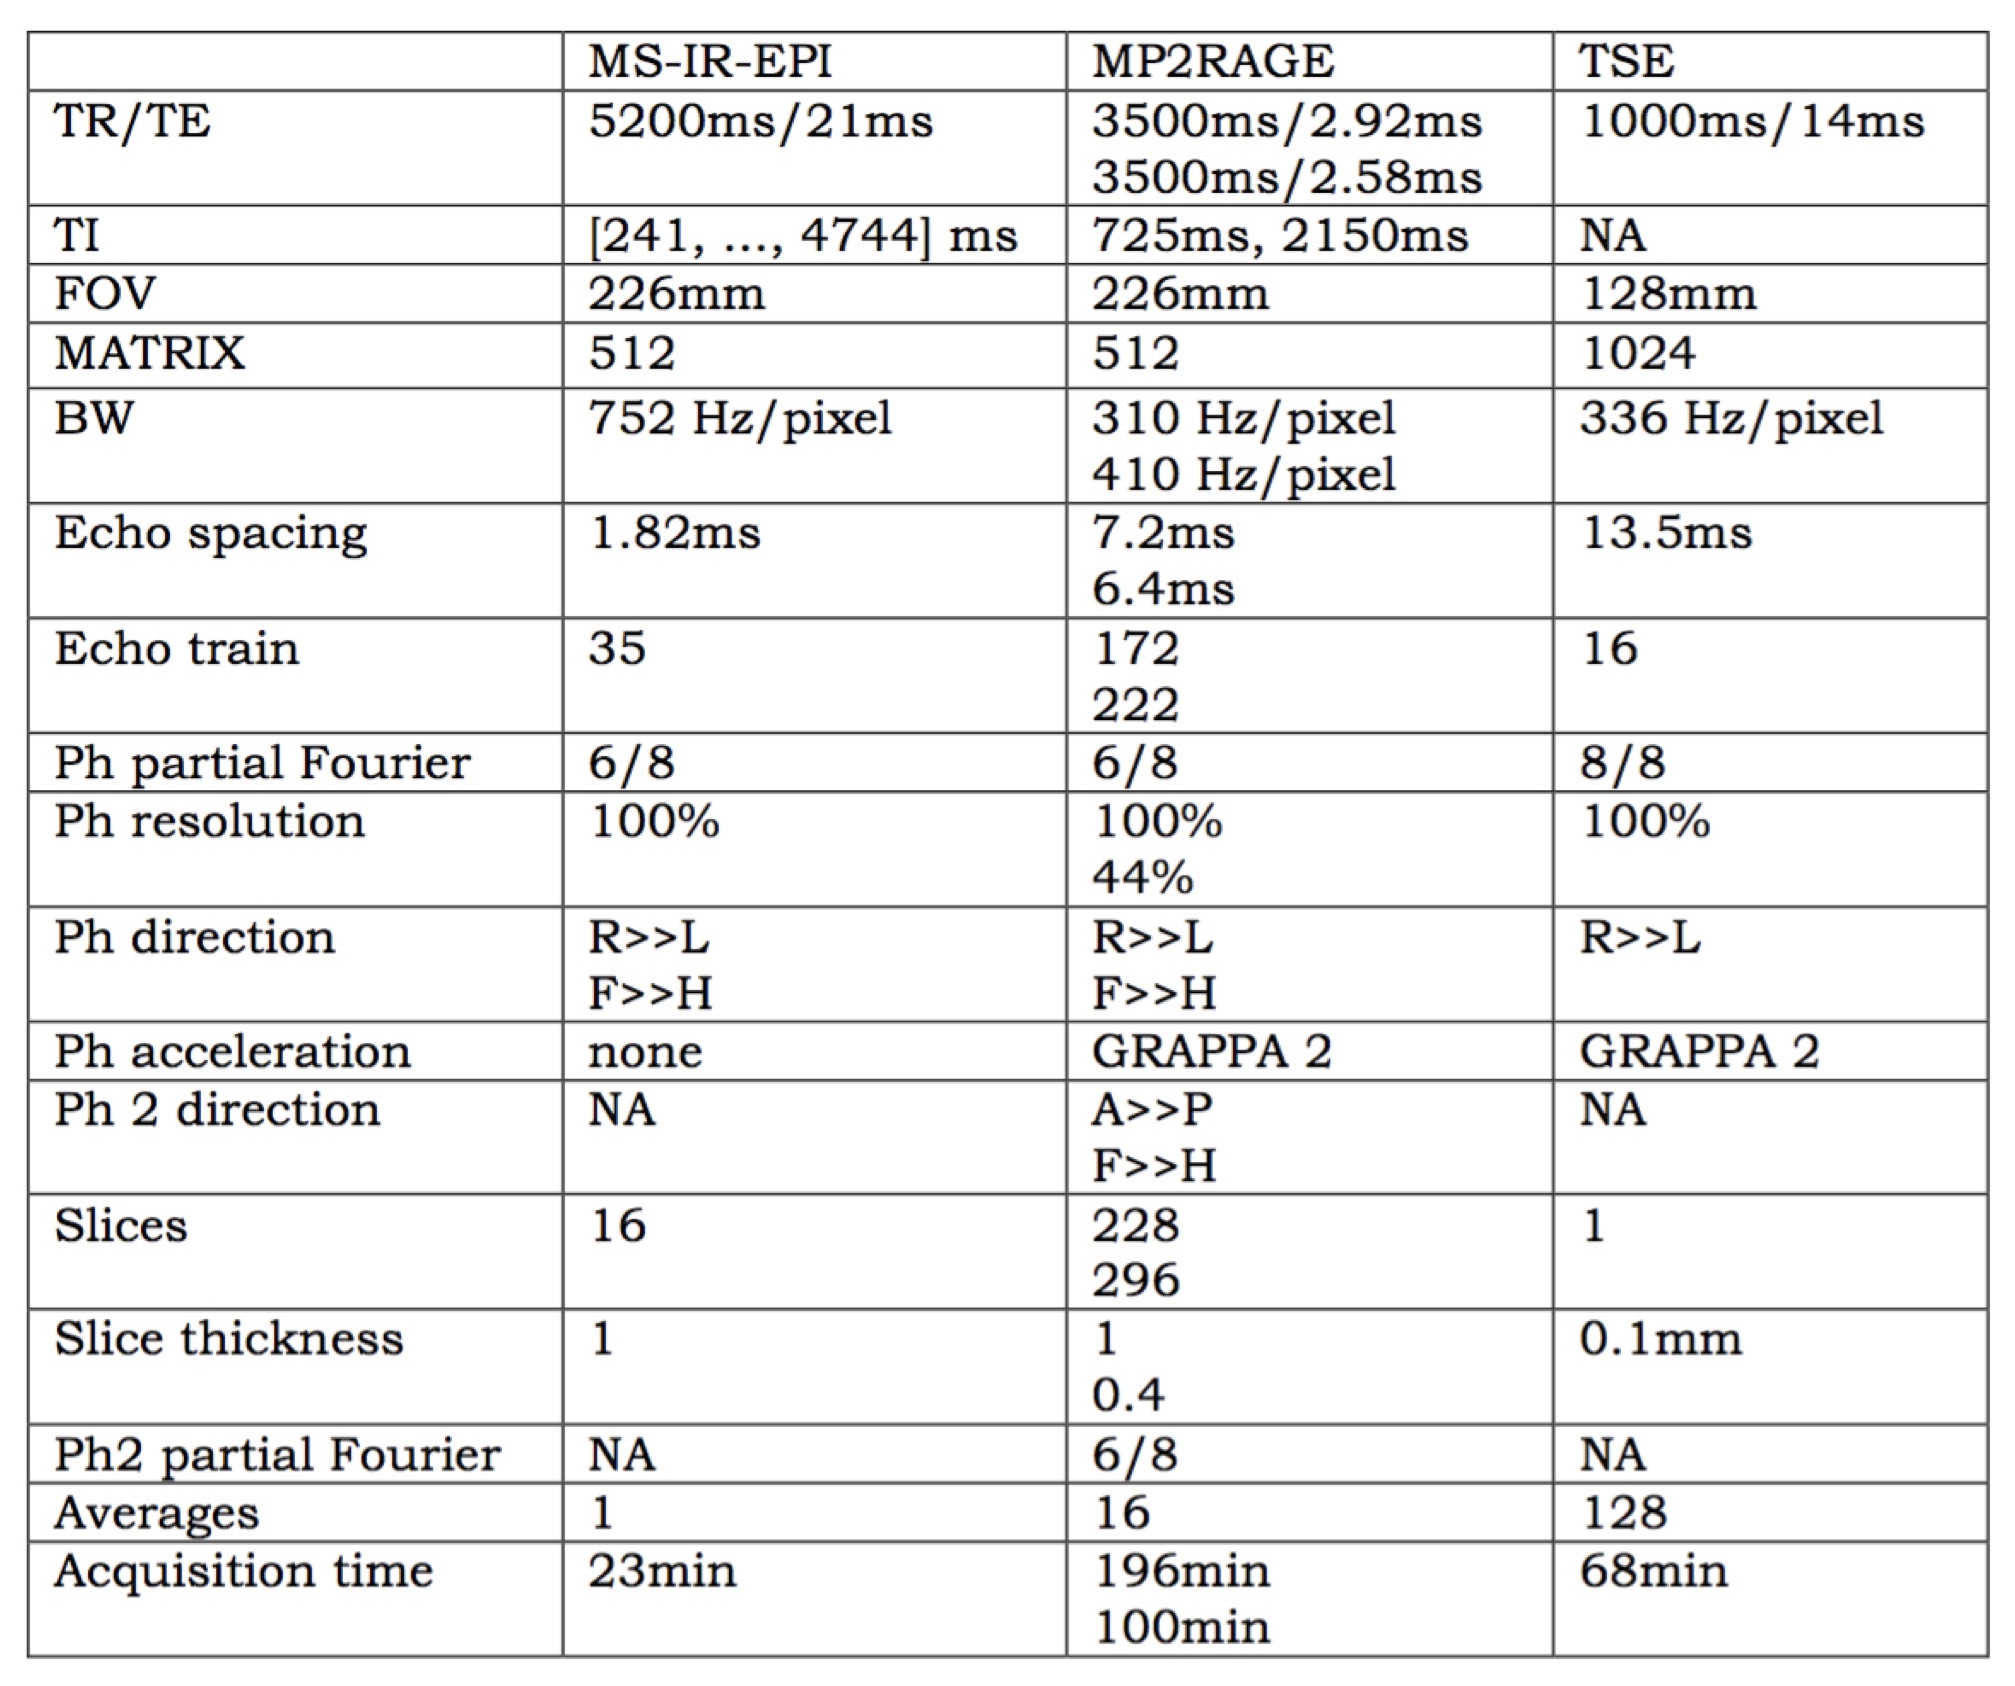
Fig.1. Sequence protocols. Sixteen equally spaced TI values were used for MS-IR-EPI. The values in paired rows refer to readout-across-phase (top) and phase-across-gap (bottom) measurements
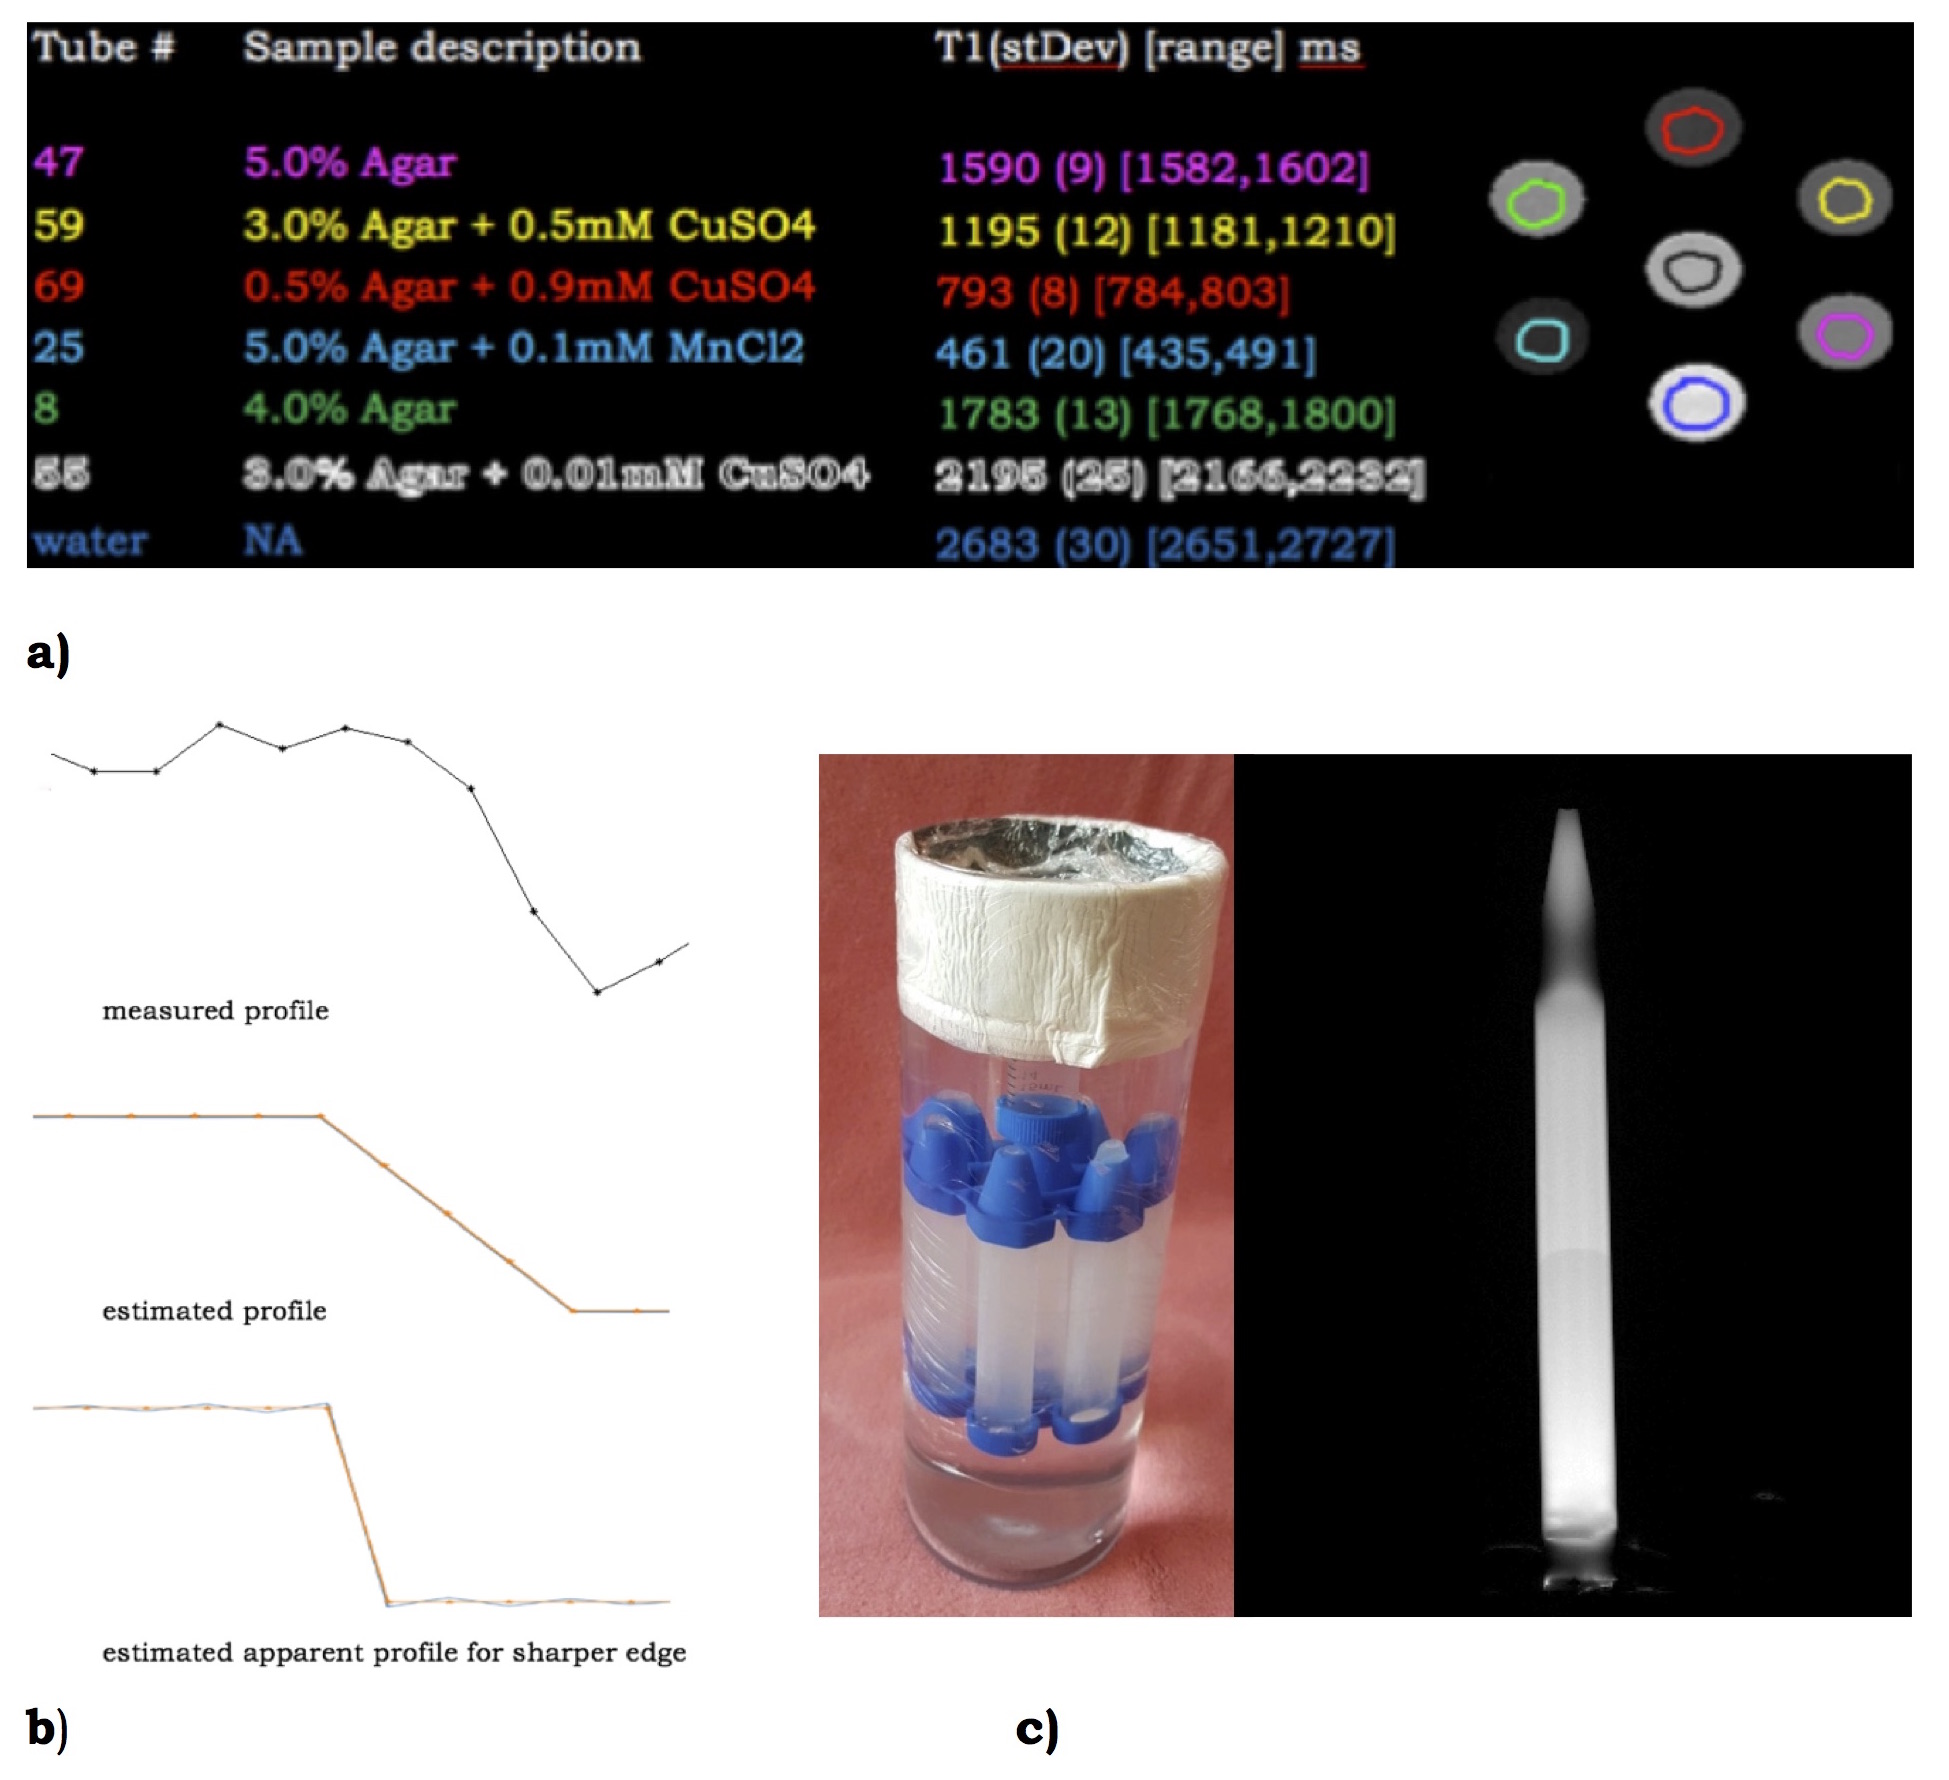
Fig.2. a) Six phantoms composition and T1 reproducibility; b) 4 lines averaged measured (top) and expected (middle) phantom #14 transition gap profiles by means of the 100µm in-plane resolution TSE. The ~400µm transition gap is the true object one, and not an effect of PSF, as shown by simulating a sharper transition gap (bottom). c) phantoms holder and phantom #14 TSE image. Phantom #14 composition: 0.5% agar + 0.1mMCuSO4 and 0.5% agar + 0.5mMCuSO4, providing about 100ms T1 difference.
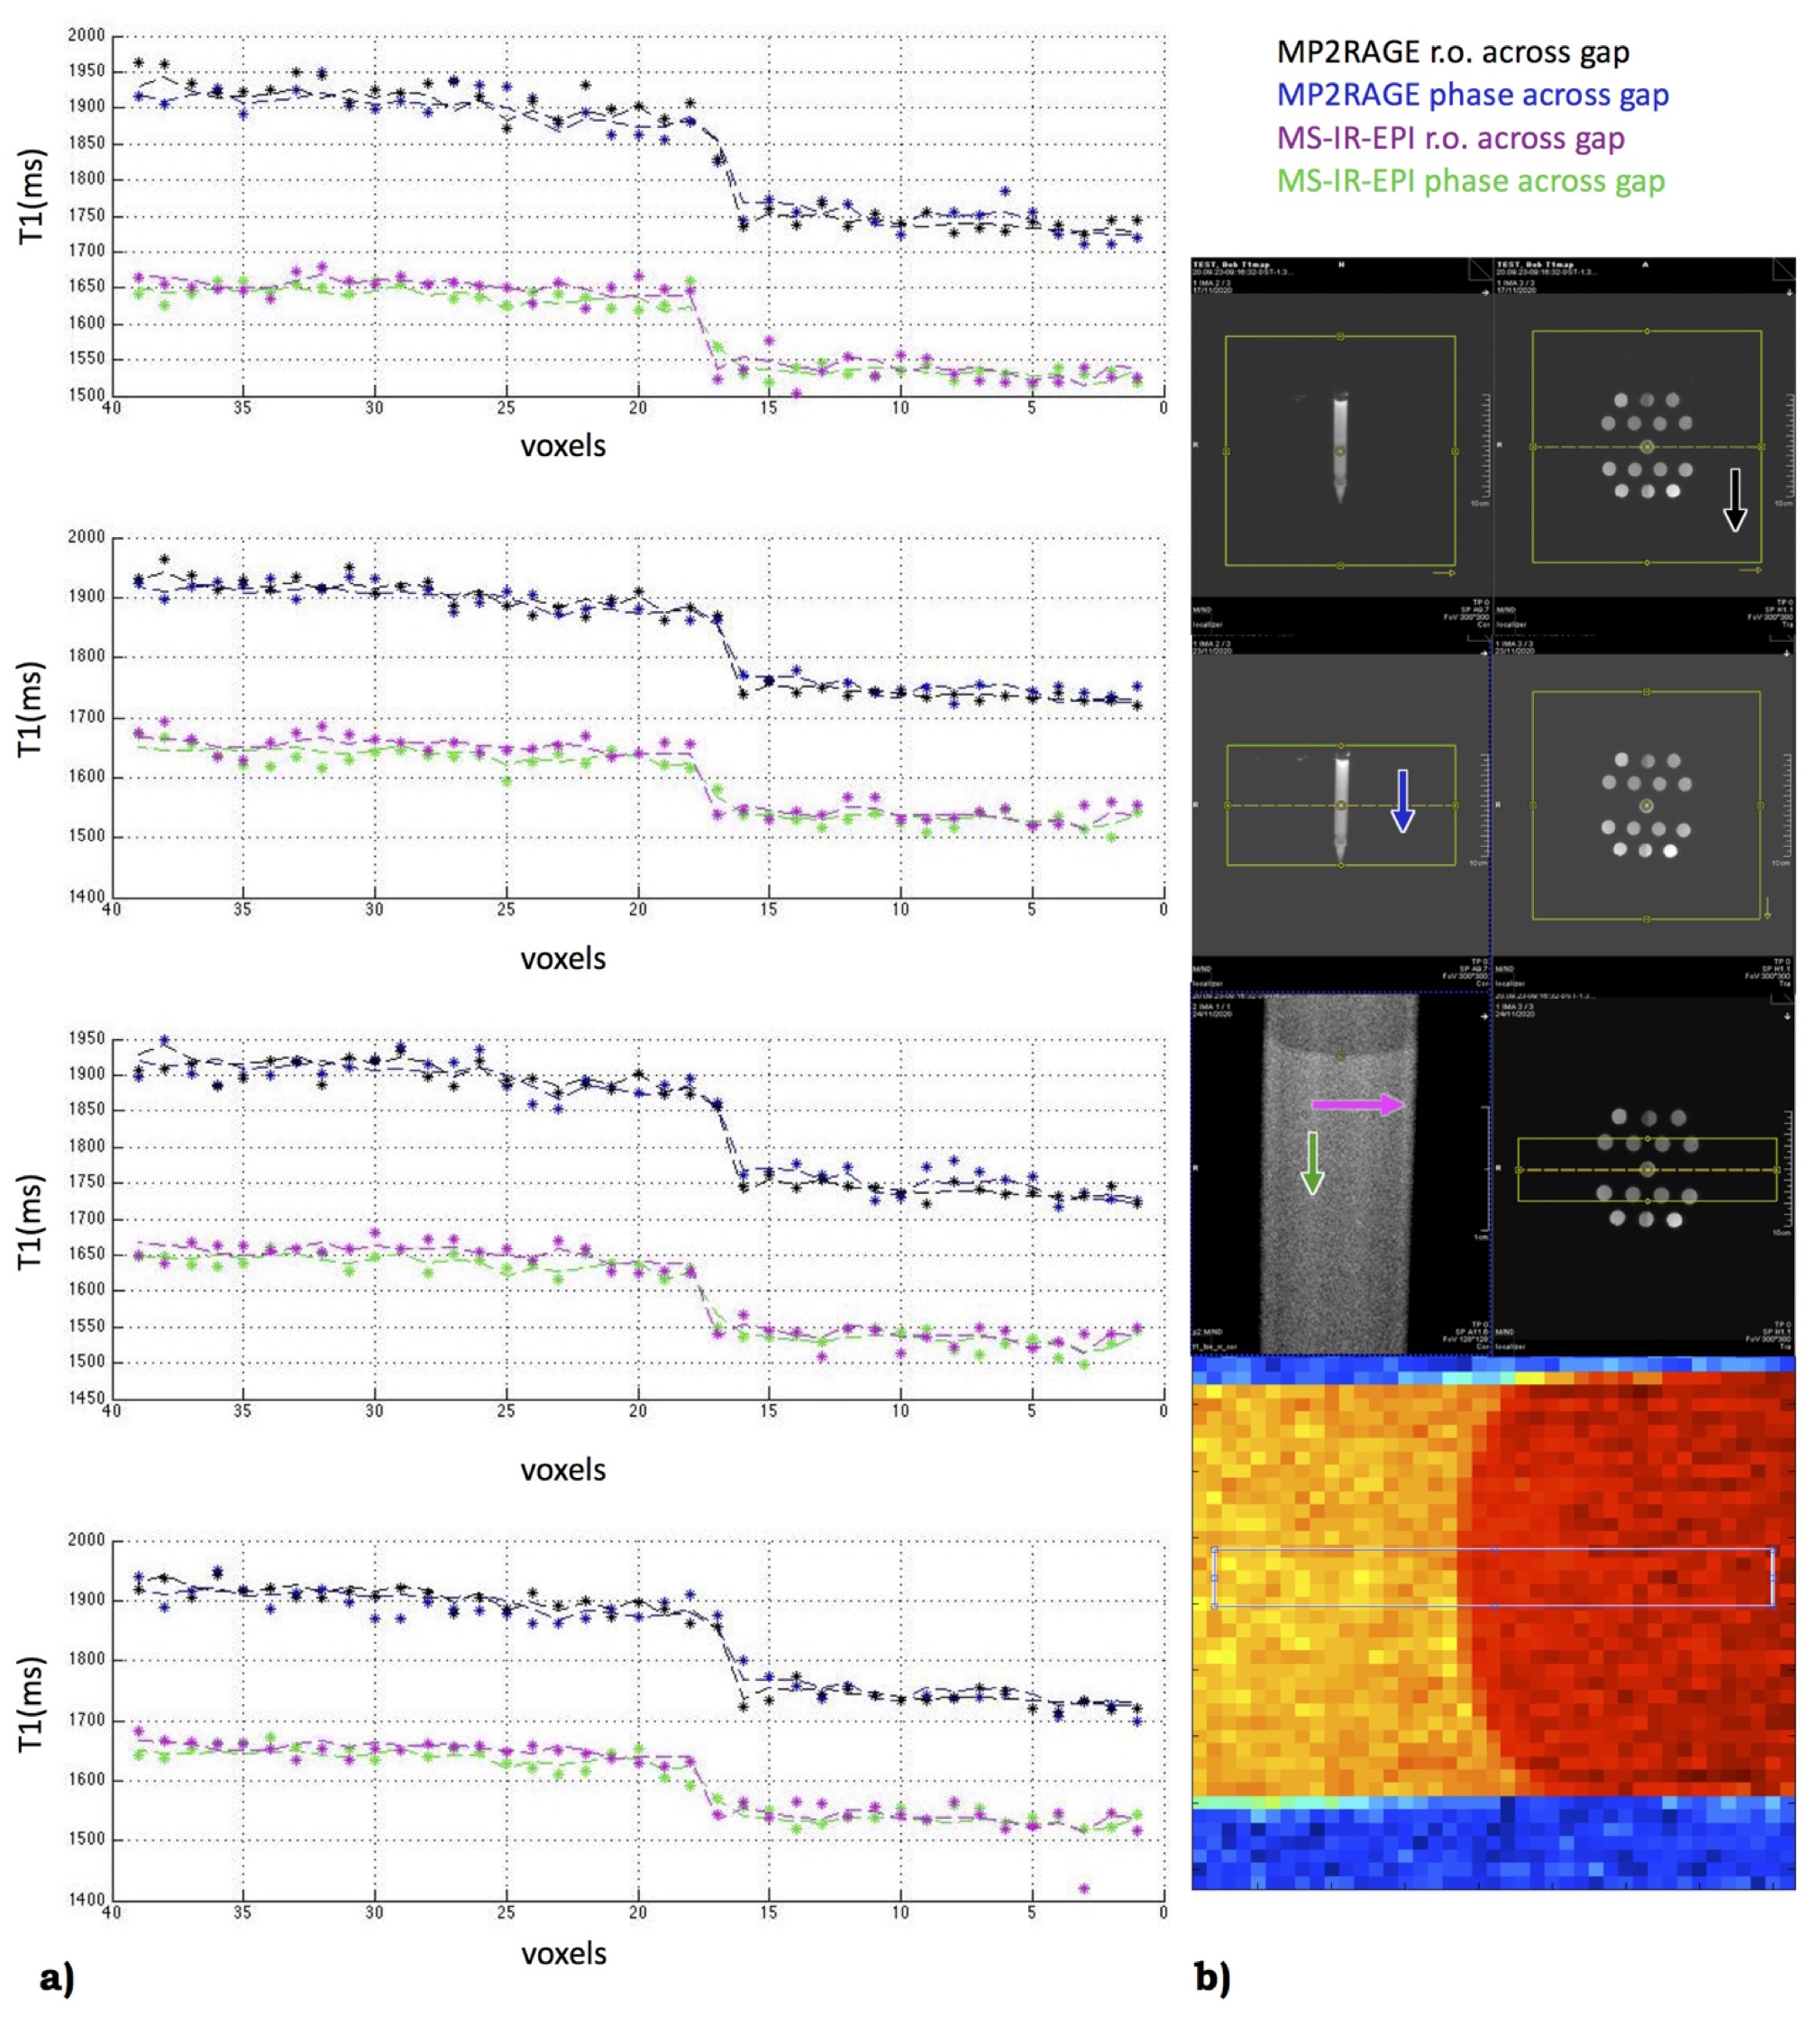
Fig.3. Signal profiles of 4 lines across the gel boundary. Dashed lines represent the average values across the lines. Voxels size is 400µm; b) From top: legend, positioning for MP2RAGE and MS-IR-EPI, the 4 lines sampling. Arrows indicate phase (phase 2 for MP2RAGE) direction. Both MPRAGE and MS-IR-EPI show a good profile, mostly affected by the true object shape/partial volume/k-space sampling effect. The difference in T1 estimation is expected, being MP2RAGE protocol suboptimal to assess a 1500ms T1 (our focus is on PSF here).
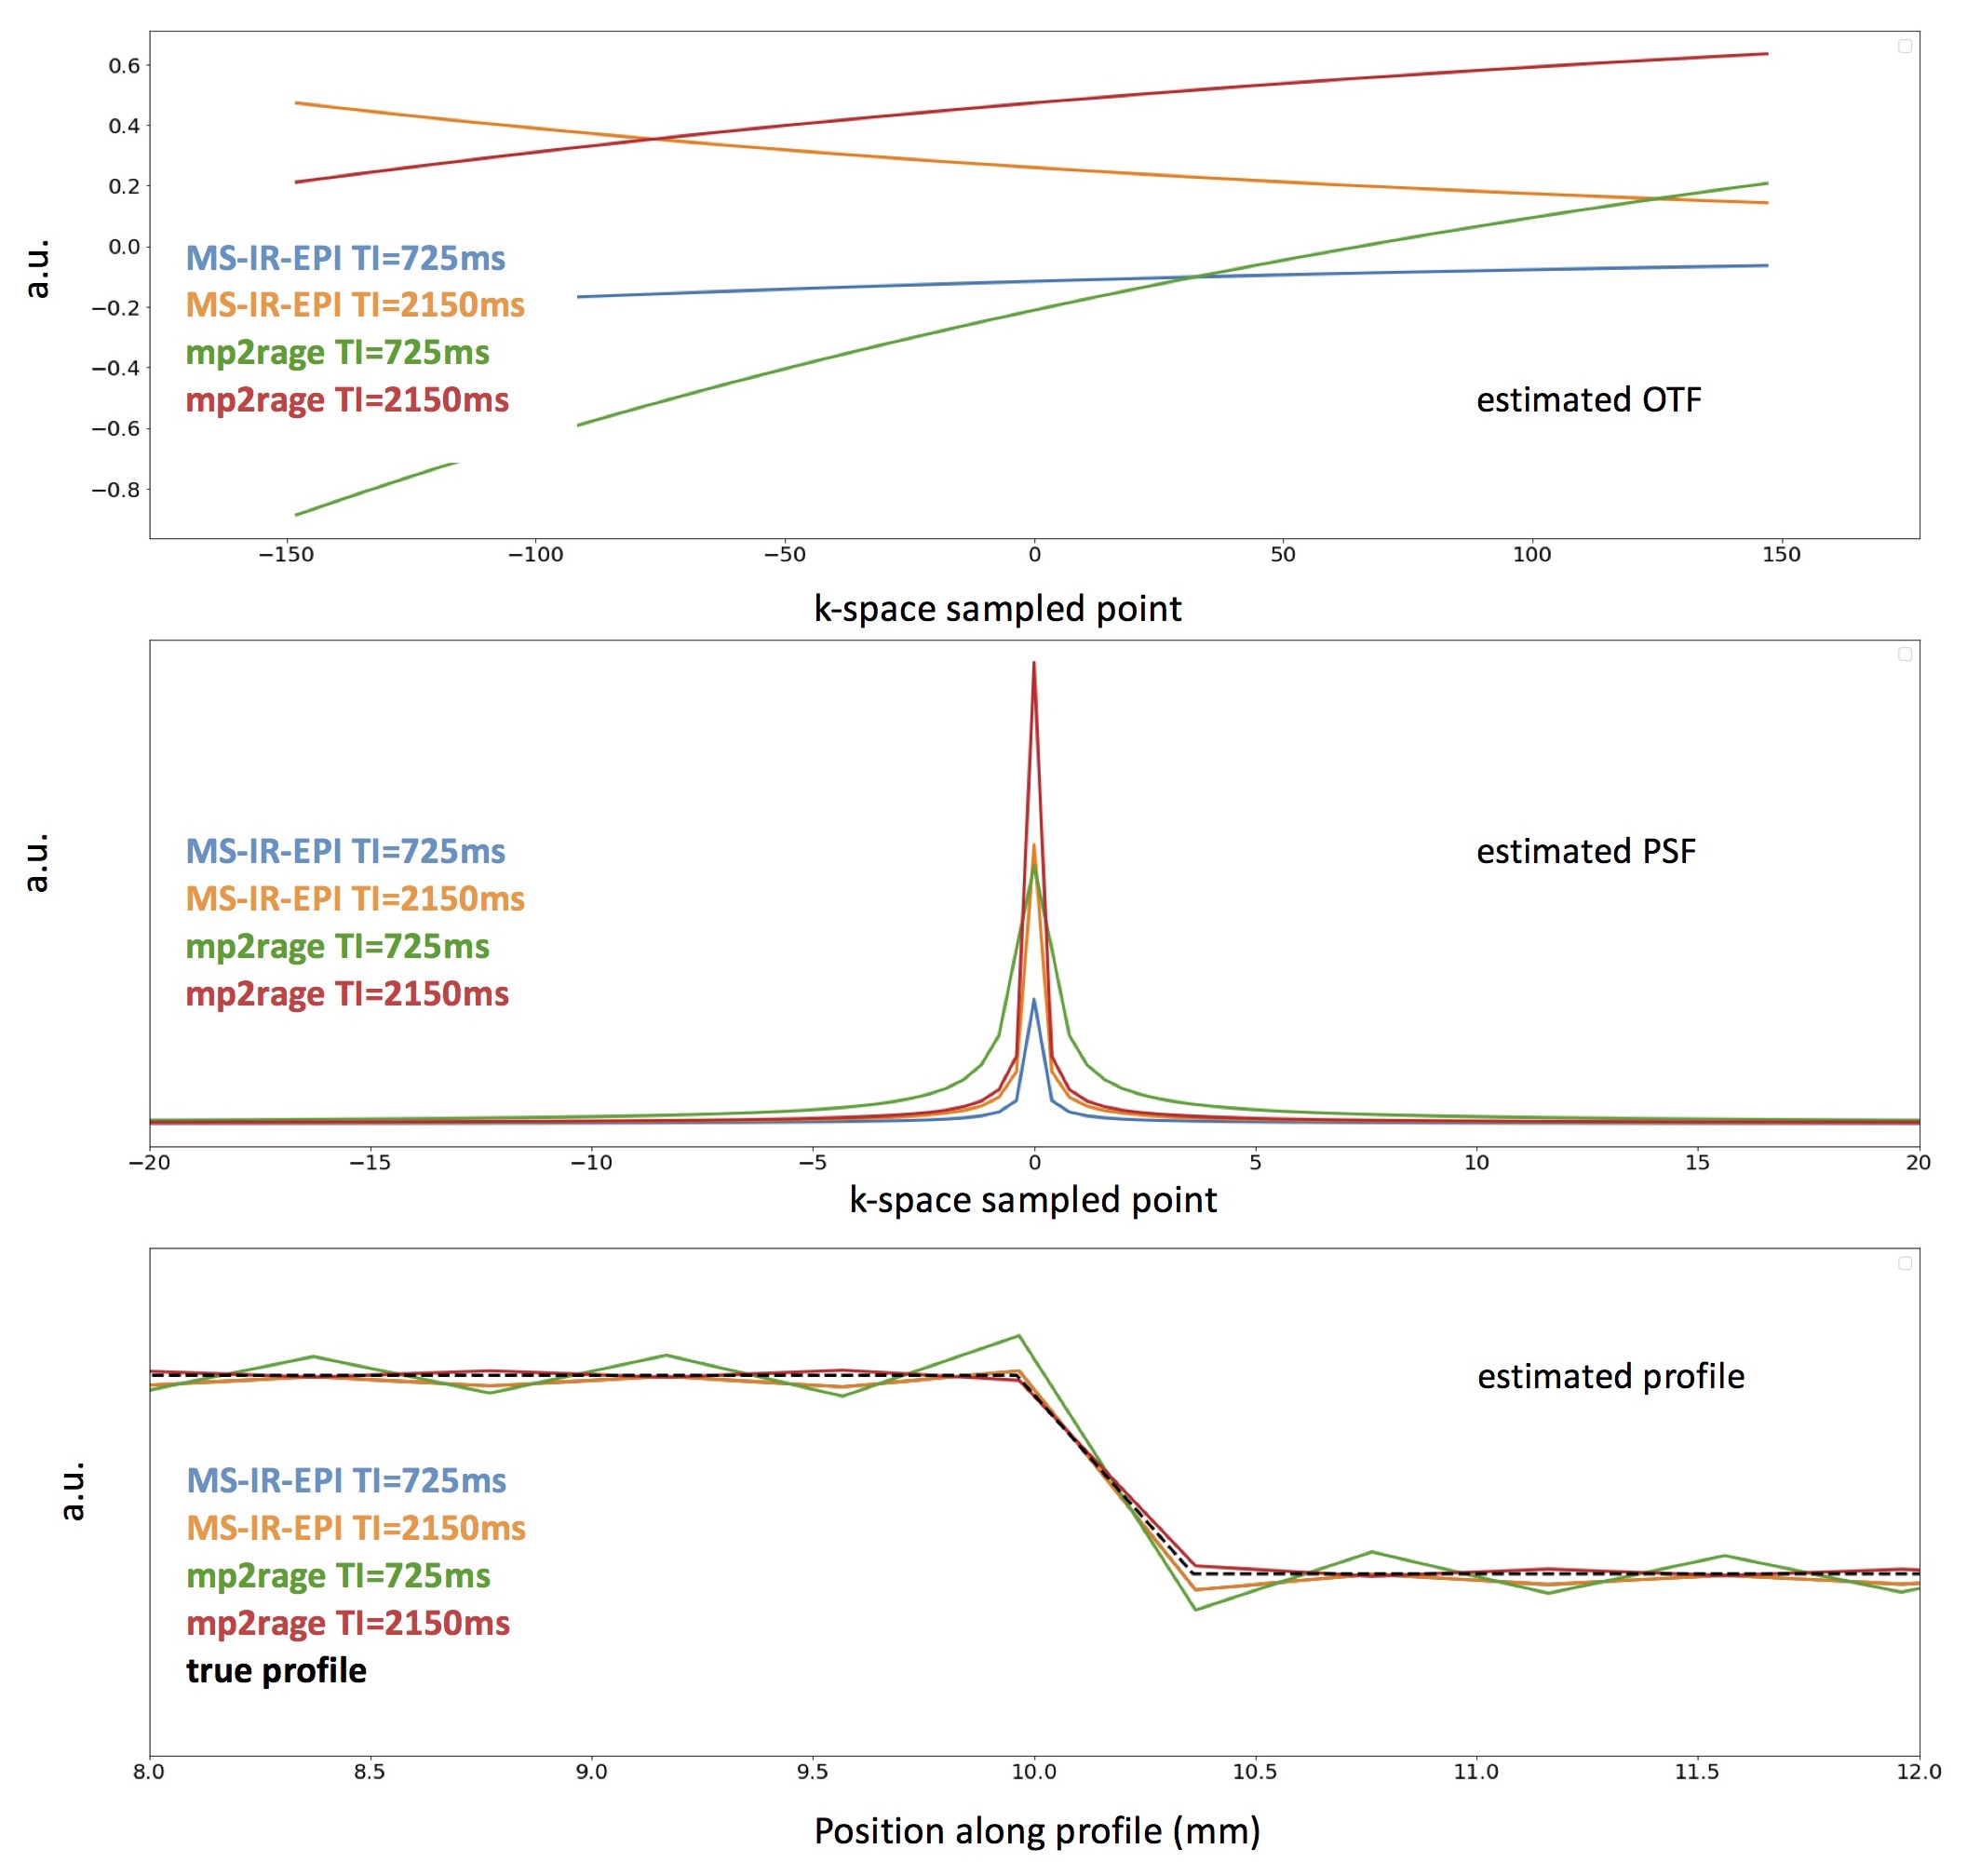
Fig.4. OTF, PSF and signal intensity profile estimated for an image profile with a gel boundary thickness similar to that of phantom #14. T1=1500ms. The true profile is superimposed. For sake of simplicity, full-Fourier versions were simulated. The estimated MS-IR-EPI and TI=2250 MP2RAGE profiles are close to the true profile. The estimated PSF and signal profile of MP2RAGE for TI=800ms show significant broadening, incompatible with imaging typical cortical myelinated layers
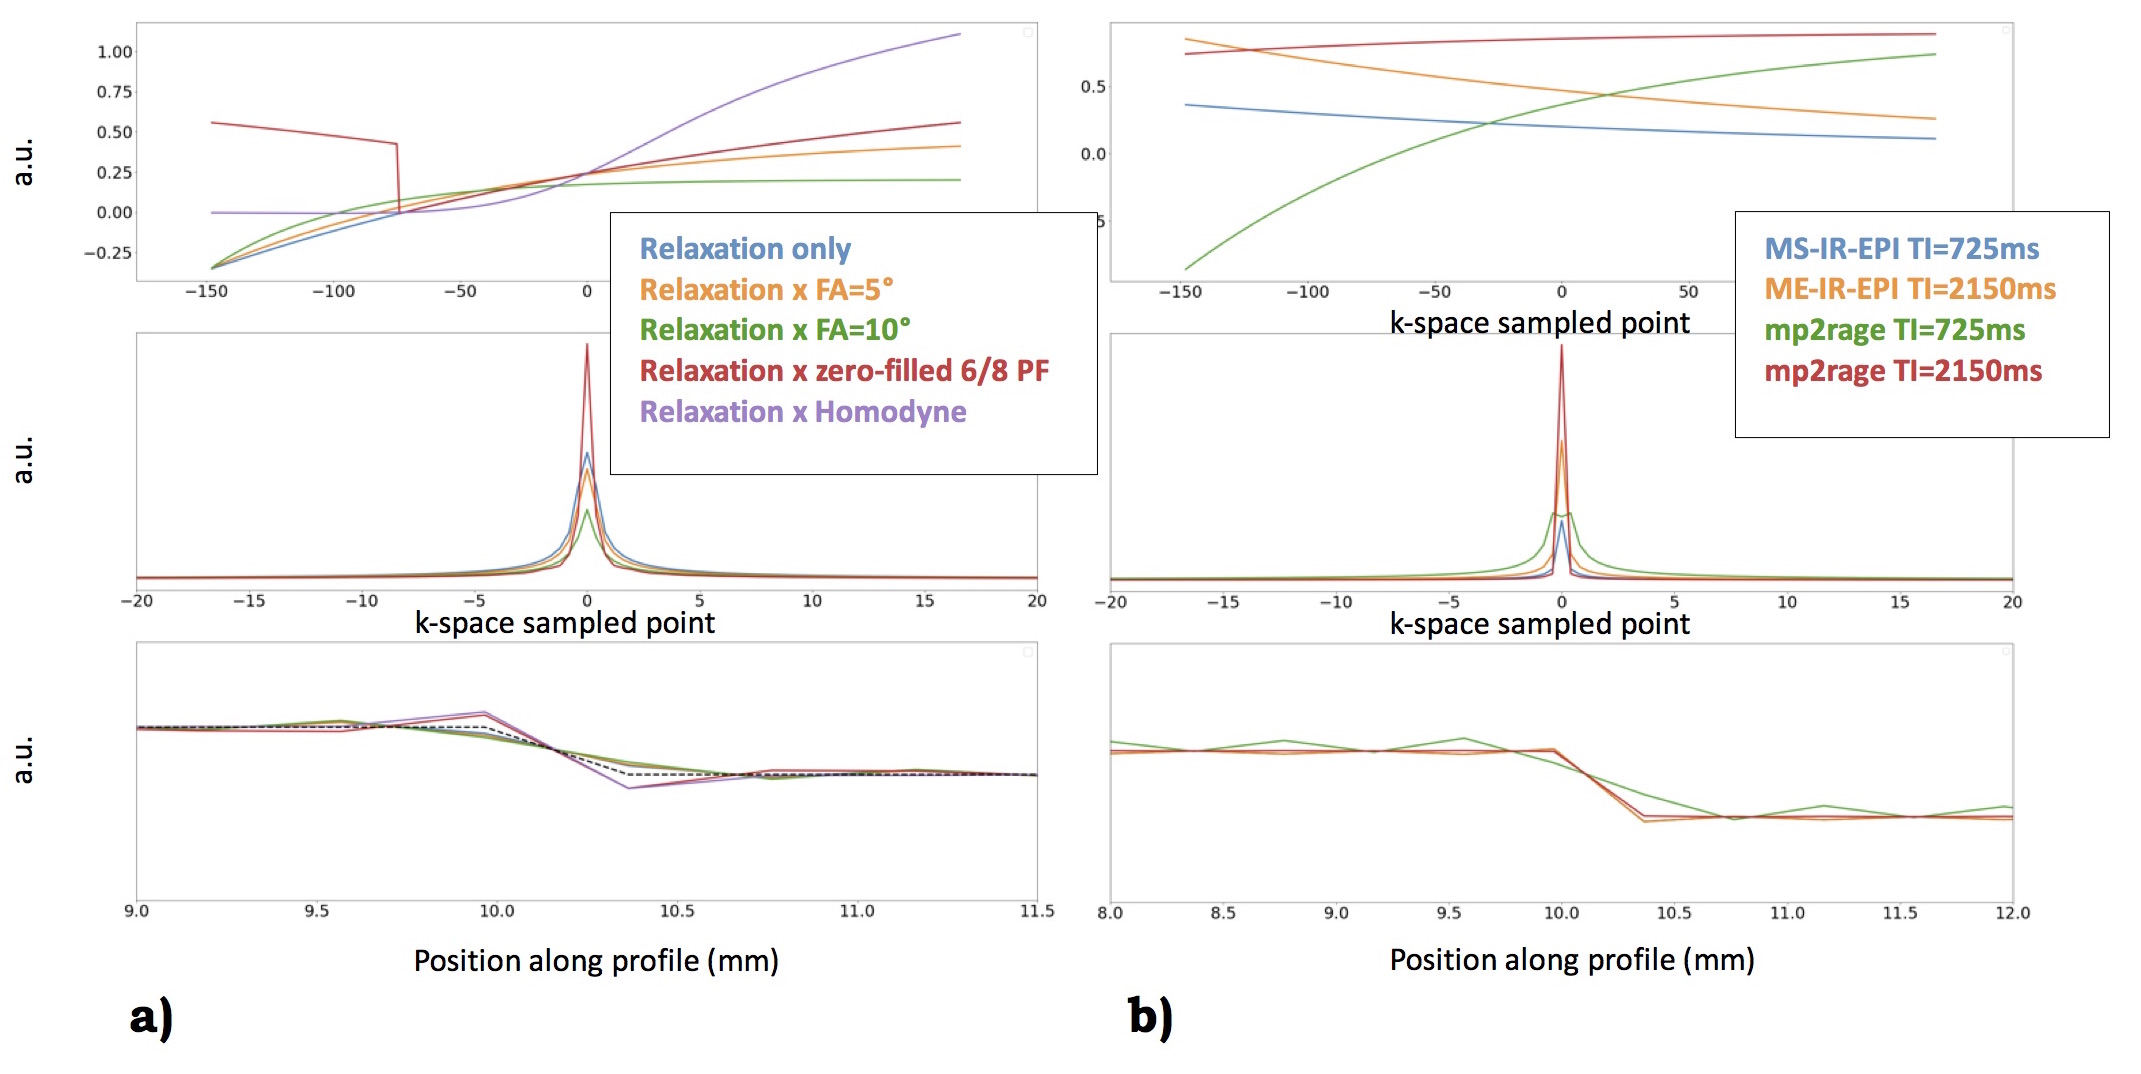
Fig.5. a) From top: OTF, PSF and apparent profile estimation for MP2RAGE with and without inclusion of the effect of the small flip angle RF pulses (5° and 10°), as well as zero-filled or Margosian/Homodyne corrected partial Fourier. b) MS-IR-EPI and MP2RAGE OTF, PSF, and profile estimations for standard measurements and grey matter myelin T1 (600ms).