3319
The impact of multi-compartment microstructure on single-compartment T1 estimates1Wellcome Centre for Human Neuroimaging, UCL Queen Square Institute of Neurology, University College London, London, United Kingdom, 2Centre de Résonance Magnétique des Systèmes Biologiques, UMR5536, CNRS/University Bordeaux, Bordeaux, France, 3Laboratory for Research in Neuroimaging, Department for Clinical Neuroscience, Lausanne University Hospital and University of Lausanne, Lausanne, Switzerland, 4Department of Systems Neurosciences, University Medical Center Hamburg-Eppendorf, Hamburg, Germany, 5Department of Neurophysics, Max Planck Institute for Human Cognitive and Brain Sciences, Leipzig, Germany
Synopsis
Quantitative relaxometry in the brain is appealing because of its microstructural sensitivity. Estimating bulk parameters assumes a single relaxation time per voxel, which is only valid when the residency time is short with respect to T1. In reality, the relative contribution of sub-compartments will depend on flip angle and echo time. Here, we simulate a two-compartment model (myelin and intra-extracellular water) and estimate T1 with FA-specific signals derived via three estimation schemes. We quantify the impact of myelin water fraction, residency time and transmit field inhomogeneity on these estimates and find good correspondence with in vivo T1 estimates at 7T.
Introduction
Quantitative relaxometry in the brain is appealing because of its microstructural sensitivity. However, the estimation of bulk parameters assumes a single relaxation time per voxel. This is only valid under the assumption of fast exchange, whereby the residency time in a given microenvironment is short with respect to the relaxation time. In reality sub-compartments contribute to the measured signal and vary with flip angle (FA) and echo time, TE (1,2).Here we simulate two exchanging water pools and derive FA-specific signals via three estimation schemes before estimating a bulk T1 assuming a single compartment. The sensitivity of these estimates to myelin water fraction (fMW), residency time and transmit field inhomogeneity (B1+eff = actual FA/nominal FA) is quantified, and compared to in vivo T1 estimates at 7T.
Methods
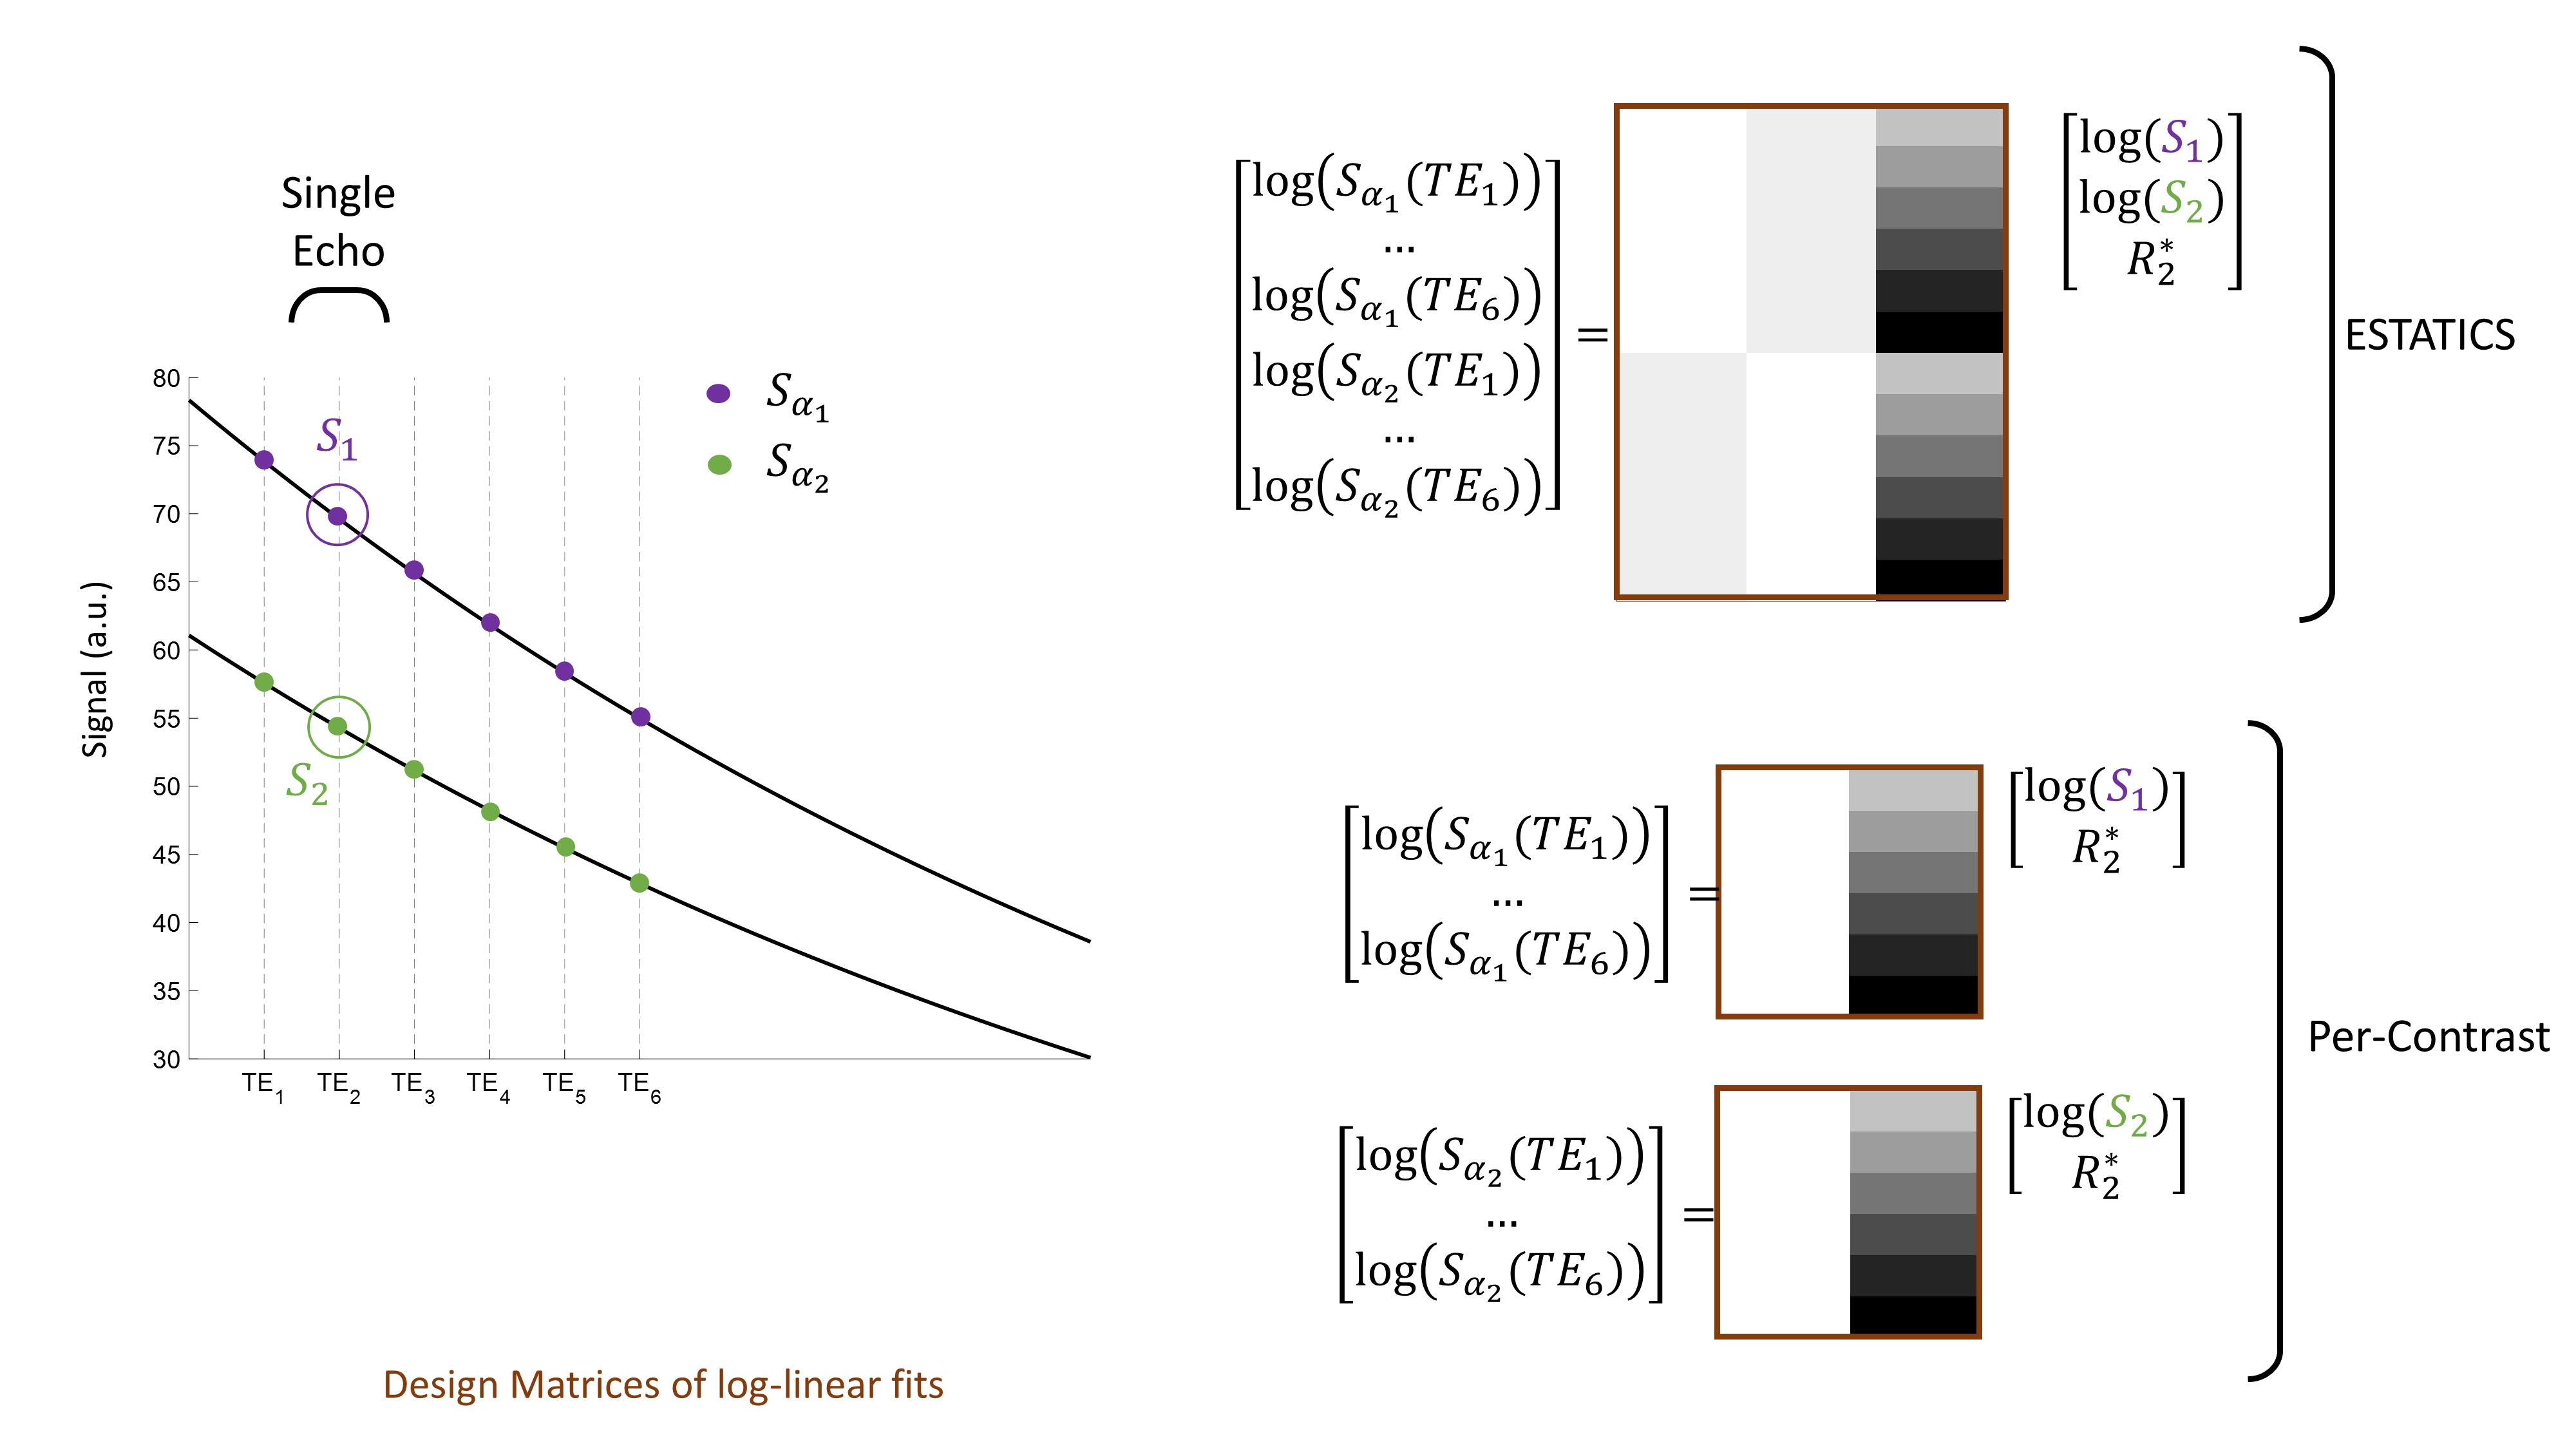
SimulationsThe spoiled gradient echo signal for a two-compartment model was simulated using the Bloch-McConnell equations implemented with the EPG formalism (3). Spoiling assumed a 6π moment per TR and an RF spoiling increment of 144°. B1+eff was varied according to [0.4:0.2:1.6]. Multi-echo signals were simulated with FA of 6° and 26° respectively, with TR=19.5ms and TE=[2.56:2.30:14.5]ms. T1 was estimated analytically (4) using signals S1 and S2 derived from these data in three different ways (Figure 1):
- Single-echo: FA-specific signals at TE=4.86ms.
- Per-contrast: intercepts estimated from a log-linear fit for each FA separately.
- ESTATICS: pooling both FA and performing a single log-linear fit assuming a common decay. This method is appealing because it exhibits enhanced robustness to low SNR and motion (2).
In vivo Acquisitions
Variable FA data were acquired at 7T with acquisition settings matching the simulations, a FOV of 192×192×160mm3 and 1mm isotropic resolution, three RF spoiling increments (50°, 117°, 144°) and two nominal B1+eff (100% and 160%, obtained by scaling the nominal transmitter voltage). T1 maps were estimated for these six conditions using each estimation scheme described for the simulations, leading to a total of 18 T1 maps. GM and WM T1 estimates, from voxels in which the target B1eff was obtained, were compared with simulations.
Results
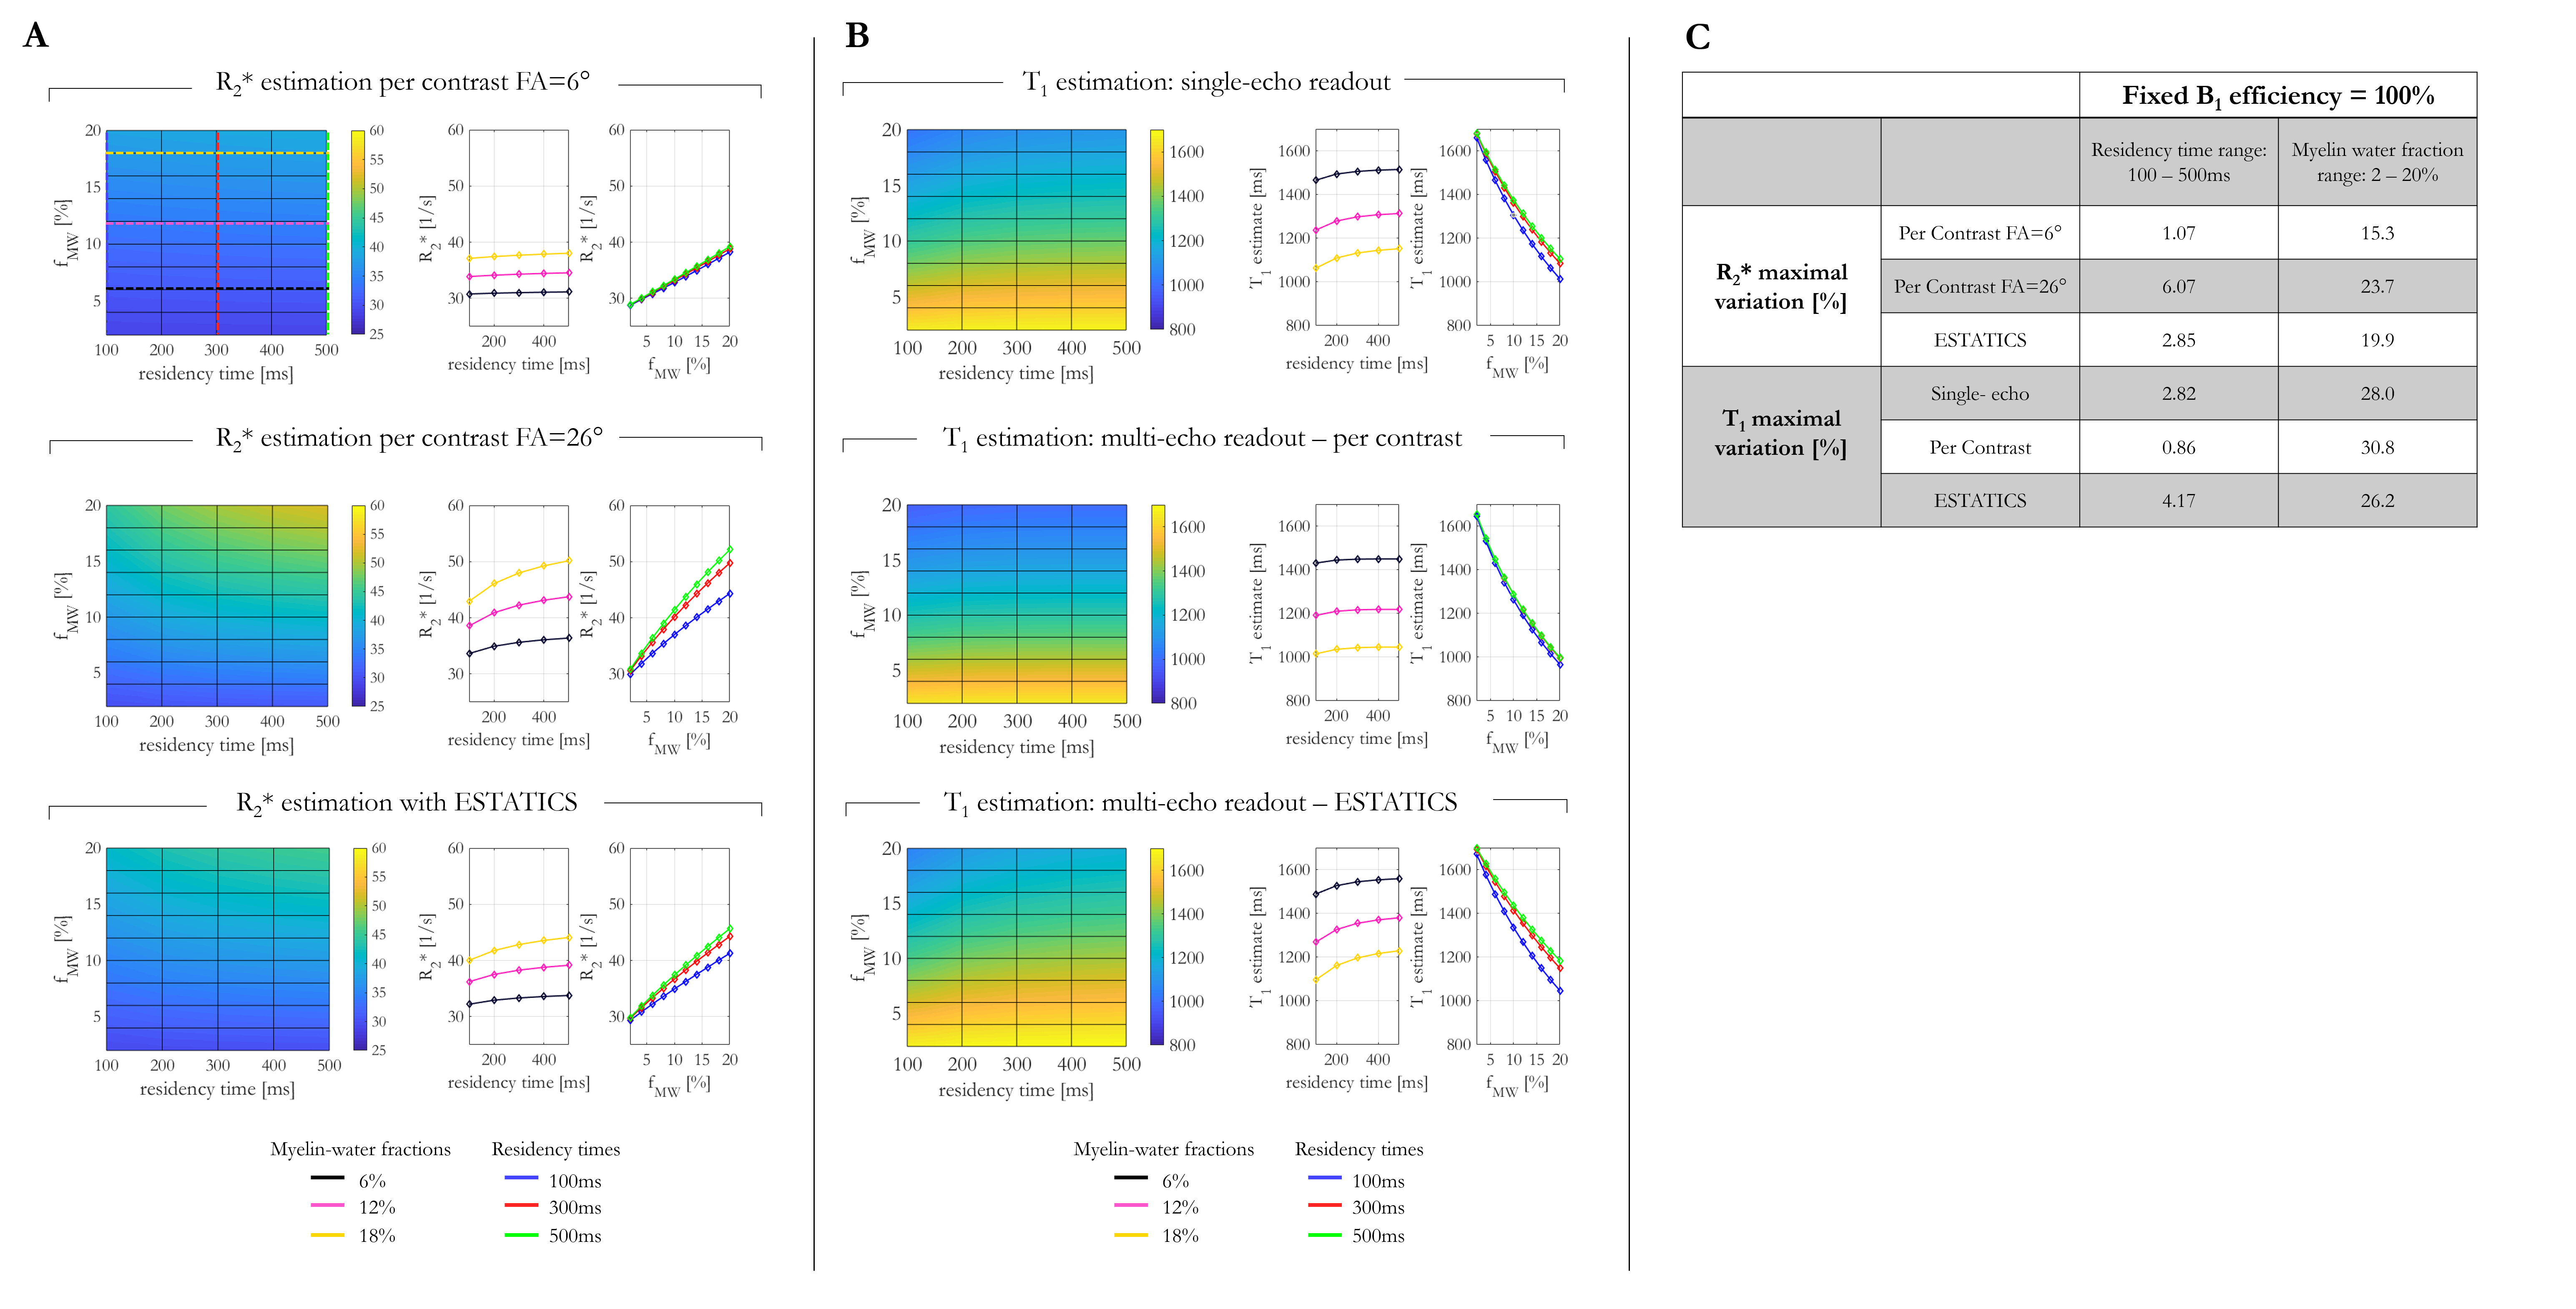
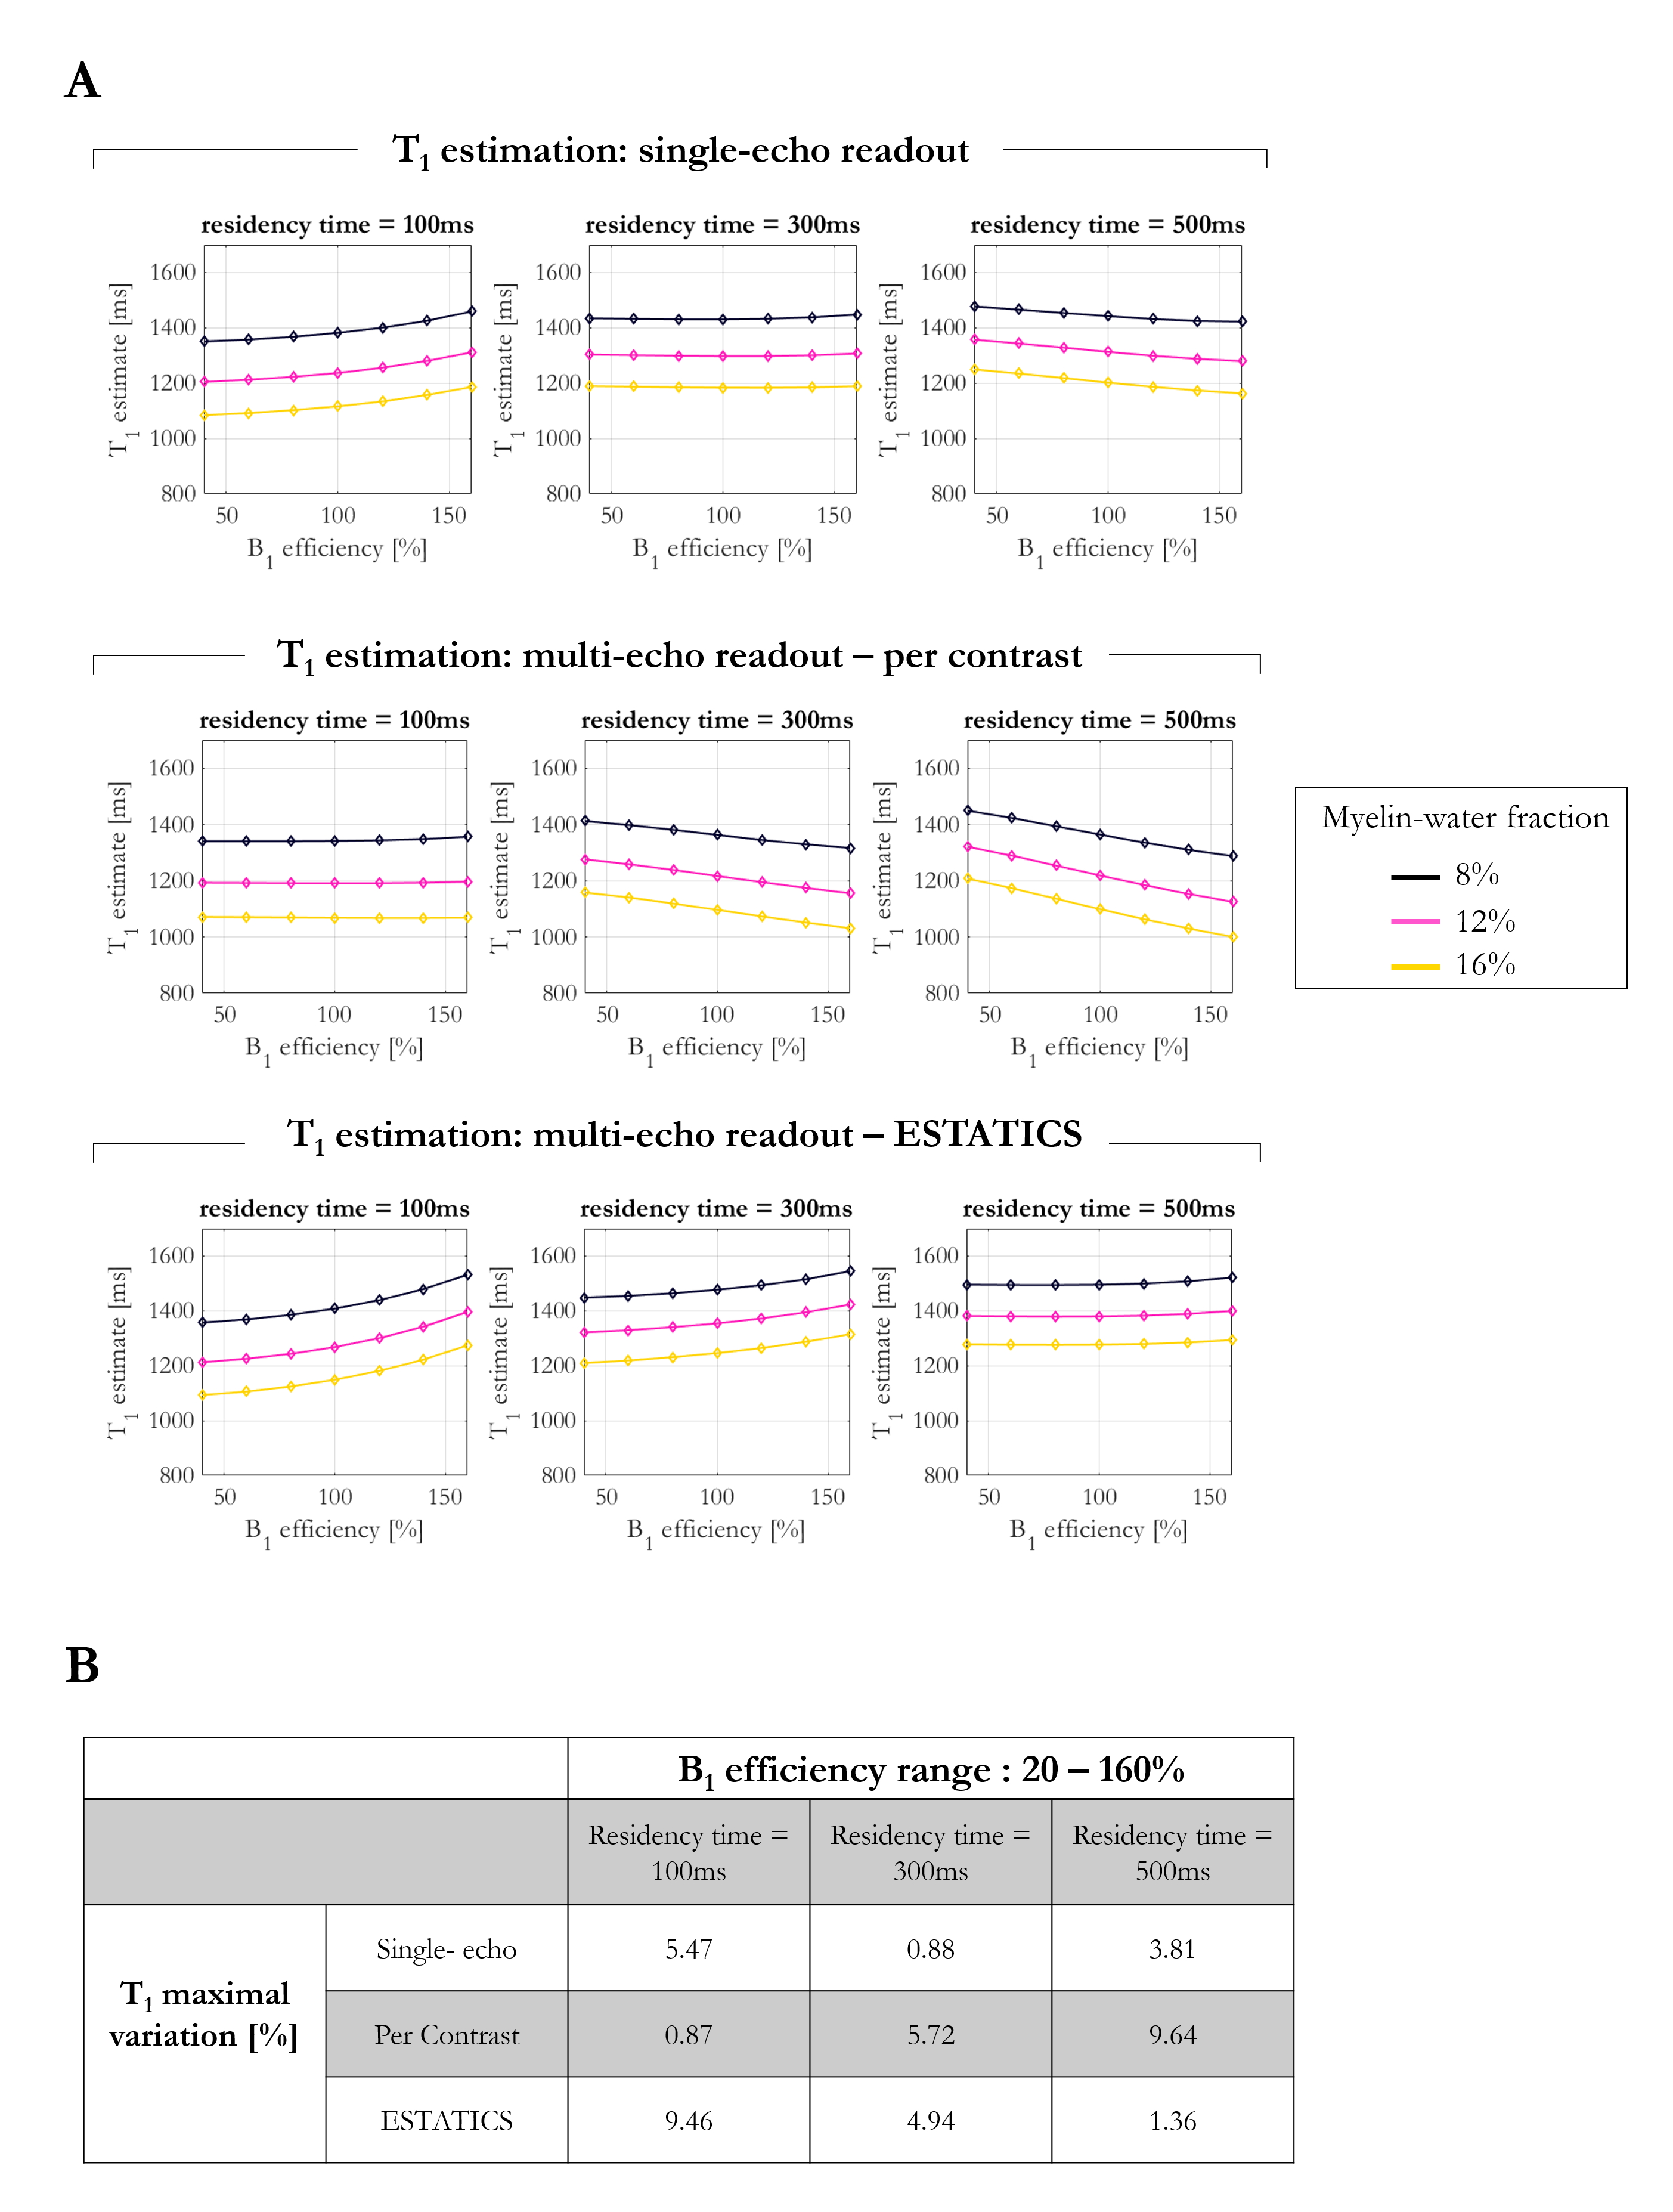
R2* and T1 estimates depended on fMW and residency time, with the sensitivity depending on the estimation scheme (Figure 2). R2* estimates obtained with the higher FA of 26° showed the greatest variation (6.07% and 23.70% respectively). While the T1 estimates all varied with fMW (~30%), the dependence on residency time varied across estimation schemes, with the ESTATICS approach showing largest sensitivity (4.17%).T1 decreased with increasing fMW in all cases, regardless of residency time. B1+eff altered the dependence on residency time (Figure 3). While ESTATICS showed greatest variation with B1eff when the residency time was short (100ms, 9.46% v’s 0.87%), the per-contrast estimates showed greater variation at longer residency time (500ms, 9.64% v’s 1.36%). The single echo case showed intermediate sensitivity.
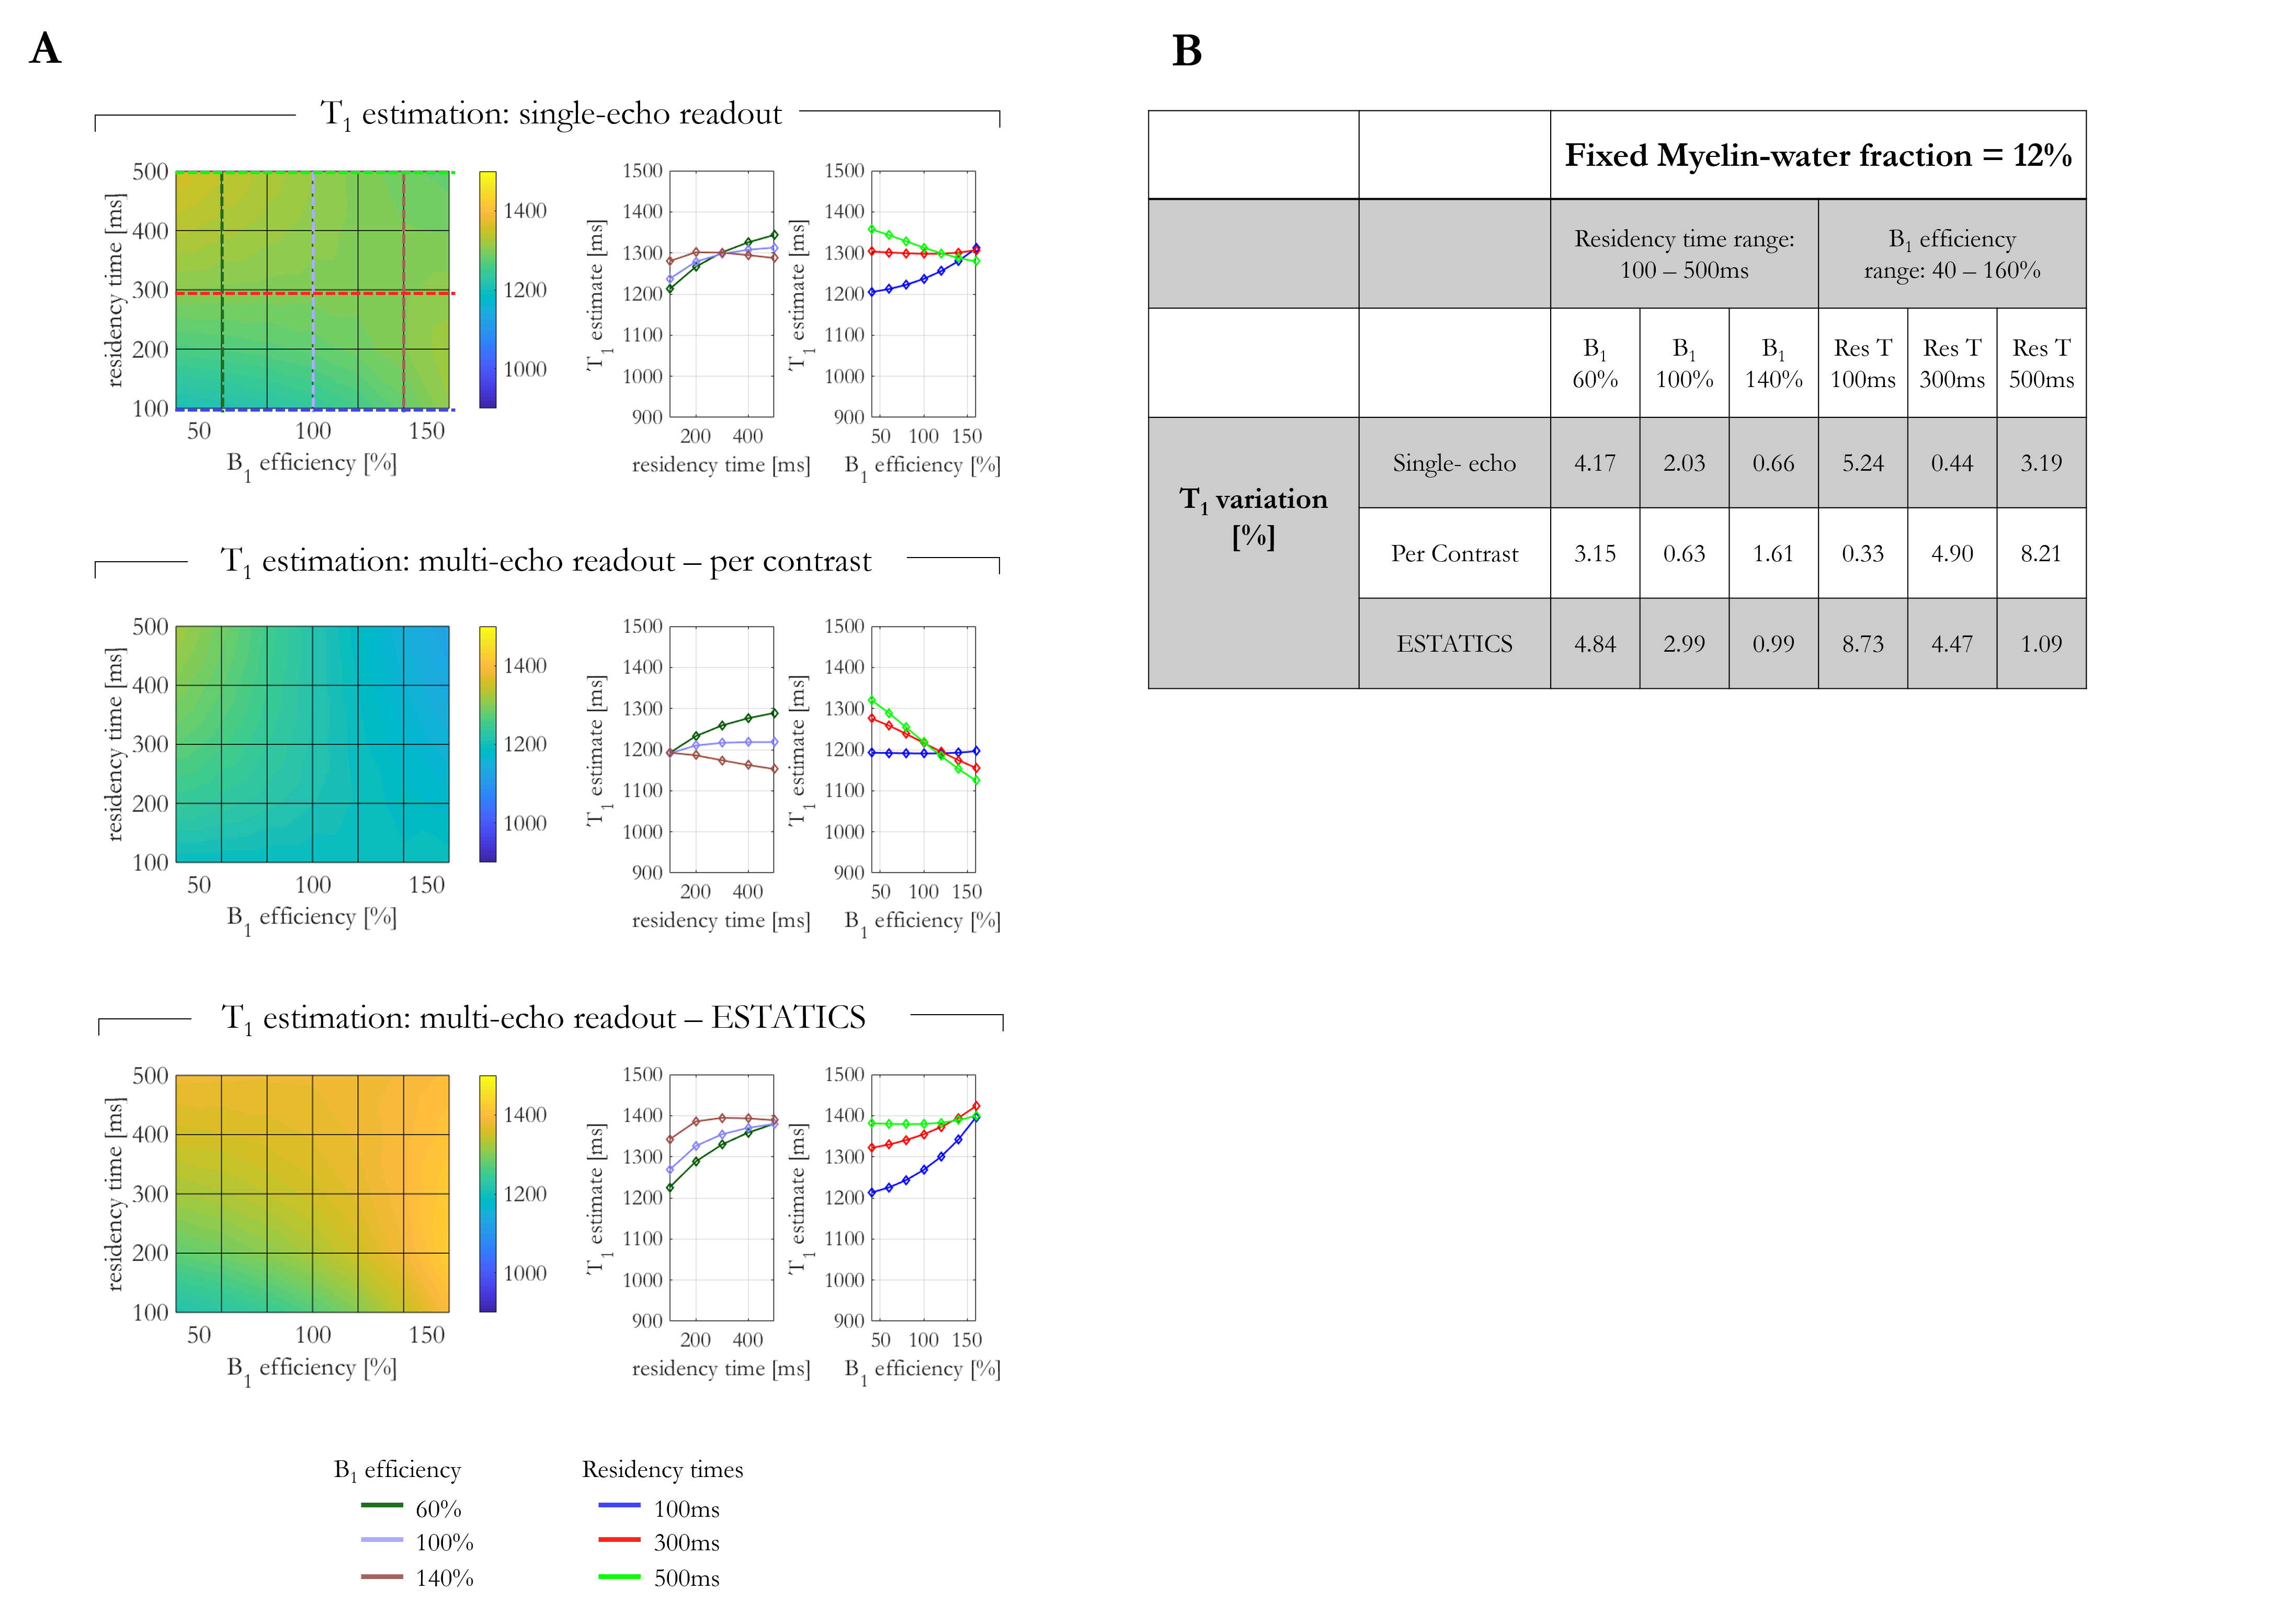
Per-contrast T1 estimates decreased with residency time for B1eff >100% but increased for B1eff < 100% (Figure 4). With ESTATICS, T1 estimates increased with residency time for all B1eff. The single-echo case again showed intermediate behaviour.
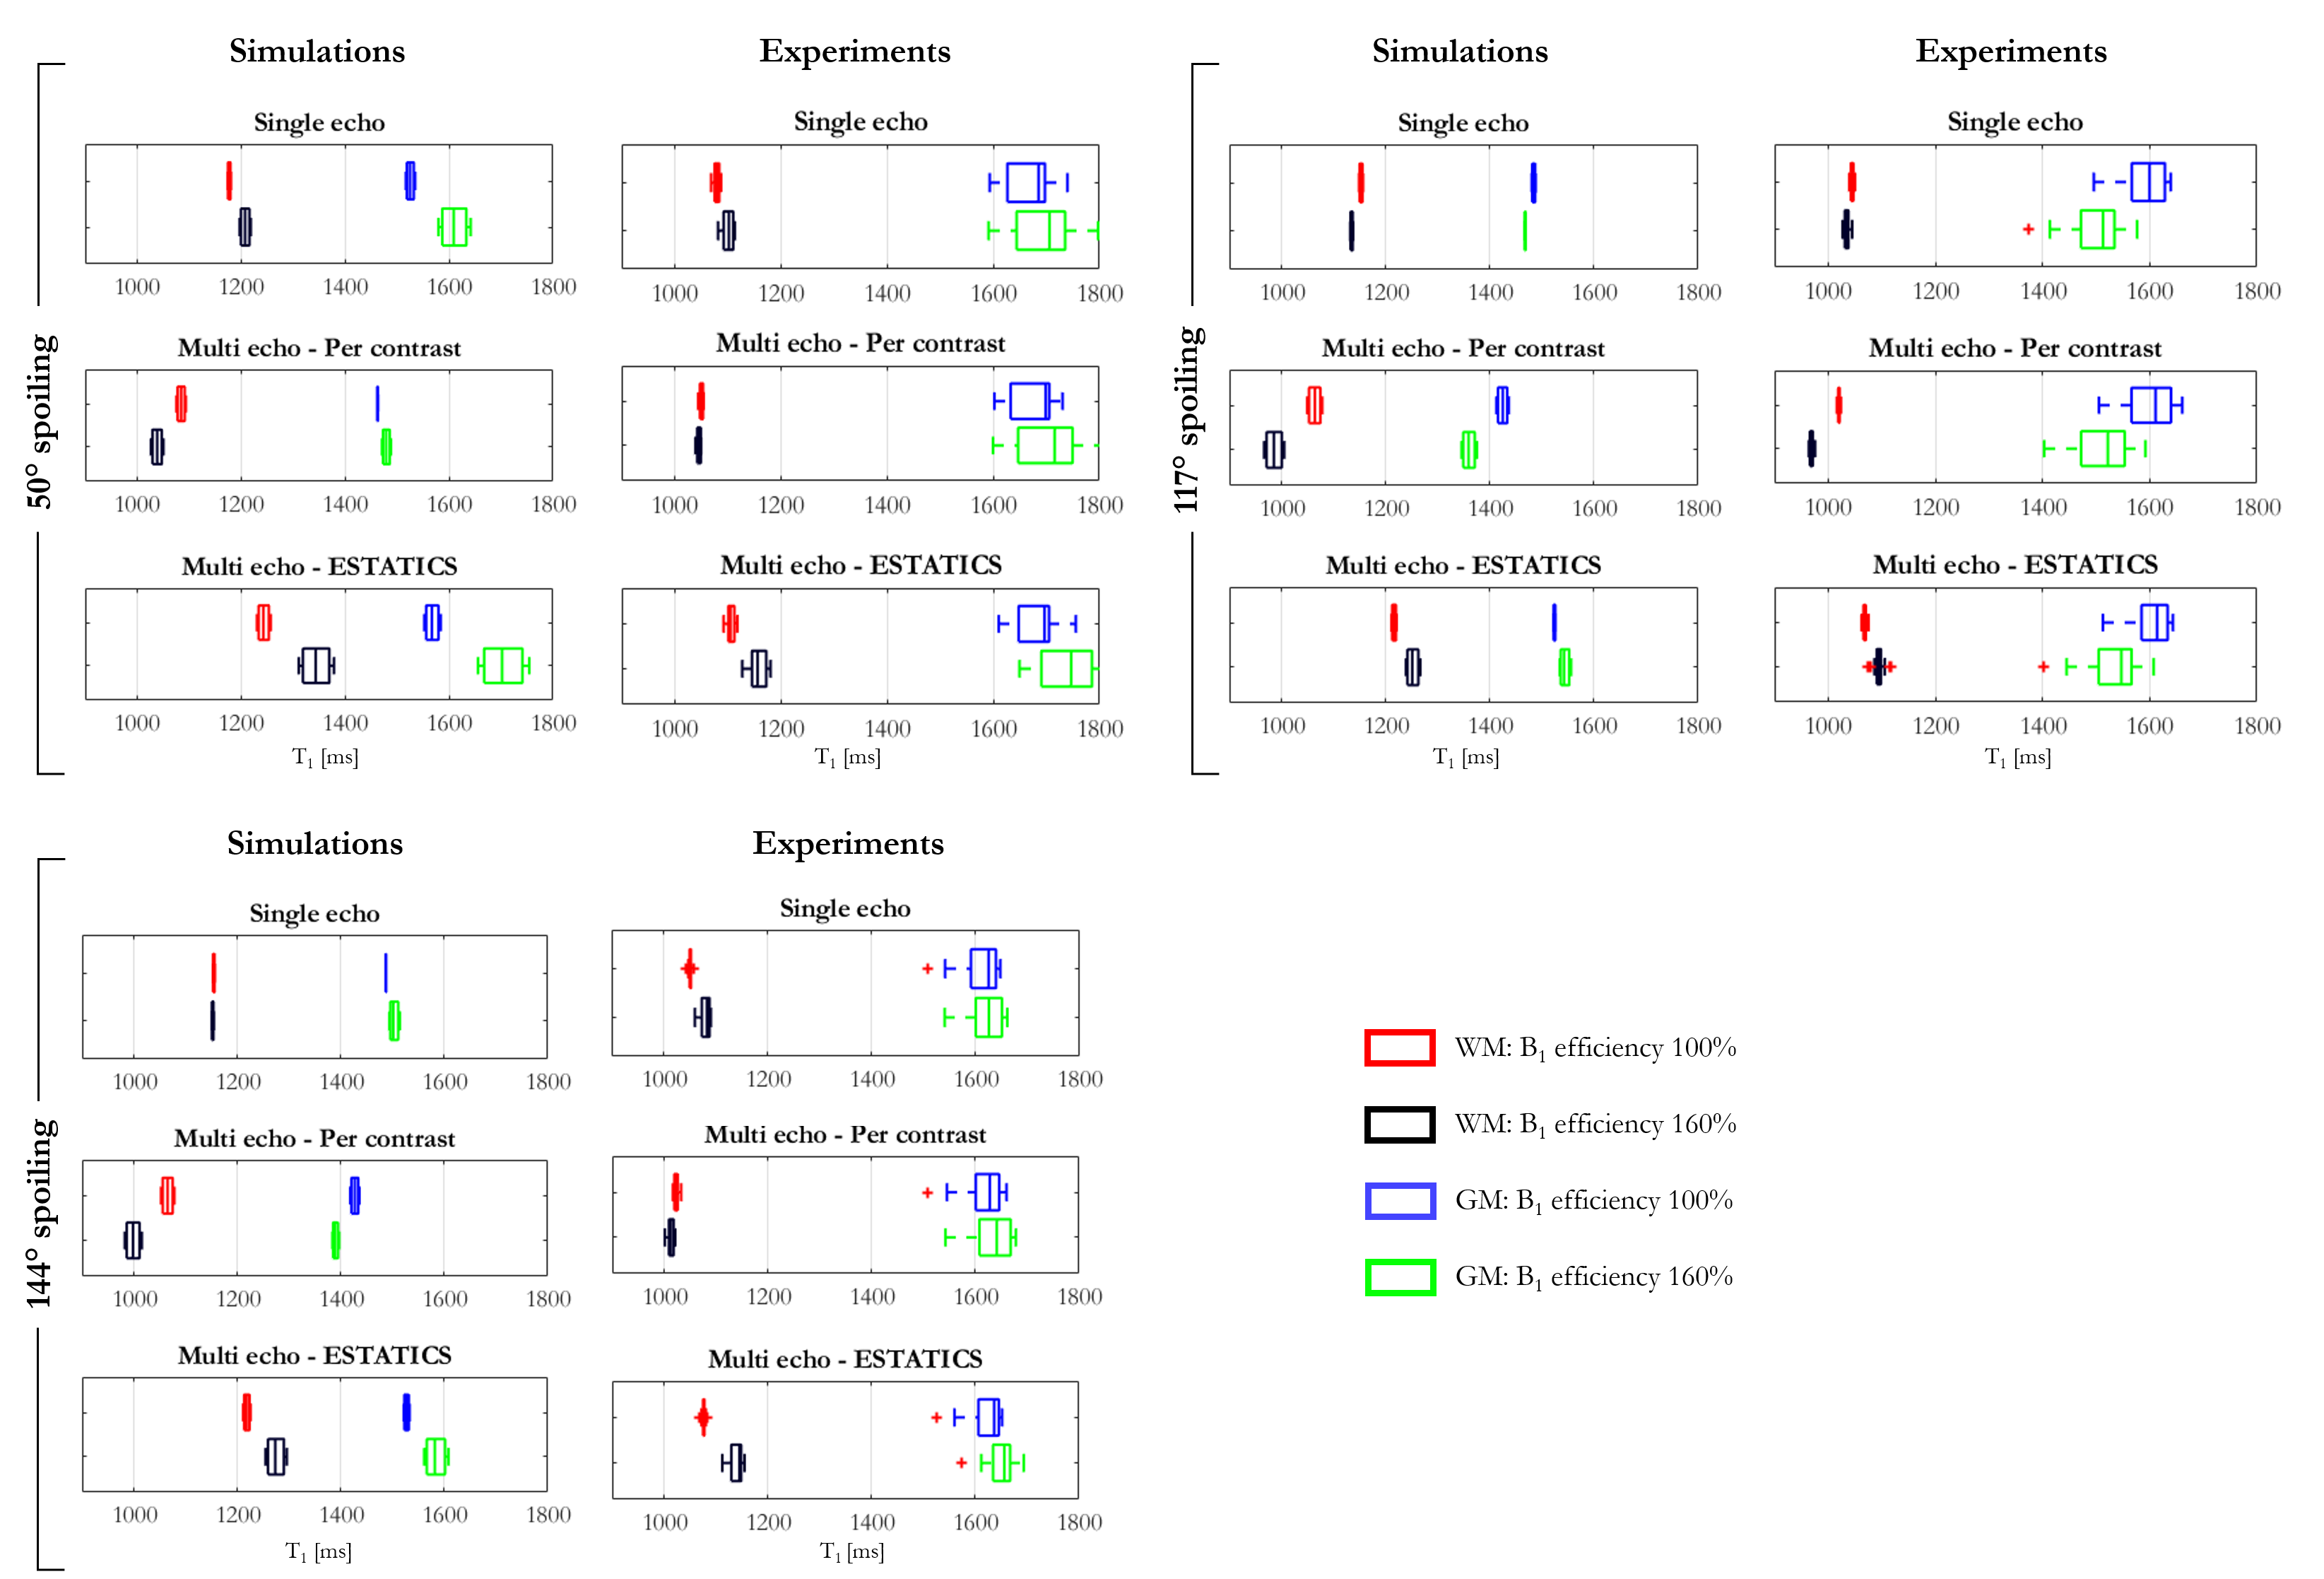
Experimentally measured T1 times showed the same trends across estimation schemes as simulations carried out with fMW = 6% and 16% for WM and GM respectively, a residency time of 300ms, the three RF spoiling increments and two B1+eff (Figure 5).
Discussion
More rapid relaxation was observed with increasing fMW as expected. However, the exact dependence varied across estimation schemes. Highest T1 variation was observed with the per-contrast approach, likely driven by the larger sensitivity to the variable weighting of the sub-compartments across FA.Residency time showed a lesser, though still appreciable (Figure 4), effect on T1, which interacted with B1eff with the per-contrast and ESTATICS schemes showing opposite behaviour. The behaviour of the single-echo approach was intermediate. However, the exact behaviour will depend on the choice of TE: T1 variations converge on the per-contrast scheme at short TE, but on ESTATICS-like behaviour at long TE (data not shown).
The dependence of the calculated T1 on how S1 and S2 are estimated was also observed in vivo. Generally, when B1eff increased T1 estimates derived with ESTATICS increased, whereas with the per-contrast scheme they decreased. While many parameters had to be assumed (e.g. residency time of 300ms, fMW of 6 and 12% for GM and WM respective), there was broad agreement between the simulations and experiments, plausibly suggesting an intermediate exchange regime in vivo.
Conclusion
Great care must be taken when assuming a single compartment with variable FA-based T1 estimates. This simplification not only impact R2* estimates, but propagates through to T1 leading to variability that is observable in vivo. Furthermore, this variance depends on tissue features (e.g. fMW, residency time), hardware settings (B1eff) and sequence choices (notably TE and echo spacing).Acknowledgements
The Wellcome Centre for Human Neuroimaging is supported by core funding from the Wellcome [203147/Z/16/Z].References
1. Chan K-S, Marques J. Multi-compartment relaxometry and diffusion informed myelin water imaging – promises and challenges of new gradient echo myelin water imaging methods. Neuroimage 2020;221:117159. doi: 10.1016/j.neuroimage.2020.117159.
2. Weiskopf N, Callaghan MF, Josephs O, Lutti A, Mohammadi S. Estimating the apparent transverse relaxation time (R2*) from images with different contrasts (ESTATICS) reduces motion artifacts. Front. Neurosci. [Internet] 2014;8:1–10. doi: 10.3389/fnins.2014.00278.
3. Malik SJ, Teixeira RPAG, Hajnal J V. Extended phase graph formalism for systems with magnetization transfer and exchange. Magn. Reson. Med. [Internet] 2018;80:767–779. doi: 10.1002/mrm.27040.
4. Mohammadi S, D’Alonzo C, Ruthotto L, Polzehl J, Ellerbrock I, Callaghan MF, Weiskopf N, Tabelow K. Simultaneous adaptive smoothing of relaxometry and quantitative magnetization transfer mapping. 2017. doi: 10.20347/WIAS.PREPRINT.2432.
5. Labadie C, Lee J-H, Rooney WD, Jarchow S, Aubert-Frécon M, Springer CS, Möller HE. Myelin water mapping by spatially regularized longitudinal relaxographic imaging at high magnetic fields. Magn. Reson. Med. [Internet] 2014;71:375–87. doi: 10.1002/mrm.24670.
Figures